


Abstract
Dosimetry in peptide receptor radionuclide therapy using 177Lu-DOTATATE is based on patient imaging during the first week after administration and determination of the activity retention as a function of time for different tissues. For calculation of the absorbed dose, it is generally assumed that the long-term activity retention follows the pattern determined from the first week. This work aimed to investigate the validity of this assumption by performing additional patient measurements between 5 and 10 wk after administration. A further aim was to investigate to what extent absorbed dose values were affected when including these measurements, also taking into account the radionuclide impurity of 177mLu and build-up of secondary 177Lu from the 177mLu decay. Methods: A combination of methods was used: planar γ-camera imaging as part of the clinical dosimetry protocol, determination of the whole-body activity between 5 and 9 wk after injection using spectrometric NaI(Tl) and HPGe detectors, and imaging between 5 and 10 wk after injection for assessment of the activity distribution. From these measurements the long-term retention of activity was determined and the relative influence on absorbed doses calculated. Results: The most important finding was a clearly visualized tumor uptake in images from between 5 and 7 wk after injection and in 1 patient also kidney and spleen uptake in images acquired on day 33. As a consequence, the total-body time–activity curve had a tail, which was not completely captured by imaging during the first week. The absorbed doses to total body and tumors obtained when including these late time points were on average 5%–6% higher than those obtained when using data acquired during the first week. The contributions to the absorbed dose from 177mLu and secondary 177Lu were negligible. Conclusion: At approximately 5–7 wk after injection, there was a measureable amount of 177Lu-DOTATATE in patients, which is mainly governed by retention in tumors. For tumor dosimetry, imaging at a later time than the routinely used 7 d may be warranted. The contribution to the absorbed dose from the radionuclide impurity of 177mLu was negligible.
Peptide receptor radiotherapy (PRRT) has been used with increasing interest during the past 2 decades for the treatment of neuroendocrine tumors. 177Lu-[DOTA0,Tyr3]-octreotate, also known as 177Lu-DOTATATE, is the most widely used radiopharmaceutical in PRRT. Published data demonstrate that 177Lu-DOTATATE is a well-tolerated and effective treatment (1), but there are still many challenges to be met before this therapeutic modality is thoroughly understood, including how it can be further optimized. The Iluminet trial (EudraCT no. 2011-000240-16) is an ongoing trial that includes patients with advanced, well-differentiated neuroendocrine tumors (i.e., Ki-67 ≤ 20%) with a high somatostatin receptor expression. Patients are treated with repeated cycles of 7,400 MBq of 177Lu-DOTATATE. The number of cycles given to an individual patient is determined on the basis of the biologically effective dose delivered to kidney, which is regarded as the principal organ at risk. The procedure for dosimetry involves imaging on 4 occasions during the first week after infusion, from which the renal activity and absorbed-dose rate are determined and a time–activity curve is fitted and integrated for calculation of absorbed dose (2). Thus, beyond day 7, it is assumed that the absorbed-dose rate can be predicted up to infinite time by extrapolation of the fitted function. If, for some reason, the retention of 177Lu-DOTATATE deviates from the predicted pattern, the absorbed doses delivered to different organs and tissue will differ from the calculated ones.
The 177Lu used at our center (IDB Holland bv) is produced by neutron activation of a 176Lu target by the 176Lu(n,γ)177Lu reaction. In a competing reaction, the long-lived isomer 177mLu is also produced. According to the radionuclide certificates of the 177Lu used, less than 0.05% of the total the activity comprised 177mLu at a reference time of production. 177mLu decays by 2 possible processes, either by β− decay to 177Hf or by isomeric transition to 177Lu, which then decays to 177Hf (3). 177Lu is thus obtained as a secondary build-up product from 177mLu. Because of the small amount, the absorbed dose contributions from 177mLu and secondary 177Lu are normally not considered. However, in view of the half-lives of 177mLu and 177Lu, which are 160.4 d and 6.647, respectively (3), and the mean energy emitted per decay, which is approximately 7 times higher for 177mLu than for 177Lu (Table 1), the importance of these contributions will depend on the long-term retention in the patient as well as on the radionuclide purity.
Summary of Decay Characteristics of 177Lu and 177mLu and Emitted Energy Per Decay
The aims of this work were to investigate the long-term retention of activity in patients who have received 177Lu-DOTATATE for PRRT and to assess the relative influence of later measurement time points on absorbed-dose values, compared with routinely used measurements. To achieve these goals, patient measurements were performed between 5 and 10 wk after treatment, using spectrometric detectors and γ-camera imaging. To convert the detected counting rates to activity and determine the absorbed dose, the presence of 177mLu and secondary 177Lu are considered.
MATERIALS AND METHODS
This study was approved by the regional ethics board, and patients gave their informed consent. Throughout this article italic characters denote scalar values, whereas bold italic characters denote image matrices. Where it is considered to follow from the context, the time dependency of variables has been omitted.
Decay of 177mLu and 177Lu
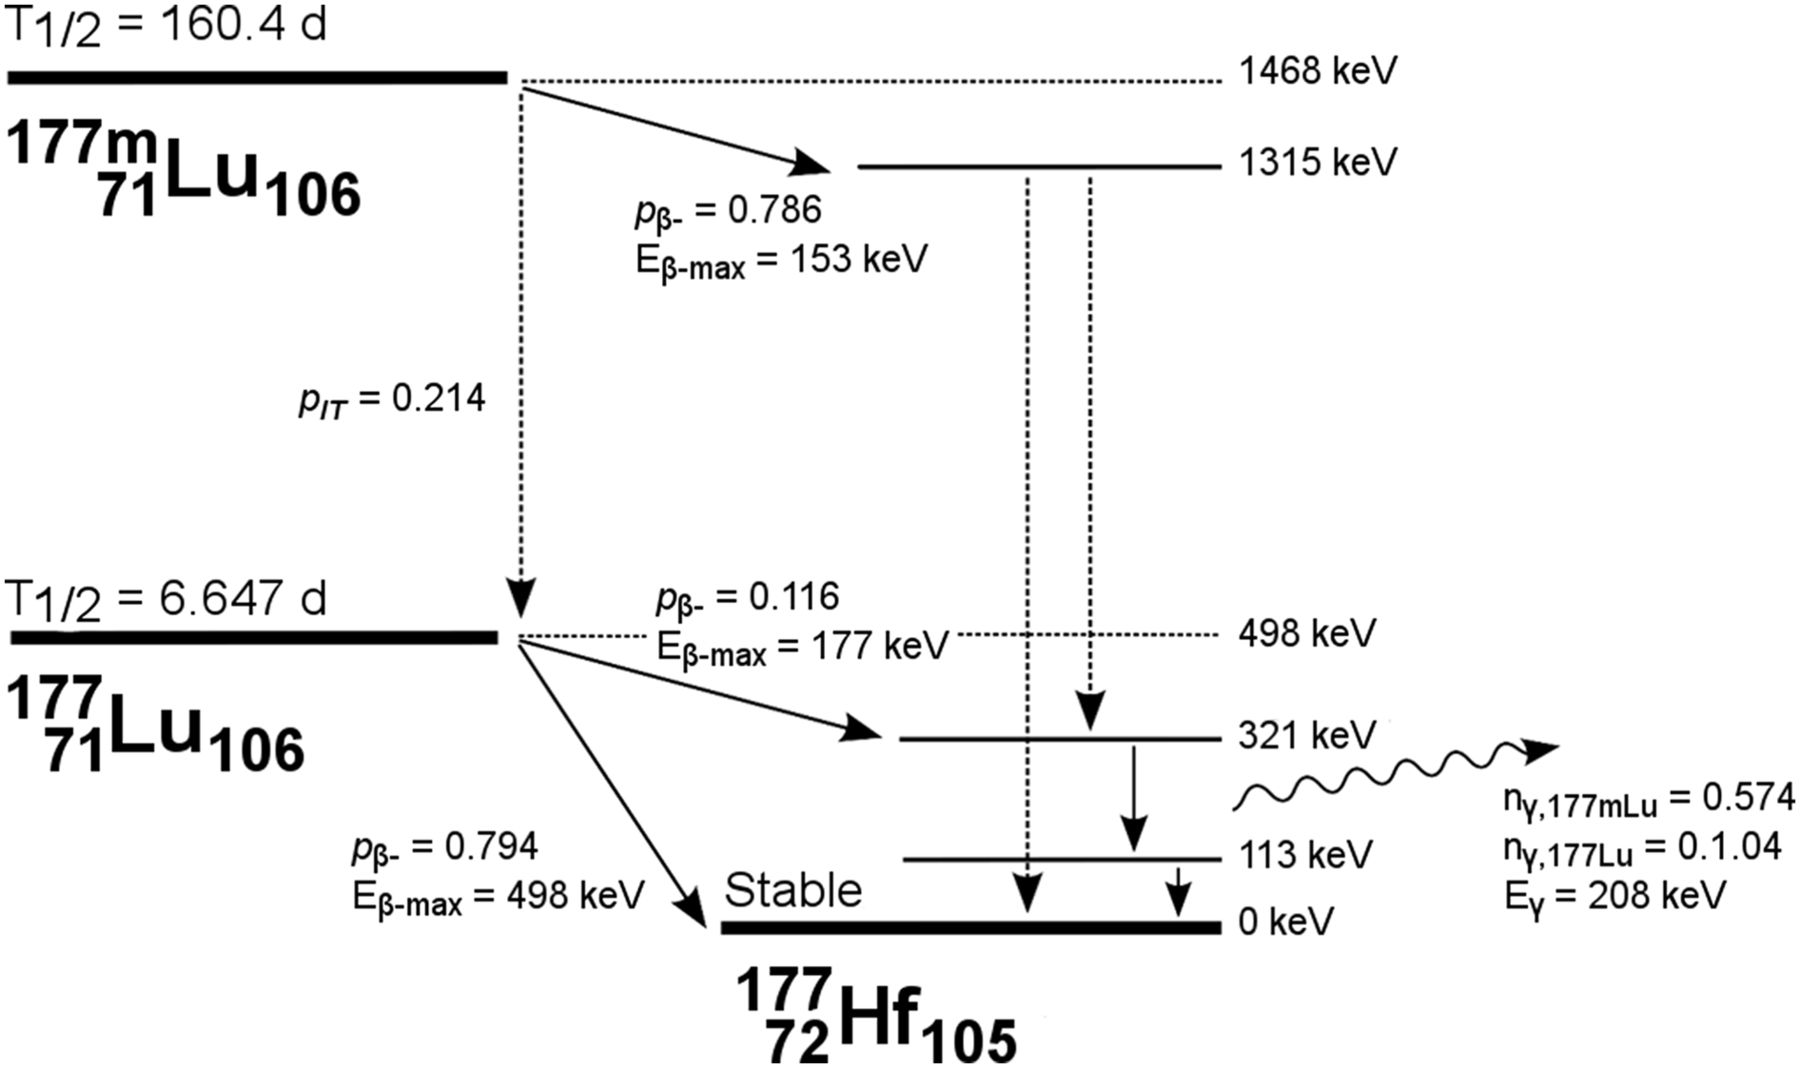
Figure 1 shows a simplified decay scheme for 177mLu and 177Lu, and Table 1 shows a summary of radionuclide data, as compiled from Kondev (3) and the Nudat2 database (4). 177mLu decays in 78.6% by β− decay, whereas in 21.4% it undergoes isomeric transition to 177Lu and then via β− decay to 177Hf. γ photons with an energy of 208 keV are emitted in 57.4% of the 177mLu decays and in 10.4% of the 177Lu decays. For 177mLu, there is a range of γ photons, of which those with the highest yield in the upper energy range of the β− branching were used in this work.

Schematic decay of 177mLu and 177Lu. γ photons (208 keV) with different yields are emitted in β− decay of both 177mLu and 177Lu. Note that  denotes probability of 208-keV photon emission with regards to 1 decay of either 177mLu or 177Lu. Dashed arrows symbolize multiple-energy-level transitions. Data were compiled from Kondev (3) and National Nuclear Database Center (4).
Radionuclide Separation for Activity Determination
For patient measurements performed several weeks after administration, the detected energy spectrum is a result of emissions from (i) 177Lu and (ii) 177mLu nuclei obtained directly from radionuclide production and from (iii) 177Lu nuclei resulting from the decay of 177mLu. Spectrum-based separation of these 3 components is complicated because the photon energies in the 177Lu decay are also present in the 177mLu decay. Moreover, in the patient measurements the higher-energy photons from 177mLu were often not identifiable, because of limited detector efficiency, poor counting statistics, and poorer energy resolution in the upper-energy range. For radionuclide separation, a method was therefore derived for which the total counting rate in the 208-keV peak was measured and then, based on assumed values of the radionuclide purity, the contributions of each of the source components i–iii were calculated.
A time of reference, tref, was defined as a time when the amounts of 177mLu and 177Lu were known and the amount of secondary 177Lu was zero. In principle, tref can be any time after the end of bombardment and is in this work defined as the reference time on the radionuclide certificate when the 177mLu/177Lu activity ratio is specified.
We let the parameter χ denote the radionuclide purity at tref, such that: Eq. 1where
  and
and  are the 177mLu and 177Lu activities at tref, respectively.
At a time t after tref, the total rate of 208-keV photon emission, R, is obtained as: Eq. 2where
  ,
,  , and
, and  are the respective rates of 208-keV photon emission from source components i–iii, as described by:
 Eq. 3
Eq. 3 Eq. 4
Eq. 4 Eq. 5Here
  ,
,  , and
, and  are activities of source components i–iii, respectively;
  and
and  are probabilities of 208-keV photon emission of 10.4% and 57.4%, respectively;
  and
and  are decay constants; and pIT is the probability of 21.4% that 177mLu undergoes isometric transition. Equation 2 can be written as:
 Eq. 6where
  , and
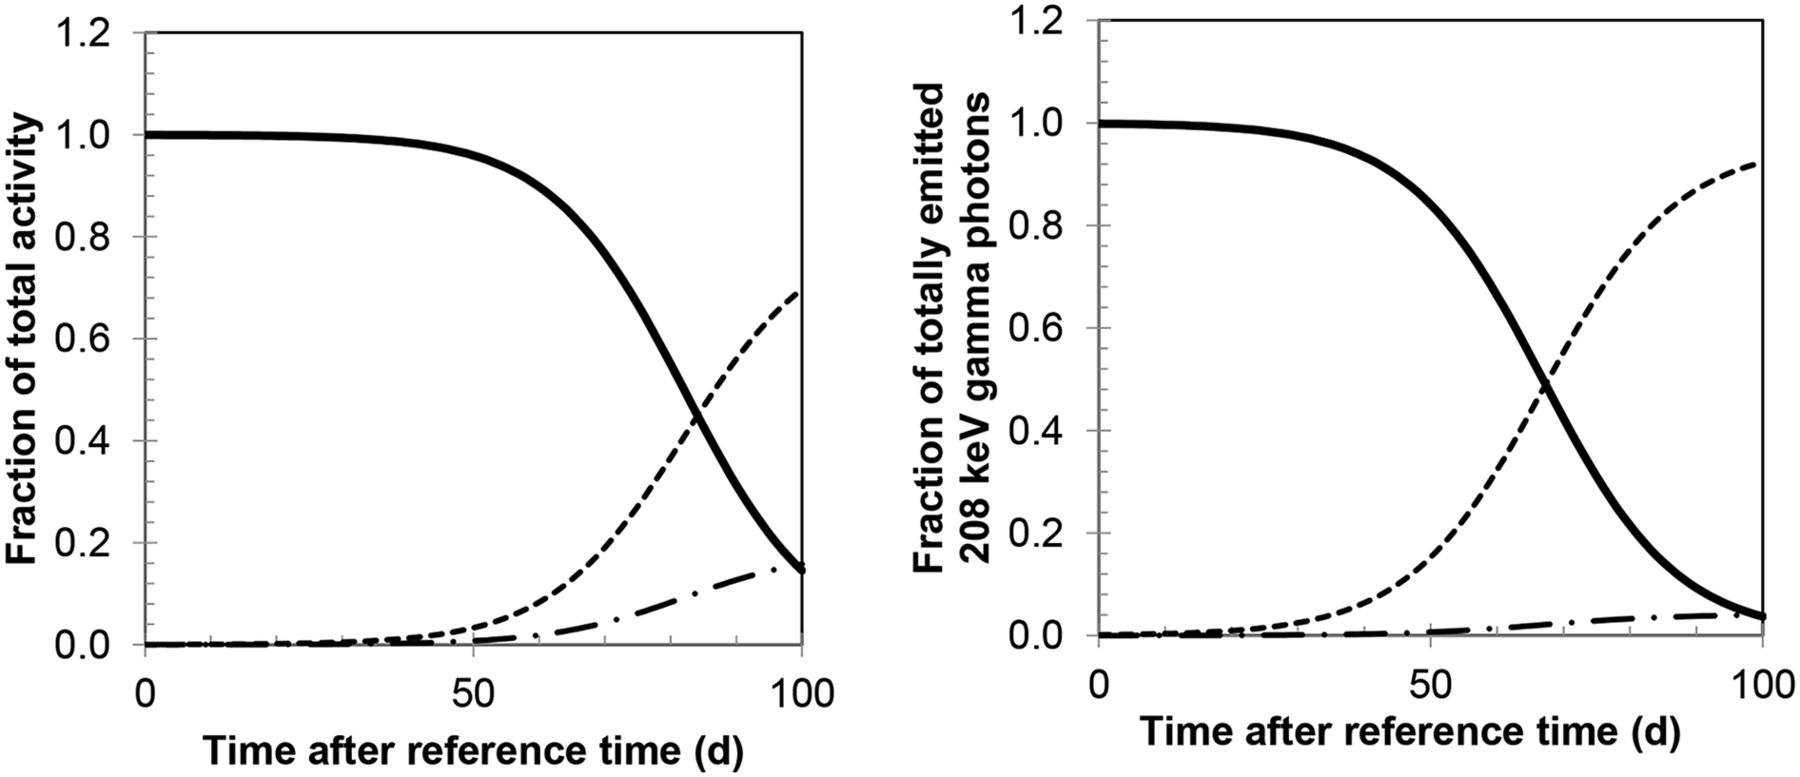
, and  are the fractional contributions from components i–iii to R, respectively, for which expressions are derived in the Appendix. Figure 2 shows the fractions of the total activity and the fractions
  , and
, and  for a χ value of 0.9995.

(Left) Fractions of total activity, which is primary 177Lu (solid line), 177mLu (dashed), and secondary 177Lu (dash-dotted), for χ value of 0.9995. (Right) Fractions of total amount of emitted 208-keV γ photons, which are due to different components—that is,  , and
, and  in Equations 6–9.
The activities are given by: Eq. 7
Eq. 7 Eq. 8
Eq. 8 Eq. 9From these equations and a given value of χ, the activity of each component can be calculated from a measurement of R.
Estimation of Radionuclide Purity
Samples of 177Lu/177mLu were measured using a HPGe p-type detector (Canberra Industries, Inc.), with a relative efficiency of 45%. The detector was mounted in a lead cave located in a low-background environment and connected to the multichannel analyzer software APEX (Canberra Industries, Inc.). Three samples were prepared and allowed to decay, and measurements were performed at 3 time points in a precalibrated geometry. The activity of 177mLu was determined from γ peaks in the upper energy range emitted as part of the β− decay (Table 1). The counting-rate contributions from 177mLu and secondary 177Lu to the 113- and 208-keV peaks were subtracted, and the activity of primary produced 177Lu was calculated. Obtained activities were extrapolated to the reference time. From the mean values χ was calculated following Equation 1.
Patient Measurements
Seven patients were included in this substudy of the clinical trial. A combination of instruments was used: planar γ-camera imaging at approximately 1, 24, 96, and 168 h after injection, as part of the dosimetry protocol; detector measurements for determination of whole-body activity between 33 and 61 d; and γ-camera imaging at between 33 and 70 d (Table 2). The administered activities were between 7,145 and 7,570 MBq, and the time between tref to the administration was between 0.97 and 2.78 d for the different patients.
Summary of Patient Measurements Using NaI(Tl) and HPGe Detectors and γ-Camera Imaging as Part of Routine Dosimetry Protocol and at Later Times
Detector Measurements
A 74 × 74 mm NaI(TI) scintillation detector was used, collimated by lead, and connected to the Maestro multichannel analyzer software (ORTEC). For a few patients, we had access to a mobile, electronically cooled 50 × 30 mm HPGe p-type counting detector system (Detective DX; ORTEC), equipped with a tungsten collimator. Before each measurement, energy calibration and overnight background measurements were performed and the background counting rate subtracted before subsequent peak analysis.
The intrinsic photopeak efficiencies and energy resolutions at 208 keV were determined by measurement of a small volume of 177Lu located at 2.8 m from the detector. The 177Lu was in this case obtained from National Physics Laboratory, with activity stated with 1% uncertainty (1 SD). The measured energy resolution was 9.5% and 0.7%, and energy windows of approximately 20% and 1.8% were used for the NaI(Tl) and HPGe detector systems, respectively. The intrinsic photopeak efficiencies,  , were determined by assumption of a point source geometry (5). Calibration measurements were made at a time when the amount of 177mLu was still negligible.
Patient measurements were performed in posterior and anterior views, each of approximately 10 min, with the detector placed in chest height. The patient–detector distance was between 1 and 2.5 m, ensuring that the dead time was below 5% for the earliest measurements and to maximize the counting rate for the latest occasions. The rate of photon emission from total body,  , was determined by applying the geometric mean (6,7) according to
 Eq. 10where
  and
and  were patient–detector distances;
  and
and  were net counting rates, in anterior and posterior views, respectively; S was the front area of the detector; T was the patient thickness over the abdomen as measured in separate CT images; and μ was the linear attenuation coefficient for 208-keV photons (8). From
  the activities of source components i–iii were obtained using Equations 7–9, giving values of the total-body activities,
  , and
, and  .
.
γ-Camera Imaging
Anterior–posterior whole-body images were acquired using an energy window of 20% centered at 208 keV and a matrix size of 256 × 1,024, with pixel size 2.21 × 2.21 mm2. For the image at 0.5 h, an acquisition scan speed of 20 cm/min was used, whereas acquisitions at 24, 96, and 168 h after injection used 10 cm/min. For images acquired between 5 and 10 wk, a scan speed of 5 cm/min was used. The first occasion such an image was acquired, the regular scan length of 200 cm was used. To shorten the acquisition time, the scan length was further shortened to 120 cm, excluding the lower parts of the legs. Background scans were acquired using the same protocol to enable background subtraction for the low-counting-rate acquisitions.
Activity quantification was performed using the conjugate-view method (6,7). Because explicit attenuation and scatter corrections were included, the system sensitivity measured in air was used for conversion from counting rate to activity. This system sensitivity was measured using a known activity of 177Lu in a Petri dish and scanning by each of the protocols used for patients, at a time when the amount of 177mLu was still negligible. Normally, system sensitivity is defined as the counting rate,  , divided by the calibration activity,
  , whereas in this work the sensitivity,
  , was defined as the counting rate divided by the 208-keV photon emission rate, that is,
  .
.
For images acquired during the first week after injection, collected as part of the routine dosimetry protocol, quantification was performed according to our previously described, pixel-based method (9), which was then reformulated according to: Eq. 11where R was the image of the 208-keV photon emission rate with
  denoting columns and rows in image matrices, and
  and
and  were the anterior and posterior counting-rate images. The function Sc denoted scatter correction using deconvolution by scatter point-spread functions (10). The amplitude of these functions was normalized such that the area under the curve equaled the total-to-primary ratio, as determined from Monte Carlo simulation (11). The attenuation correction map, AC, was obtained from a whole-body CT scout image of the patient (9). In the obtained image R, the sum of the pixel values over total body gave
  . For quantification of tissue activities, the image R was further processed by drawing regions of interest (ROIs), correcting for background using separate background ROIs and estimation of the background and tissue thicknesses, and applying a source-thickness correction, giving
  (12).
(12).
This method was used for images acquired during the first week when the signal-to-noise ratio was still high. For the low-count images acquired after more than 1 mo after injection, the pixel-based method was not applicable because of numerous pixels with a value of zero, which, when performing pixel-based background correction, would have yielded negative values. A modified, ROI-based, method was therefore used, in which ROIs were applied in the acquired counting-rate images and in background scans, and the geometric mean was applied to the background-subtracted ROI counting rates. An attenuation-correction factor was applied, determined by applying ROIs to the map AC and calculating the mean value. Scatter correction was formulated as a multiplicative factor, determined as the inverse of the total-to-primary ratio. As the pixel- and ROI-based schemes represented slightly different methods, their consistency was checked by applying both methods to a selection of images from days 4 and 7, with deviations of less than 5% obtained for tissue ROIs. However for total body, the ROI-based method yielded underestimated values, because it did not consider heterogeneous attenuation. Also, the scan length truncation, implemented to shorten the acquisition time, would possibly give a further underestimation of whole-body activity. For quantification of  from the low-count images, a combination of the pixel-based and ROI-based methods was therefore used, by determining the ratio of
  values obtained from the pixel-based versus the ROI-based methods when applied to images acquired on day 7. For the late images,
  was then obtained by multiplying the ROI-based value with this ratio.
Having determined regional and total-body values,  and
and  , the activities of the source components i–iii were determined using Equations 7–9, thus giving
  and
and  for total-body and
  and
and  in ROIs.
Analysis of Time–Activity Data and Absorbed-Dose Calculation
In images acquired at more than 1 mo after injection, extrahepatic tumors and liver could be clearly visualized, but individual tumors within the liver could not be distinguished from surrounding tissue. Regions for which dosimetric analysis was feasible were thus the total body, tumor, and tumor/liver.
Two different dosimetry methods were used where method 1 represented the routinely used procedure, assuming that only 177Lu was present. The time–activity curve was composed of a monoexponential function fitted to values from days 1, 4, and 7 and a linear function for day 0 and 1 values. For patients 2, 4, 5, and 7, the uncertainty in the total-body activity values was analyzed, with the purpose of comparing the measured activity in the late images to the activity obtained by extrapolation of the fitted time–activity curve from the first week (supplemental data [available at http://jnm.snmjournals.org]). Method 2 represented the extended method, which, in addition to the imaging-based values from days 0–7, also included values derived from delayed measurements, both from imaging and detectors. Here the 177mLu and the secondary 177Lu were considered both in the determination of the activities and in the absorbed dose calculation. Time–activity curves were fitted to the values  and
and  and were composed of a biexponential function for values from day 1 and onward and a linear function determined from day 0 and 1 values. Time–activity curves for 177mLu and secondary 177Lu were calculated from the fitted curves and the ratios
  (Eqs. 8 and 7) and
  (Eqs. 9 and 7), for components ii and iii, respectively.
The absorbed dose to total body was calculated using S values for 177Lu and 177mLu (mGy/MBq h), as retrieved from Olinda (Vanderbilt University), for adult female and male phantoms (13). S values were scaled to the patient’s mass, using powers of 1 for electrons and 2/3 for photon S values (14). For tumor and tumor/liver, S values were derived from the unit density sphere model (13), which was interpolated to obtain values for a sphere mass equivalent to the tumor regions, as determined from separate SPECT/CT studies.
The absorbed doses  and
and  , for methods 1 and 2, respectively, were calculated as:
 Eq. 12where
  was the cumulated activity obtained using method 1, and
  , and
, and  were cumulated activities of each of the components obtained from method 2, as calculated by analytic integration.
RESULTS
In the measurement of the radionuclide purity, the activity of 177mLu in relation to the total activity of 177mLu and 177Lu at the reference time was 0.022 ± 0.00009% (mean ± SD), giving an χ value of 0.99978. This value was thus in line with the statement from the manufacturer of 177Lu, which following Equation 1 gave an χ value of 0.9995. In further activity quantification of components i–iii, the fractional amount of 177mLu was assumed to be 0.025% and 0.05%, corresponding to χ values of 0.99975 and 0.9995, respectively. The times when the activity of initially produced 177Lu was equal to the activity of 177mLu and secondary 177Lu were 75 and 82 d for χ values of 0.9995 and 0.99975, respectively (Fig. 2). The times when half of the emitted 208-keV photons originated from initially produced 177Lu were 60 and 67 d.
For the detectors used for patient measurements, the intrinsic photopeak efficiencies obtained were 65.0% and 41.2%, for the NaI(Tl) and HPGe systems, respectively. In the spectra from patient measurements, γ peaks above 208 keV that are unique for 177mLu could generally not be detected, mainly because of noise. However, for patient 4 an additional HPGe measurement was made at a short patient–detector distance. The spectrum obtained in this geometry is shown in Figure 3. Although 177mLu peaks were identifiable in this geometry, these measurements were not useful for activity quantification because of their small net area and the increasing violation of the point-source geometry approximation at such short distance.
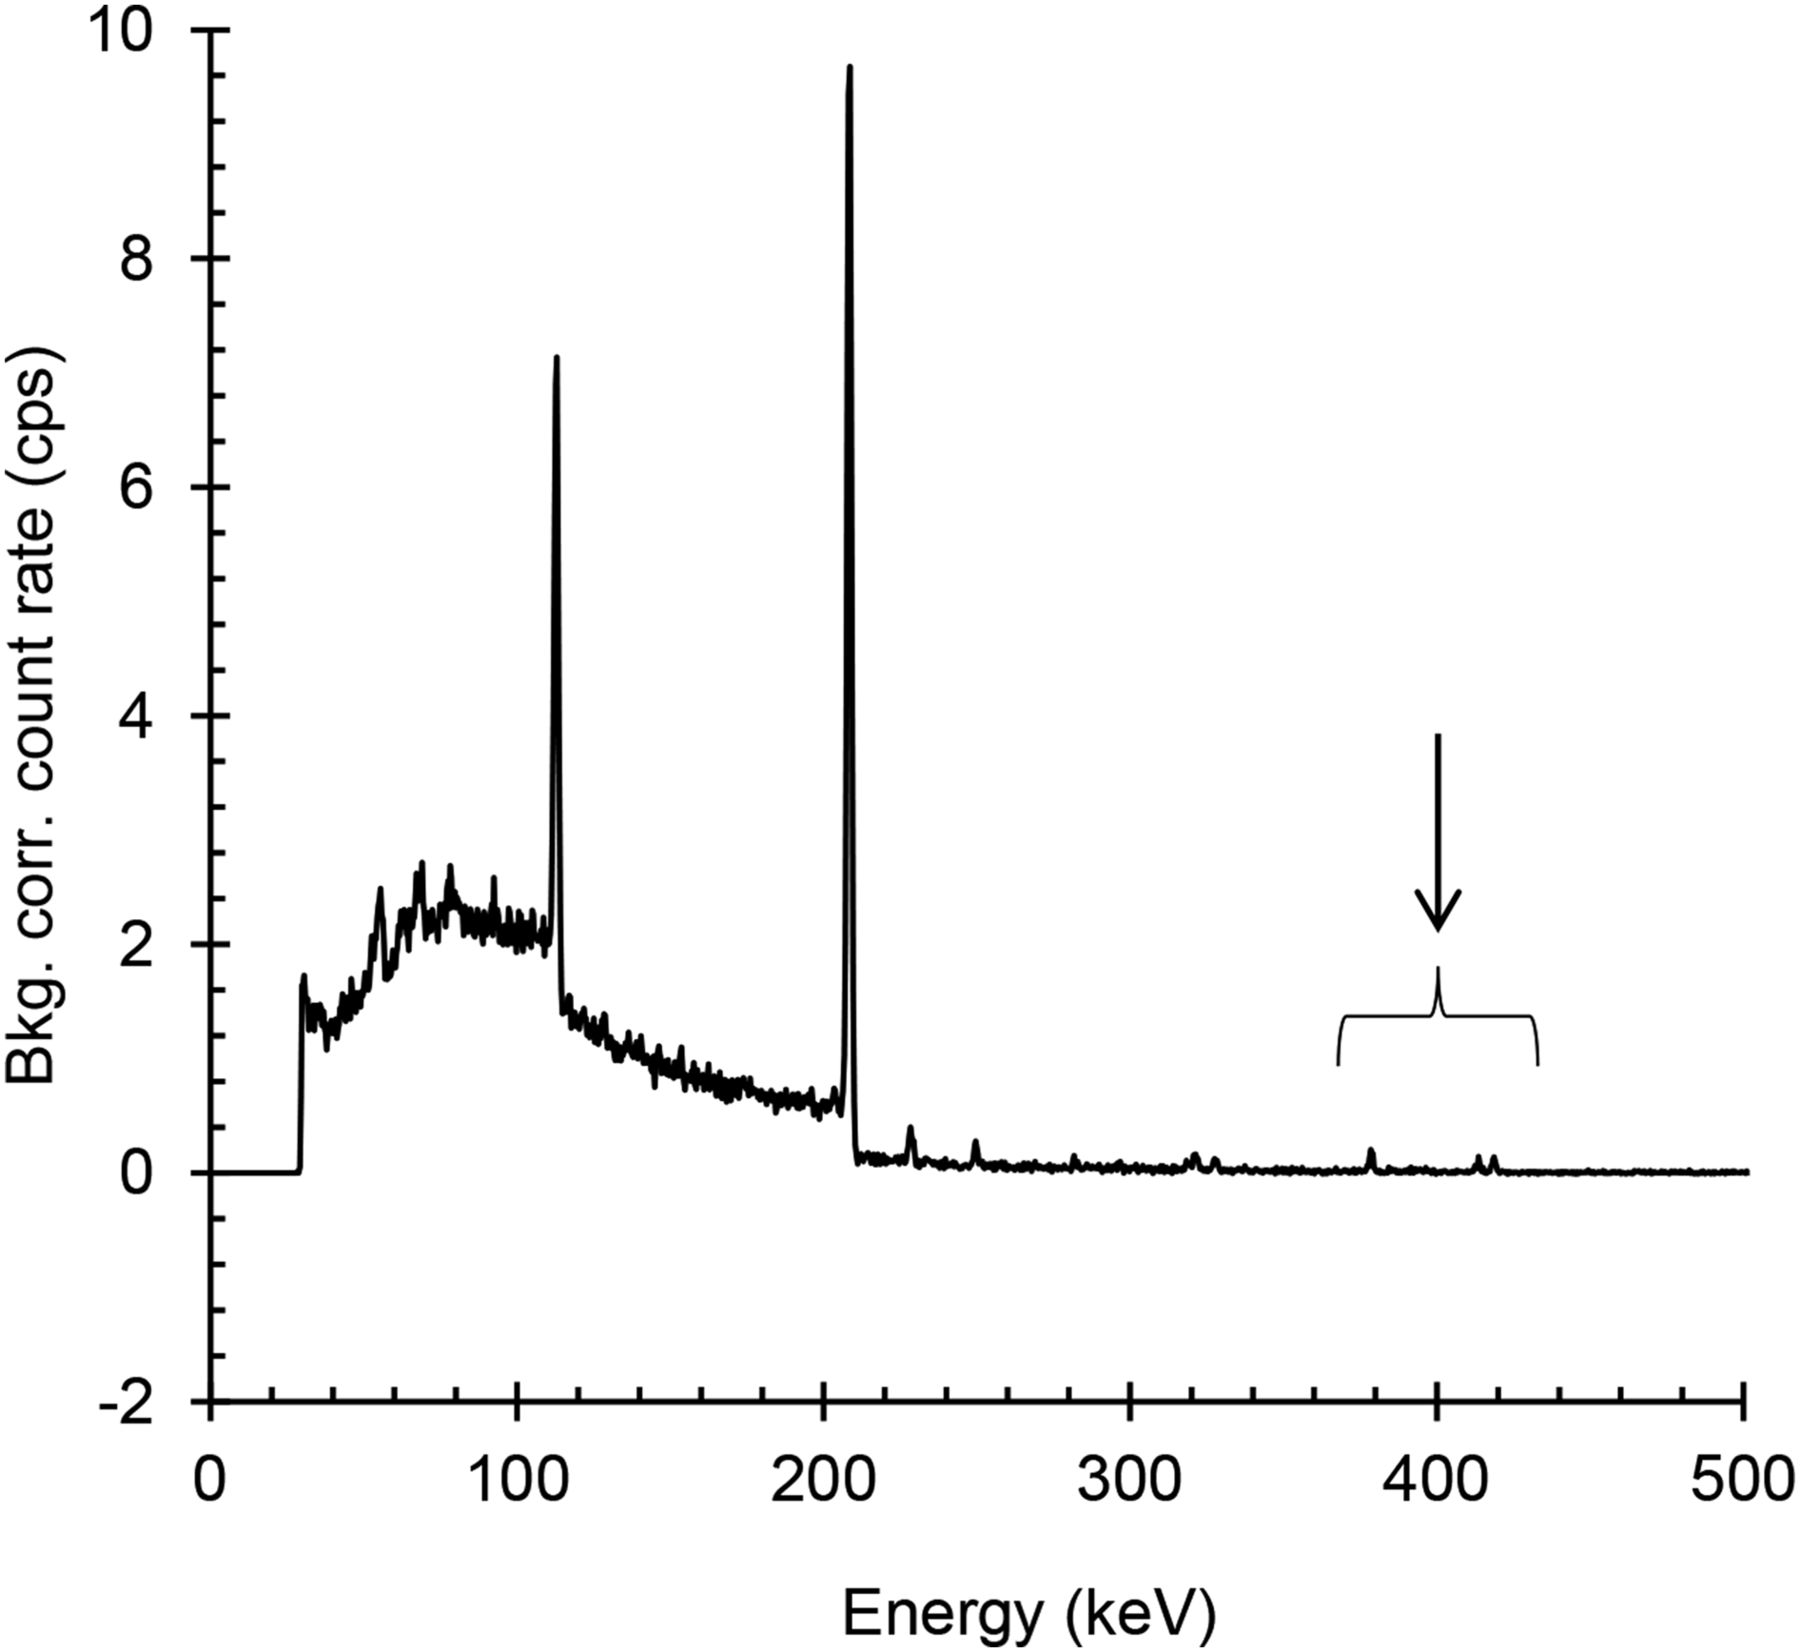
Energy spectrum obtained from measurement by HPGe-detector system with detector placed close to patient 4, at 35 d after administration. Arrow shows peaks, which are part of the 177mLu decay and not 177Lu. Bkg corr = background-corrected.
For patients 1–6, measurements on day 7 were made using both detector and γ-camera imaging. The deviations in the total-body activities, calculated as (NaI(Tl) detector–based values – imaging-based values)/imaging-based values, were obtained to 3%, 3%, −7%, 0.2%, −8%, and −1%, for patients 1, 2, 3, 4, 5, and 6, respectively. The corresponding deviations obtained for the HPGe detector system were higher with −20% and −14% obtained for patients 5 and 6, respectively.
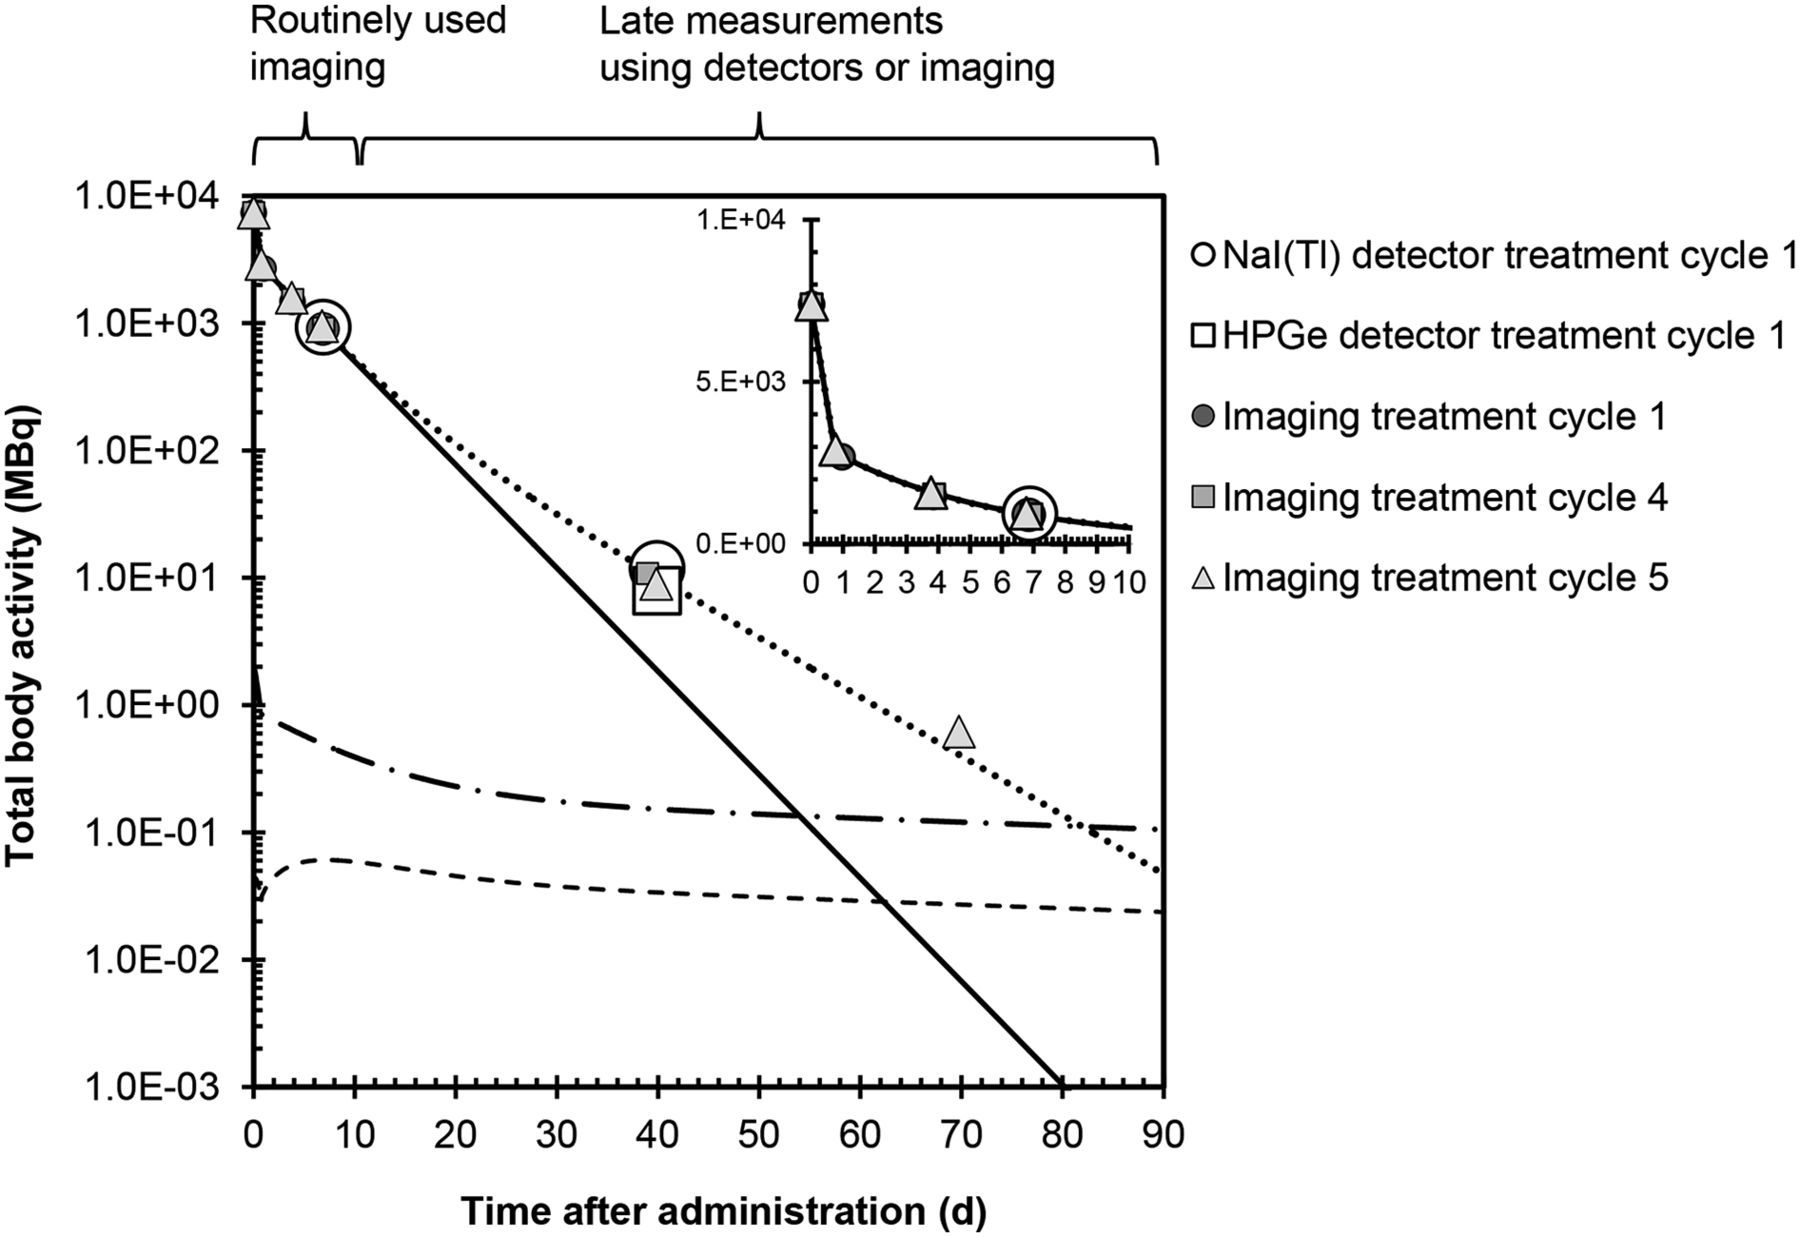
Figure 4 shows the total-body activity for patient 2, including routinely used and additional data from imaging and detector measurements. Results showed that the activity tail was underestimated when only data from routine dosimetry were included. Included are also time–activity curves of 177mLu and secondary 177Lu.

Activity in total body, renormalized to nominal administered activity of 7,400 MBq, for patient 2. Filled symbols are activity values from imaging. Open symbols are values from detector measurements. Solid line shows fitted time–activity curve when only routinely used data points are used for curve fitting. Dashed lines are time–activity curves when values from late measurement are considered, where dotted line is primary produced 177Lu, dash-dotted is 177mLu, and dashed is secondary 177Lu. χ value of 0.99975 is assumed. Inset shows total-body activity during first 10 d (linear scale).
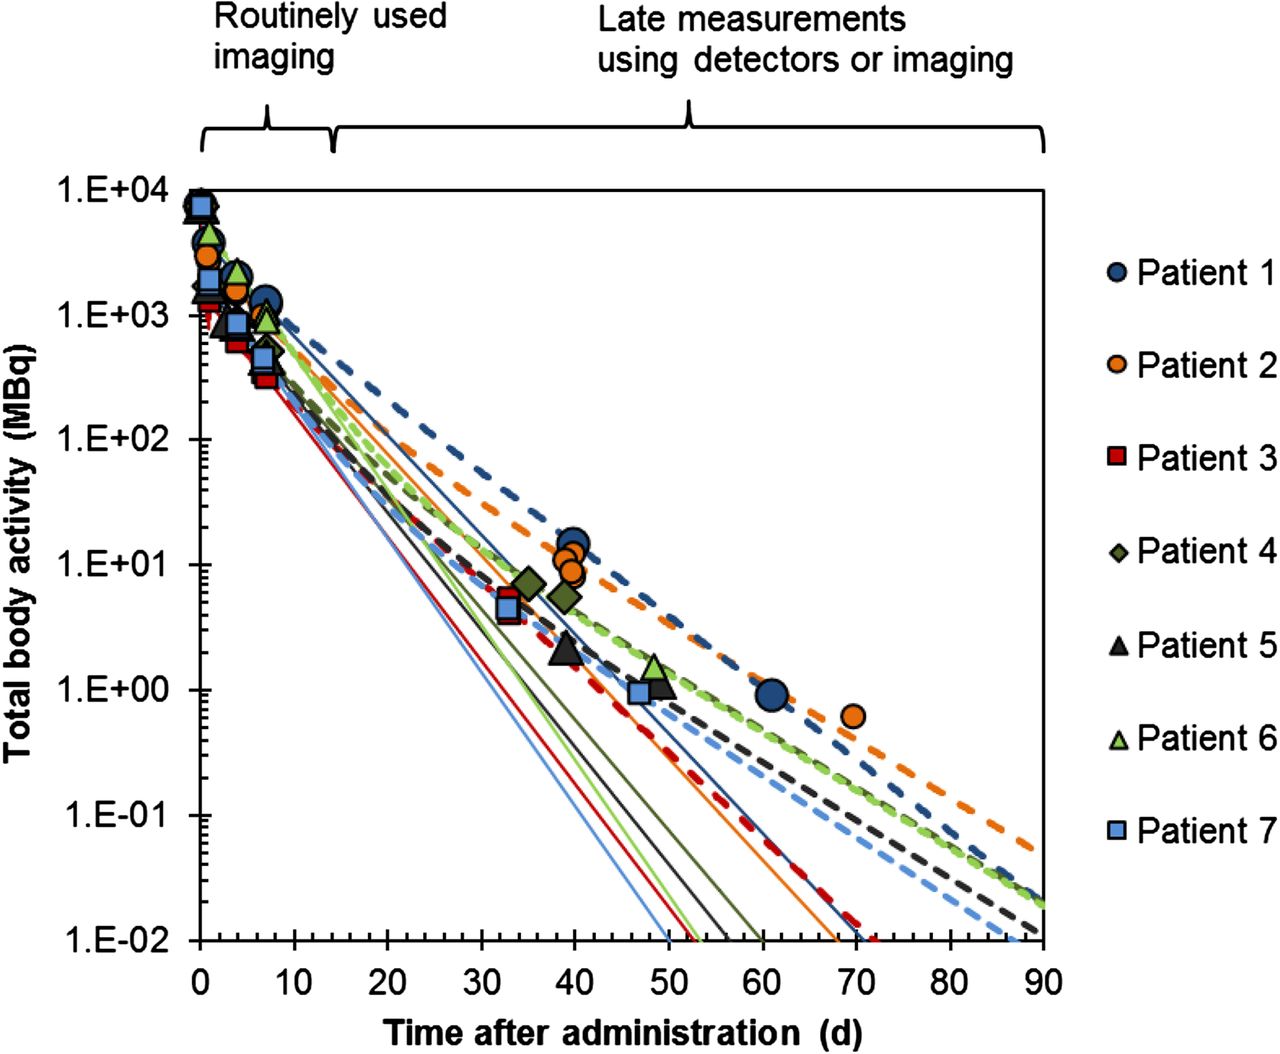
Figure 5 shows the activity of primary 177Lu in the total body for all patients, from the 2 methods of estimating the time–activity curve. For all patients, there was a higher retention of activity than predicted from curve-fitting from the first week. The measured activity (in MBq) in the late images was 9.0 ± 0.5 (1 SD) for patient 2 at 40 d and 0.6 ± 0.1 at 70 d, 5.6 ± 0.3 for patient 4 at 39 d, 2.2 ± 0.1 for patient 5 at 39 d, and 4.7 ± 0.3 for patient 7 at 33 d and 0.9 ± 0.1 at 47 d. The corresponding values obtained from curve-fitting were 1.71 ± 0.09, 0.0058 ± 0.0003, 0.57 ± 0.03, 0.31 ± 0.02, 0.78 ± 0.04, and 0.018 ± 0.001.

Activity of primary produced 177Lu in total body for nominal administered activity of 7,400 MBq, for all patients. Markers show data from imaging and detector measurements. Solid lines are time–activity curves when only routinely used data points are used for curve fitting. Dashed lines are time–activity curves obtained when values from late measurement are considered. Results for individual patients are shown in same color of markers and lines. χ value of 0.99975 is assumed.
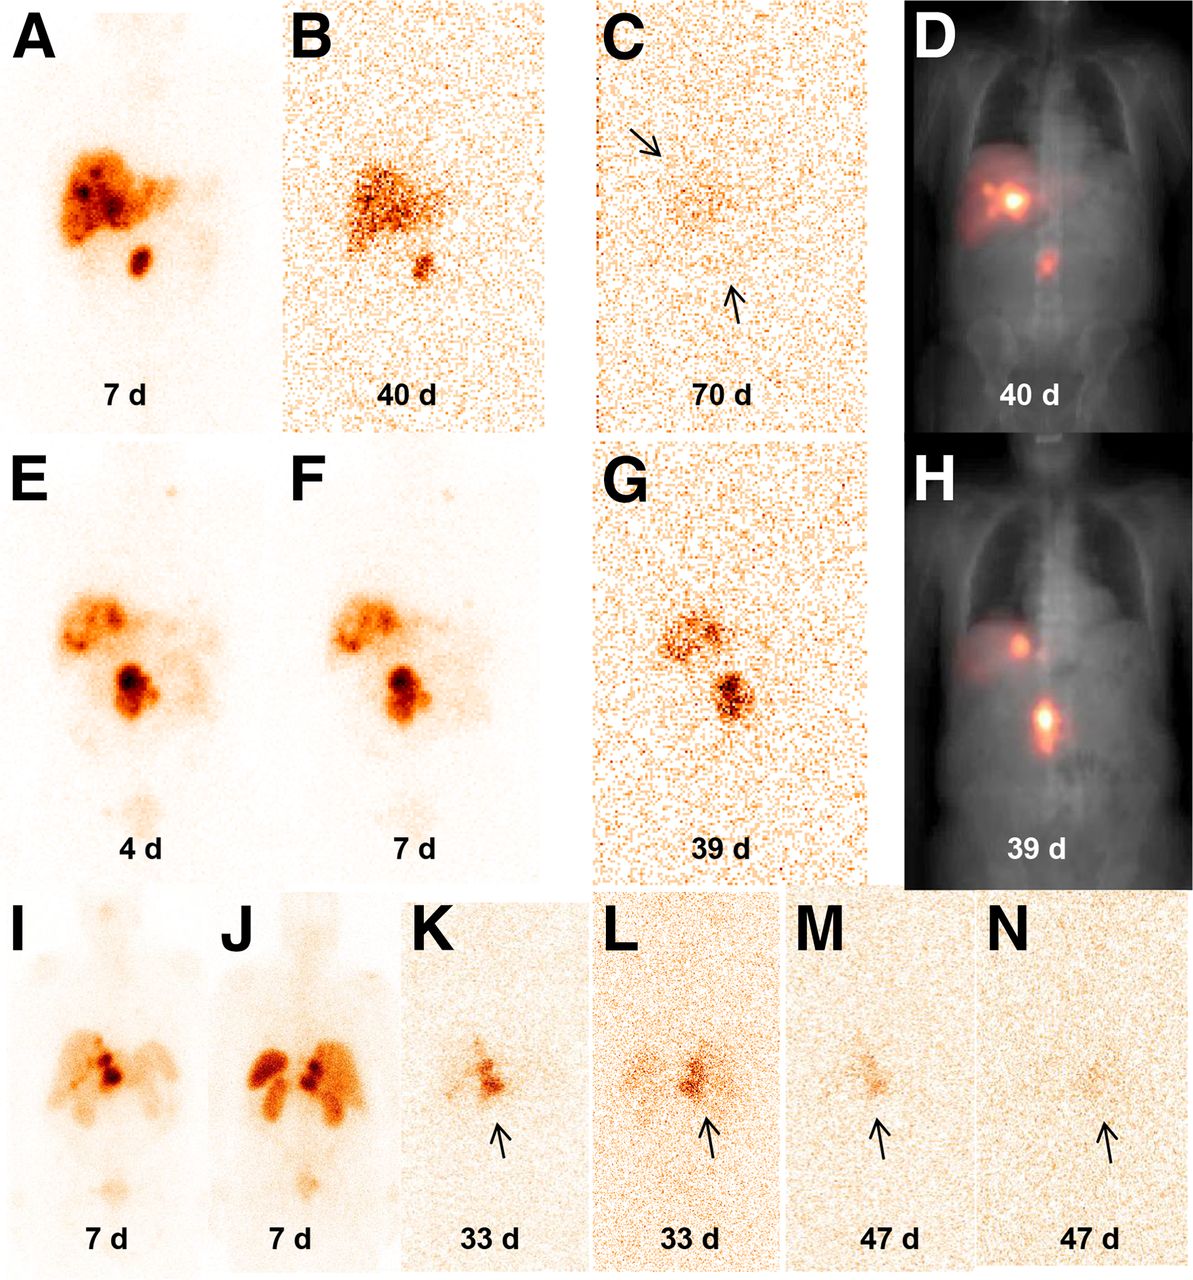
Figure 6 shows images for patients 2, 4, and 7. Patient 2 showed accumulation in tumor and liver, which was clearly detectable at 40 d while at 70 d it approached the background counting rate. Patient 4 showed a similar accumulation in tumor and liver, which was clearly detectable at 39 d. Also in patient 7, main accumulation was in the tumor. Notably, however, there were also signs of uptake in the spleen and kidneys in the image acquired 33 d after administration. The activity estimates were 0.5 MBq for kidneys and spleen, respectively, which was considerably higher than the values extrapolated from measurements during the first week. However, there were too few data points to allow for dosimetric analyses.

(A–D) Patient 2, anterior images acquired during cycle 5 at 7 d (A), 40 d (B), and 70 d (C). D is image at 40 d after attenuation and scatter corrections overlaid on spatially coregistered x-ray scout image, for localization. (E–H) Patient 4, anterior images acquired during cycle 7 at 4 d (E), 7 d (F), and 39 d (G). H is 39-d image and corrections as in D. (I–N) Patient 7; I, K, and M are anterior and J, L, and N are posterior images, from day 7 in cycle 3 (I and J), day 33 in cycle 4 (K and L), and day 47 in cycle 4 (M and N). Arrows indicate tumor or tumor-infiltrated liver.
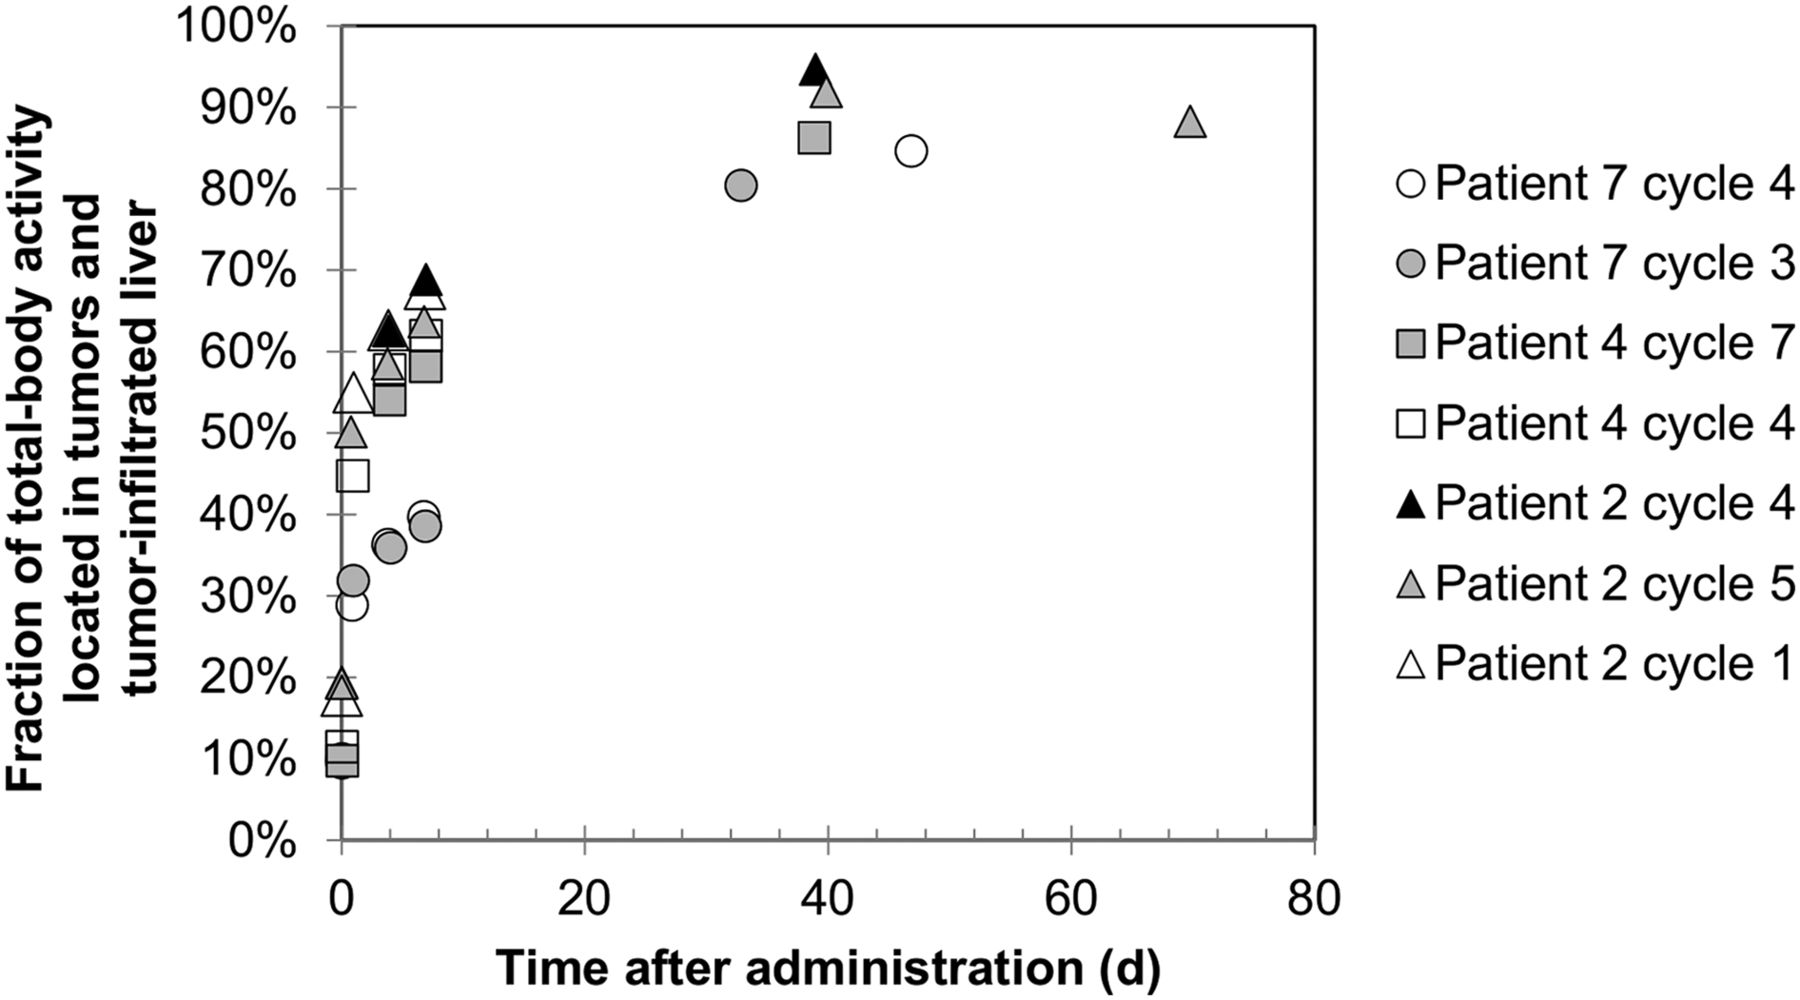
Figure 7 shows the fraction of the total-body activity, which is localized in the tumor and liver for patients 2, 4, and 7. Patient 5 was also imaged at day 39 but had extensive spread of metastases, making this kind of analysis infeasible. The proportion of the total-body activity that was retained in tumor or tumor/liver increased over time with a pattern that was consistent with exponential washout from other tissues in the body. Patient 2 had the highest fraction of activity localized in tumor at day 7 and also had a high total-body activity at day 40 in Figure 5. For patient 7, the relative activity in tumor at day 7 was comparably low and also had a low total-body activity at days 33–47.

Fraction of total-body activity, which is localized in tumor or tumor-infiltrated liver for patients 2, 4, and 7, as function of days after administration.
Table 3 shows absorbed doses obtained for total body using the 2 analysis methods. When including data from late time points, taking the 177mLu and secondary 177Lu into account, absorbed doses were between 2% and 9% (mean, 5%) higher than values obtained from data acquired during the first week only and were approximately independent of the value of χ. The contributions from 177mLu and secondary 177Lu were approximately 10−2 to 10−4 of the absorbed dose from primary 177Lu. The increased absorbed dose obtained using method 2 was due to a longer retention of primary 177Lu as compared with that extrapolated from time–activity data obtained during the first week.
Total-Body Absorbed Doses for Nominal Administered Activity of 7,400 MBq, Obtained by Methods 1 and 2, for Which Latter Also Includes Contribution from 177mLu and Secondary 177Lu
The ratios of absorbed doses using methods 1 and 2 were also estimated for tumors and liver. To make use of patient studies in which late imaging was not performed and only detector measurements were available, it was approximated that the activity in the total body at late time points was localized solely in tumor or liver/tumor. For patients who had more than 1 tumor location, the relative amount in each site was estimated from the image acquired closest in time (day 7). When method 2 was used, the absorbed doses were between 3% and 13% higher than the absorbed dose derived from method 1, with a mean ratio of 1.06 ± 0.04 (1 SD). These results were nearly identical for the 2 values of χ.
DISCUSSION
Our normally used procedure for dosimetry in 177Lu-DOTATATE PRRT involves patient measurements during the first 7 d after injection. Thereafter, the activity in different organs and tissue is assumed to follow a fitted curve. This work aimed at investigating the validity of this assumption by performing patient measurements at more than 1 wk after injection. A further aim was to determine to what extent the inclusion of these measurements affected the absorbed dose estimates. To make dosimetry calculations from these late measurements, the small amount of 177mLu and secondary 177Lu needed to be considered. Even though the initial amount was small, at a certain time point after administration the activity of 177mLu started to dominate (Fig. 2). Considering that the treatments are repeated at intervals of approximately 2 mo, this 177mLu and secondary 177Lu could theoretically remain in subsequent treatments and possibly cause an increase in the accumulated absorbed dose over time.
According to the manufacturer, the amount of 177mLu was less than 0.05% of the total the activity, giving an χ value of 0.9995. In Zimmerman et al. (15), the amount of 177mLu was estimated to approximately 0.03% of the 177Lu at a nominal reference time, thus giving an χ value of 0.9997. In the present work, χ was measured to 0.9997. χ values of 0.9995 and 0.99975 were thus assumed in further analyses, representative of 1 worst case and 1 more likely scenario.
Patient measurements were performed in conjunction to appointments scheduled for follow-up of a previous treatment cycle, at around 1.5 mo after injection, or just before a new cycle, at approximately 2.5 mo. With a busy clinical schedule, this meant that measurements were limited to a total of approximately 20 min—that is, 10 min per anterior and posterior measurement. In the initial stage, the objective was to examine whether there was any detectable activity at a late time point. The first time a measurement was made at 40 d after injection, it was intriguing to see that the peaks at 113 and 208 keV could be detected and even more so when repeating this measurement at 61 d. In the measured spectra the characteristic peaks for 177mLu with energy above 208 keV could not be detected, not even with the HPGe system. However, the spectra were relatively noisy in this range because of the large patient–detector distance and limited acquisition time, and it could therefore not be excluded that 177mLu was present. For this reason, 1 measurement was performed with the HPGe detector placed close to 1 patient, showing small but detectable peaks of 177mLu (Fig. 3). After measuring several patients for whom in all cases 113 and 208 keV peaks were detected, it could be concluded that the total-body retention was higher than predicted from the curve fitted to data obtained within the first week (Figs. 4 and 5). However, the amount of 177mLu could not be quantified from measured spectra but had to be calculated.
An important aspect to elucidate was where in the body this activity was retained. One possible scenario was that free 177Lu (or 177mLu) ions, either due to in vivo instability or to secondary 177Lu ions, were released into the circulation with uptake in the skeleton (16) and irradiation of bone marrow as a possible consequence. Another unfavorable scenario would be that 177Lu/177mLu-DOTATATE accumulated in normal organs such as kidneys and spleen. It was therefore decided to perform γ-camera measurements, with the collimator in place. These images mainly showed accumulation in tumors and tumor-infiltrated liver (Fig. 6). However, in 1 patient scanned at 1 mo after injection there were signs of uptake in kidneys and spleen. This patient has not suffered from any renal or hematologic toxicity during or after his 5 cycles of PPRT. In the 4 patients imaged, there was no sign of activity in the skeleton. However, skeletal uptake could not be excluded because this would likely not be visualized given the low signal-to-noise ratio. By comparison of results in Figures 5 and 7, it was seen that a prolonged activity retention in the total body corresponded to a higher relative amount of activity in tumor on day 7, suggesting that it was mainly tumor that retained activity. For future studies, it would be of interest to perform imaging at time points between day 7 and 1 mo, as these would possibly resolve the activity retention in normal organs and enrich data on tumor accumulation (Fig. 7).
In this work several independent methods for activity quantification were used, with 2 detector systems and γ-camera imaging. For the occasions when both techniques were used, the agreement between obtained total-body activities was good. In the supplemental data, we analyzed the accuracy of the image-based method. For 104 177Lu patient images acquired close to the time of administration, the total-body activity was within 10% (2 SD) from the administered activity. Moreover, uncertainty analysis showed that the differences obtained between total-body activity values obtained by extrapolation and by late measurement were unlikely to be explained by measurement uncertainties.
Analysis of time–activity values was performed with respect to the difference in absorbed doses obtained when activity data from late measurements were included. Evidently, the long-term tail was not properly accounted for using method 1, and method 2 yielded absorbed dose values for total body which were on average 5% higher. Although planar imaging was not optimal for tumor dosimetry, in view of the project aim of investigating the relative contribution from the long-term retention, it was considered justifiable. For tumor absorbed doses the increase when including late measurements was on average 6%—that is, approximately the same as for total body. The contributions to the absorbed dose from 177mLu and secondary 177Lu were negligible, independently of whether χ values of 0.9995 or 0.99975 were assumed.
CONCLUSION
This work shows that there is a tail in the whole-body time–activity curve, mainly governed by the tumor burden and associated uptake, which is not completely captured by imaging during the first week after administration. Presented results are useful for optimization of future dosimetry protocols, especially for tumor dosimetry in which a later imaging time point may be warranted. Images from between 1 and 2 mo after administration mainly showed uptake in tumor tissue, although in 1 patient, acquired on day 33, activity retention in the kidneys and spleen was also seen. The increase in absorbed dose to total body and tumors when performing calculation based on late time point data was on average 5%–6% as compared with using only data acquired during the first week after injection. The contributions to the absorbed dose from 177mLu and secondary 177Lu were negligible.
Appendix
According to Equation 6,  is defined as:
This quotient can be rewritten using Equations 2–5, according to: Eq. 1A
Similarly for  we get:
 Eq. 2A
and  is determined to:
 Eq. 3A
DISCLOSURE
The costs of publication of this article were defrayed in part by the payment of page charges. Therefore, and solely to indicate this fact, this article is hereby marked “advertisement” in accordance with 18 USC section 1734. Support was granted by the Swedish Research Council (ID 621-2014-6187), the Berta Kamprad Foundation, the Gunnar Nilsson Cancer Foundation, and the Swedish Cancer Foundation. No other potential conflict of interest relevant to this article was reported.
Acknowledgments
We acknowledge Dr. Filip G. Kondev, Argonne National Laboratory, for support concerning decay data.
Footnotes
Published online May 21, 2015.
- © 2015 by the Society of Nuclear Medicine and Molecular Imaging, Inc.
REFERENCES
- Received for publication February 4, 2015.
- Accepted for publication April 28, 2015.


