


Abstract
The subtle hypoxia underlying chronic cardiovascular disease is an attractive target for PET imaging, but the lead hypoxia imaging agents 64Cu-2,3-butanedione bis(N4-methylthiosemicarbazone) (ATSM) and 18F-fluoromisonidazole are trapped only at extreme levels of hypoxia and hence are insufficiently sensitive for this purpose. We have therefore sought an analog of 64Cu-ATSM better suited to identify compromised but salvageable myocardium, and we validated it using parallel biomarkers of cardiac energetics comparable to those observed in chronic cardiac ischemic syndromes. Methods: Rat hearts were perfused with aerobic buffer for 20 min, followed by a range of hypoxic buffers (using a computer-controlled gas mixer) for 45 min. Contractility was monitored by intraventricular balloon, energetics by 31P nuclear MR spectroscopy, lactate and creatine kinase release spectrophotometrically, and hypoxia-inducible factor 1-α by Western blotting. Results: We identified a key hypoxia threshold at a 30% buffer O2 saturation that induces a stable and potentially survivable functional and energetic compromise: left ventricular developed pressure was depressed by 20%, and cardiac phosphocreatine was depleted by 65.5% ± 14% (P < 0.05 vs. control), but adenosine triphosphate levels were maintained. Lactate release was elevated (0.21 ± 0.067 mmol/L/min vs. 0.056 ± 0.01 mmol/L/min, P < 0.05) but not maximal (0.46 ± 0.117 mmol/L/min), indicating residual oxidative metabolic capacity. Hypoxia-inducible factor 1-α was elevated but not maximal. At this key threshold, 64Cu-2,3-pentanedione bis(thiosemicarbazone) (CTS) selectively deposited significantly more 64Cu than any other tracer we examined (61.8% ± 9.6% injected dose vs. 29.4% ± 9.5% for 64Cu-ATSM, P < 0.05). Conclusion: The hypoxic threshold that induced survivable metabolic and functional compromise was 30% O2. At this threshold, only 64Cu-CTS delivered a hypoxic-to-normoxic contrast of 3:1, and it therefore warrants in vivo evaluation for imaging chronic cardiac ischemic syndromes.
Hypoxia is a major factor in the pathology of cardiac ischemia. It is an important factor in the etiology of microvascular disease and cardiac hypertrophy, the prime determinant of the progression to heart failure, and the driver for compensatory angiogenesis (1–3). In microvascular disease, whereas gross perfusion measured by MR imaging or scintigraphy may appear normal, the myocardium is hypoxically compromised at the cellular level (4). This makes it an extremely difficult condition to diagnose, which currently must be done by exclusion of other pathologies (5). In hypertrophic myocardium, perfusion is also often “normal,” but increased cell size, loss of t-tubules, and scarring mean that increased diffusion distances critically limit oxygen delivery to mitochondria (6,7). To accurately characterize these conditions, imaging disparities between supply and demand for blood flow (ischemia), or O2 (hypoxia), would be a potentially more useful approach than measuring poor perfusion per se (8), but as yet, there are no methodologies sufficiently sensitive or specific for this purpose (9,10).
The PET tracer 64Cu-ATSM (R1 = R3 = R4 = R6 = Me, R2 = R5 = H; Fig. 1) exhibits rapid first-pass uptake and fast clearance from normoxic tissues (11) and blood (12), and rapid retention in hypoxic tissues to generate excellent images of tissue hypoxia within minutes. Experimentally, tissue 64Cu accumulation from 64Cu-ATSM has been demonstrated only in extreme models of acute hypoxia and ischemia in isolated perfused hearts, and in regionally occluded canine myocardium in vivo (13,14), appearing to have a hypoxia-selective threshold of 1 mm Hg or lower (11,15). Although this degree of hypoxia is compatible with the survival and radioresistance of cancer cells, for which it was designed, it is too severe for the long-term survival of cardiac myocytes (normal cardiac mitochondrial partial pressure of oxygen is 10–35 mm Hg) (16). In the one very small (7-patient) cardiac clinical trial that has been performed to date using 62Cu-ATSM, 62Cu accumulation was visualized in the myocardium of only 1 patient with unstable angina, despite 4 of those patients exhibiting increased regional 18F-FDG uptake (12). Thus, whereas 64Cu-ATSM can be used to selectively identify the extreme acute hypoxia commonly induced in experimental models, it seems insufficiently sensitive to detect the subtle hypoxia characterizing the chronic cardiac ischemic syndromes that are currently difficult to identify (9).

General structure of bis(thiosemicarbazones). 64Cu-ATS: R1 = R2 = CH3, R3 = R4 = H; 64Cu-ATSM = R1 = R2 = R3 = CH3, R4 = H; 64Cu-CTS = R1 = C2H5, R2 = CH3, R3 = R4 = H; 64Cu-ATSE: R1 = R2 = R3 = R4 = CH3.
The fundamental challenge, therefore, is to identify complexes that deposit their radiocopper payload within the myocardium at less extreme levels of hypoxia, where its biochemistry is perturbed but remains potentially salvageable. We reason that this target hypoxia threshold would be the point where there remains a degree of metabolic flexibility: a compromised but functional capacity for oxidative metabolism, but with sufficient adenosine triphosphate (ATP) turnover to maintain ionic homeostasis and cellular integrity (9). We have therefore performed a series of hypoxia titrations in the isolated heart to determine where this threshold lies using a panel of biochemical and biophysical assays. We then used a recently developed γ-detection array (17) to identify analogs of 64Cu-ATSM exhibiting greater sensitivity to hypoxia at this more relevant threshold.
MATERIALS AND METHODS
Reagents and Animals
All reagents were purchased from Sigma unless otherwise stated. Gases were supplied by BOC. Desired gas mixtures (O2/N2/CO2) were achieved using a GSM-3 gas mixer (CWE Inc.).
Male Wistar rats (275–300 g; Harlan), fed ad libitum, were used for all experiments. Animal procedures were in accordance with the Animals (Scientific Procedures) Act U.K. (1986).
Experimental Protocol
64Cu was produced and used to radiolabel 2,3-butanedione-bis(thiosemicarbazone) (ATS), diacetyl-bis(N4-ethylthiosemicarbazone) (ATSE), 2,3-butanedione bis(N4-methylthiosemicarbazone) (ATSM), and 2,3-pentanedione bis(thiosemicarbazone) (CTS) as previously described (17).
Rats (n = 6/group) were anesthetized with Sagatal (100 mg intraperitoneally) and heparinized (200 IU intraperitoneally), and their hearts were excised and cannulated in the Langendorff mode (18). The hearts were perfused at a constant flow (to simplify pharmacokinetic modeling) of 14 mL/min with a modified Krebs–Henseleit buffer (KHB) described previously (17) and gassed with a 95% O2/5% CO2 mixture, and contractile function was measured with a left ventricular balloon. Perfusion pressure was monitored by a pressure transducer in the arterial line. The hearts were paced at 300 beats per minute throughout.
After 20 min, perfusate delivery was switched to a second reservoir containing KHB equilibrated with a gas mixture containing either 95%, 40%, 30%, 20%, 10%, or 0% O2, balanced with N2 and 5% CO2 (for pH buffering), delivered by a gas mixer. Aliquots (1 mL) of coronary effluent were collected at regular intervals and analyzed for lactate content (2300 STAT Plus lactate analyzer; YSI Life Sciences) to identify the onset of anaerobic glycolysis, and creatine kinase content to monitor tissue necrosis. At the end of each experiment, the hearts were snap-frozen in liquid nitrogen before Western blotting for HIF-1α.
31P MR Spectroscopic Analysis
The hearts were cannulated and inserted into a 15-mm glass MR spectroscopy tube that was then placed in a custom-built MR spectroscopy probe, as previously described (19). 31P MR spectra were acquired on an Avance III 9.4T spectrometer (Bruker) using a 15-mm 31P/1H birdcage coil (20). Shimming was performed on the 1H line shape of water (full width at half maximum, <20 Hz). 31P spectra were acquired with a pulse-acquire sequence using a 60° flip angle, a repetition time of 3.8 s, and 64 scans (4 min per spectrum). The peak area of each metabolite was normalized to that of phosphocreatine during normoxia.
Profiling of Radiotracer Retention and Elution
In parallel groups of hearts, radiotracer uptake and pharmacokinetics were monitored using a custom-built triple-gamma-detector system (17) consisting of 3 orthogonally positioned lead-shielded NaI detectors interrogating the arterial input line, the heart, and the venous outflow lines, each connected to a modified GinaSTAR instant thin-layer chromatography system (Raytest Ltd.). Boluses (100 μL) containing 1 MBq of radiotracer were injected into the arterial line after 10 min of normoxia and 5 and 25 min of hypoxia. Time–activity curves generated by the GinaSTAR were imported into MATLAB (The MathWorks). Data were decay-corrected and normalized to the maximum value of each group. Tissue retention was calculated as the residual activity in the heart 20 min after injection as a percentage of the peak activity (percentage injected dose [%ID]), as previously described (21).
Western Blotting
The hearts were homogenized in 10 mL of homogenization buffer per gram of tissue (100 mM Tris, pH 7.4, 2 mM sodium vanadate, 5 mM sodium fluoride, 1× protease inhibitor cocktail tablet/50 mL, 4°C). Equal volumes of homogenate and 2× sodium dodecyl sulphate sample buffer were mixed before being loaded and separated by molecular weight using sodium dodecyl sulfate polyacrylamide gel electrophoresis on a 10% polyacrylamide gel. Proteins were transferred to polyvinylidene difluoride membranes (0.45 μm; GE Healthcare) using semidry blotting (BioRad). Blots were incubated for 2 h at room temperature with hypoxia-inducible factor 1-α (HIF-1α) antibody (rat polyclonal, 5 μg/mL; Abcam). After incubation with horseradish peroxidase–labeled secondary antibodies, blots were developed using enhanced chemiluminescence (Amersham Pharmacia Biotech), with glyceraldehyde-3-phosphate dehydrogenase (GAPDH) as a loading control. HIF-1α and GAPDH expression were quantified through film scanning and densitometry using Quantity One software (BioRad), with HIF-1α normalized to GAPDH.
Statistical Analysis
Analyses were performed using Prism (GraphPad Software Inc.). All values are expressed as the mean ± SD. A paired t test was used for all pairwise comparisons, and 1-way ANOVA with the Bonferroni adjustment was used for multiway comparisons. Dunnett postanalysis testing was applied when multiple comparisons were made to a control group.
RESULTS
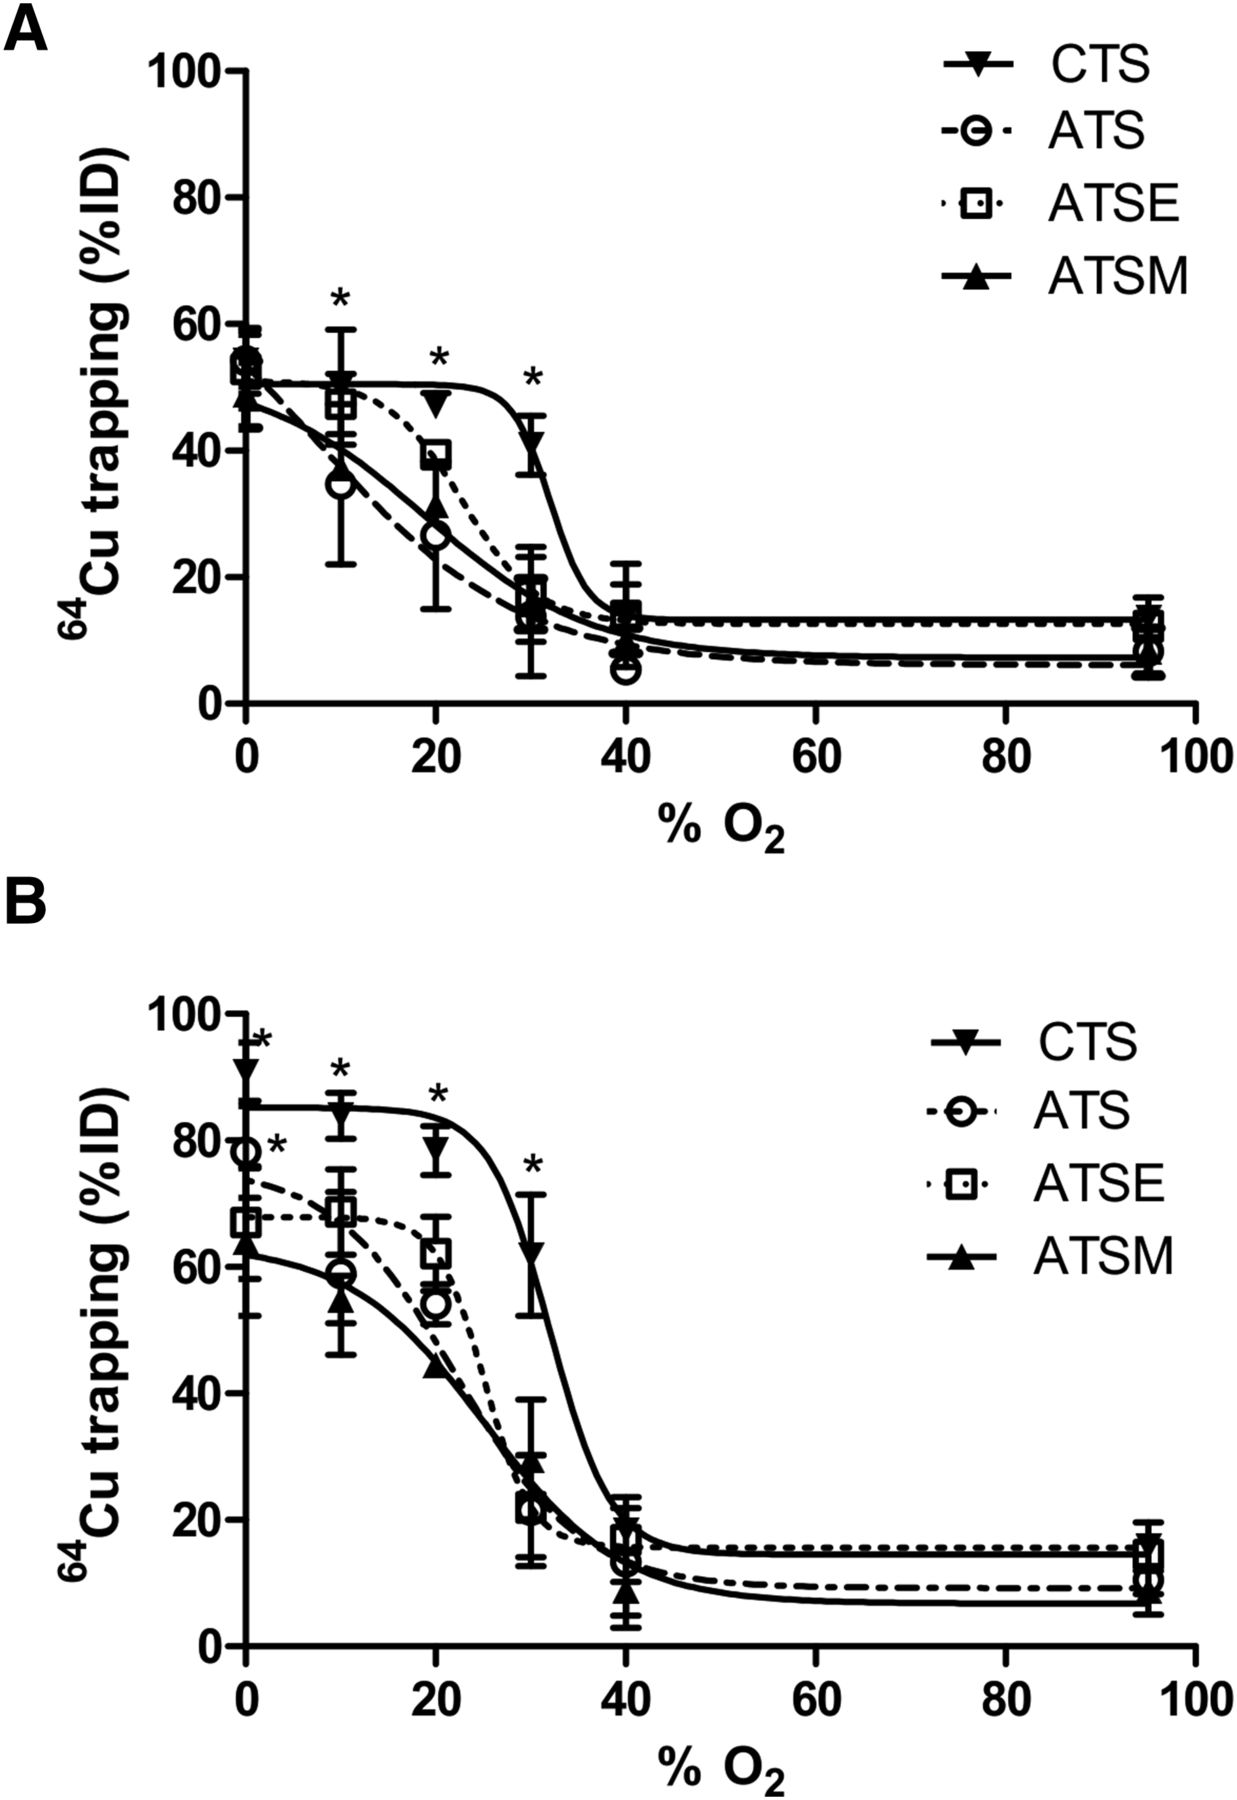
All tracers that were examined were found to deposit increasing amounts of radiocopper in the myocardium with increasingly severe hypoxia (Fig. 2). Hypoxia selectivity was apparent within 5 min of onset (Fig. 2A), with significant 64Cu retention in hearts injected with 64Cu-CTS with KHB equilibrated with 30% O2 (40.9 ± 4.6 %ID vs. 13.7 ± 3.1 %ID before hypoxia, P < 0.05) and a half-maximal effective concentration (EC50) of 32.1% O2. Although the other tracers also exhibited hypoxia selectivity, they were less sensitive; 64Cu-ATSM and 64Cu-ATSE were selective only at the 20% O2 threshold (31.3 ± 1.42 %ID and 39.34 ± 2.21 %ID; EC50, 18.9% and 22.9% O2, respectively), whereas 64Cu-ATS was selective only at the 10% O2 threshold (34.7 ± 12.7 %ID; EC50, 7.4% O2). The same selectivities were evident after 25 min (Fig. 2B), although the absolute amount of radiocopper deposition in each case was greater. 64Cu-CTS was the only tracer to selectively deposit radiocopper in the heart at 30% O2 (61.8 ± 9.6 %ID vs. 15.8 ± 3.8 %ID in normoxic hearts, P < 0.05; EC50, 32% O2), and consistently more than 64Cu-ATSM under all hypoxic conditions. The selectivity profiles of 64Cu-ATSM, 64Cu-ATSE, and 64Cu-ATS were largely similar (EC50, 25.2%, 25.1%, and 22.2% O2, respectively), although 64Cu-ATS deposited significantly more 64Cu than 64Cu-ATSM at 0% O2 (78% ± 7.2% vs. 63.4% ± 11.5%, P < 0.05).

Relationship between hypoxic buffer perfusion and 64Cu radiotracer uptake. Data (mean n = 6 ± SD) represent cardiac 64Cu retention from 64Cu-CTS, 64Cu-ATS, 64Cu-ATSE, and 64Cu-ATSM as %ID 10 min after injection after 5 min of hypoxia (A) and after 25 min of hypoxia (B). *Significantly different from prehypoxic control values (P < 0.05).
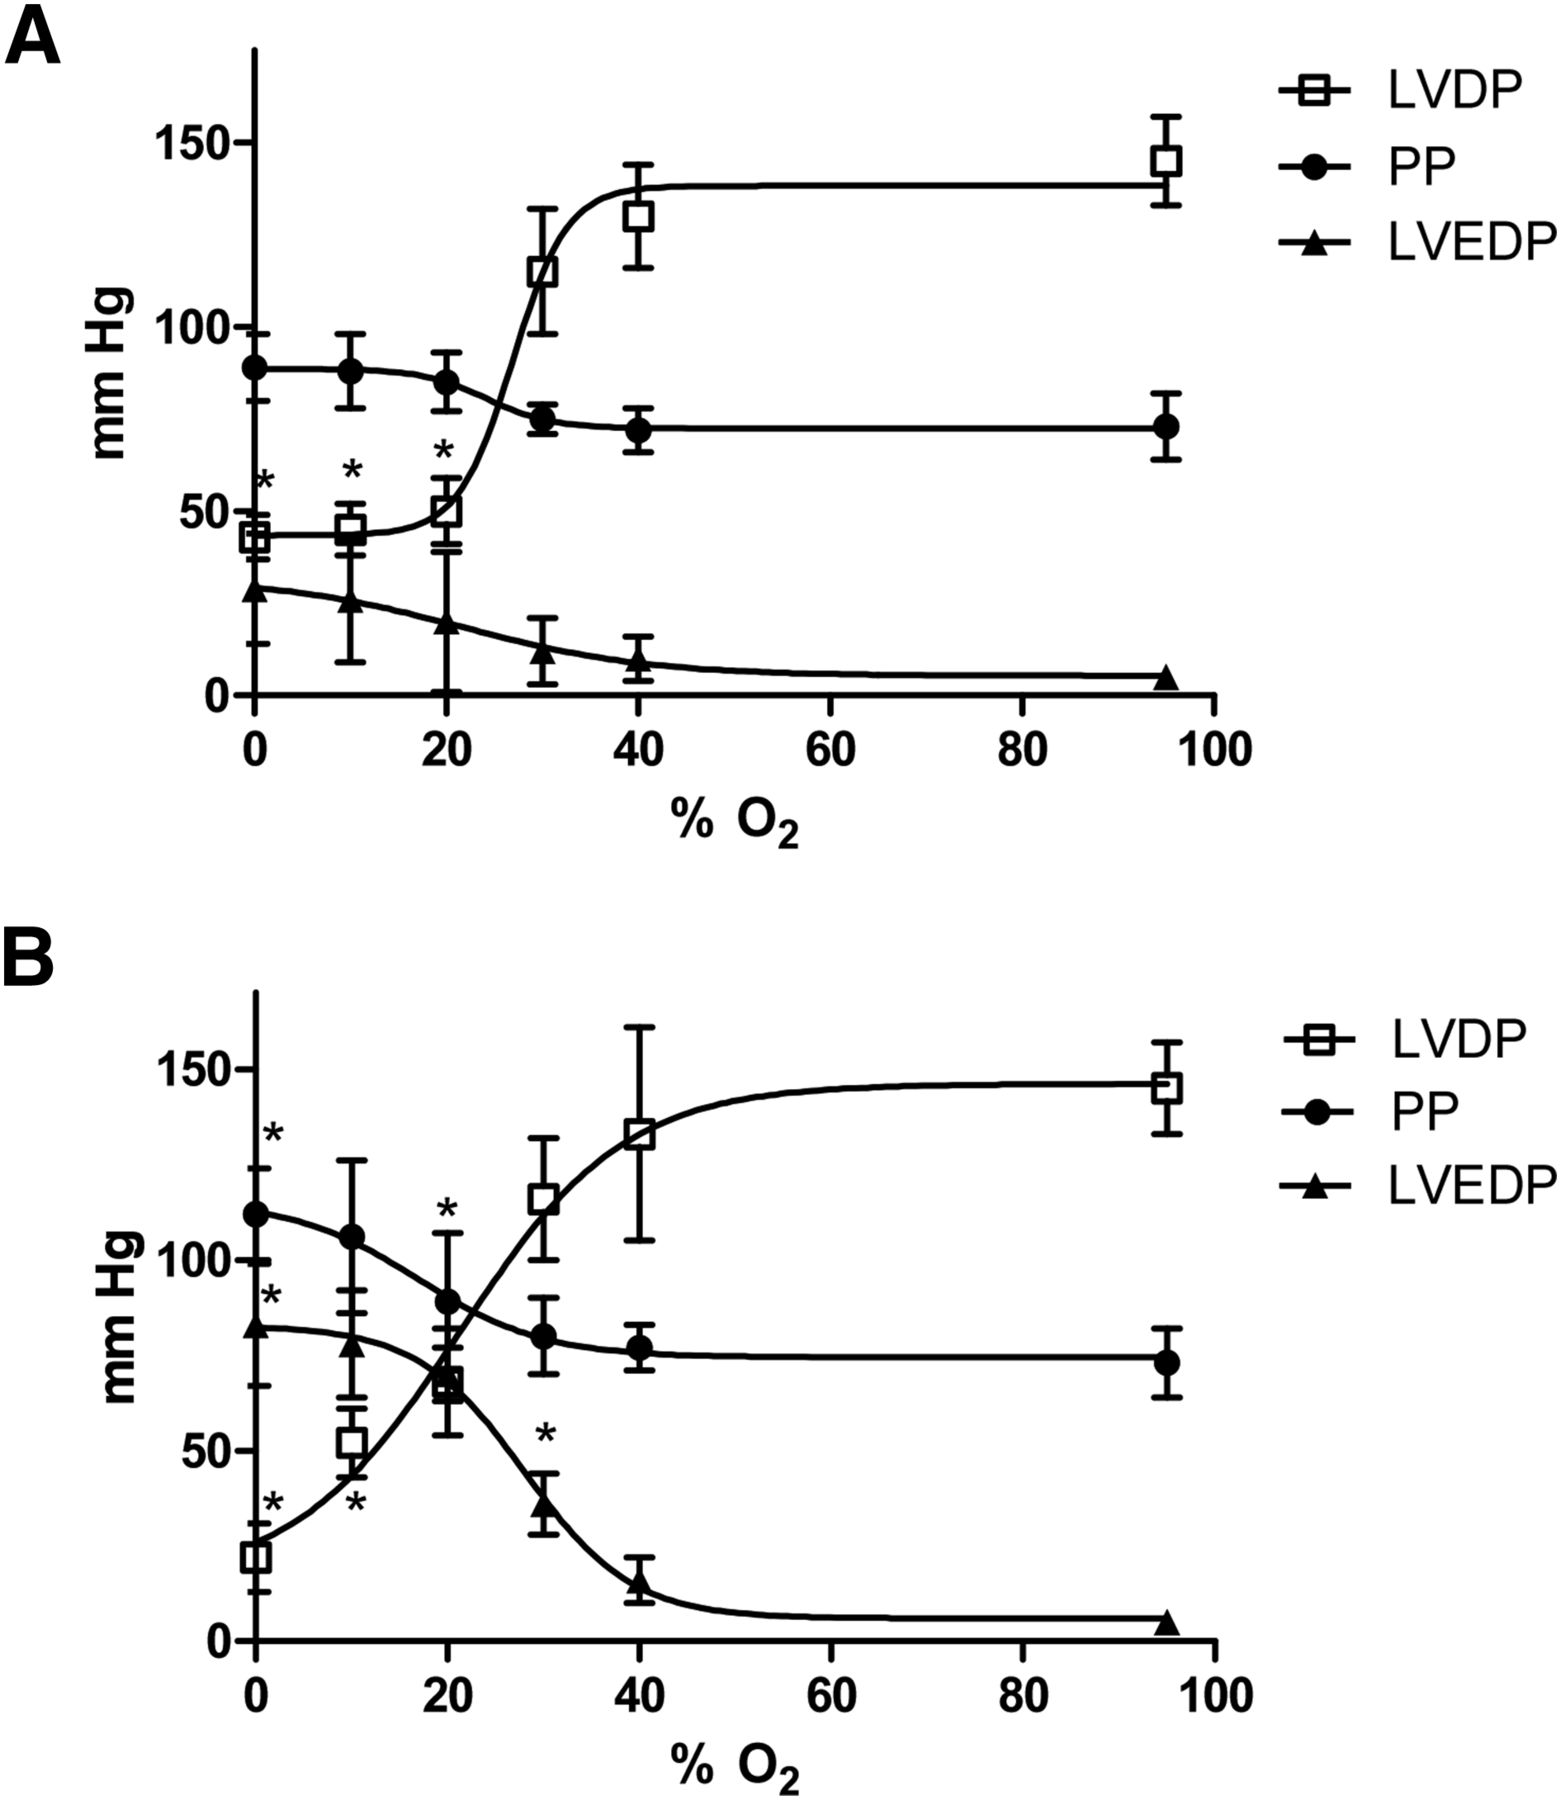
The critical threshold for decreasing left ventricular developed pressure within 5 min was 20% O2 (to 68 ± 14 mm Hg from a prehypoxic value of 145 ± 12 mm Hg, P < 0.05; Fig. 3A), although perfusion pressure and left ventricular end-diastolic pressure were unaffected. Perfusion with 30% O2 KHB elevated the left ventricular end-diastolic pressure above preischemic values after 25 min (36 ± 8 mm Hg vs. 5 ± 3 mm Hg, P < 0.05), whereas perfusion pressure was elevated within this time frame only by completely anoxic KHB (112 ± 12 mm Hg vs. 73 ± 9 mm Hg, P < 0.05).

Relationship between hypoxic buffer perfusion and cardiac contractility and hemodynamics. Data (mean n = 6 ± SD) represent changes in left ventricular developed pressure, left ventricular end-diastolic pressure, and perfusion pressure (PP) after 5 min of hypoxia (A) and after 25 min of hypoxia (B). *Significantly different from prehypoxic values (P < 0.05).
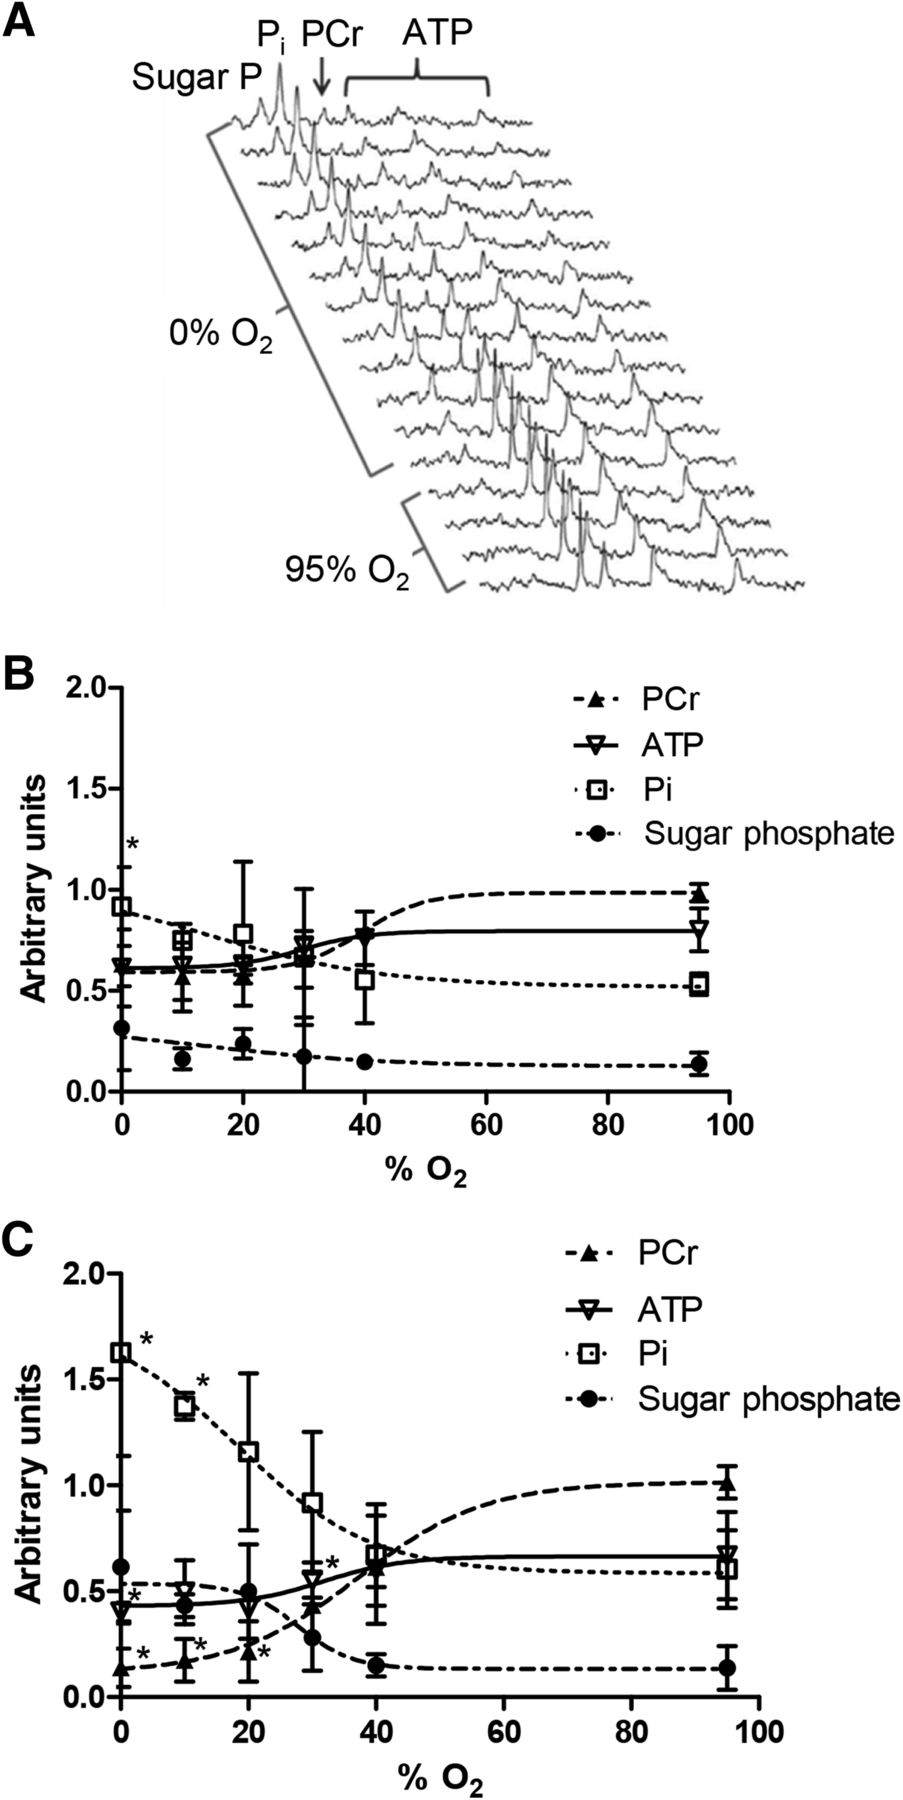
Representative 31P nuclear MR spectra from a heart perfused with 0% O2 KHB are shown in Figure 4A. Phosphocreatine was depleted by approximately 20 min of hypoxia, with a concomitant increase in inorganic phosphate. Sugar phosphates became apparent within 8 min, and by 25 min ATP levels were compromised. At 30% O2 KHB, cardiac phosphocreatine was decreased within 5 min (to 65.5% ± 14% of the prehypoxic value, P < 0.05; Fig. 4B), whereas phosphocreatine was compromised only by 40% O2 after 25 min (to 43.4% ± 1.4%, P < 0.05). ATP levels were unaffected by 30% O2 KHB but were depleted by 20% O2 KHB (from 66.8% ± 20% to 41.8% ± 17%, P < 0.05; Fig. 4C); perfusion with more hypoxic buffers achieved no greater degree of ATP loss. Sugar and inorganic phosphates were not elevated by hypoxia after 5 min but accumulated after 25 min of perfusion with 20% O2 (116% ± 37% vs. 60% ± 18% and 49.8% ± 22.2% vs. 13.8% ± 10.3%, respectively; P < 0.05). Although lactate washout was evident after 25 min of perfusion with 30% O2 KHB (0.21 ± 0.07 nmol vs. 0.01 ± 0.02 nmol during normoxia, P < 0.05; Fig. 5A), it increased further with 20% O2 KHB to a near-maximal value of 0.46 ± 0.11 nmol (P < 0.05). There was no evidence of creatine kinase leakage in any experimental group (data not shown). HIF-1α–to–GAPDH expression was elevated after 25 min of 30% O2 KHB (0.278 ± 0.064 vs. normoxic 0.175 ± 0.047, P < 0.05; Fig. 5B), rising to a maximum of 0.61 ± 0.08 with 0% O2 KHB.

(A) Representative 31P nuclear MR spectra showing changes in cardiac energetics during perfusion with 0% O2 buffer. (B and C) Relationship between hypoxic buffer perfusion and cardiac energetics. Data mean (n = 6 ± SD) represents changes in phosphocreatine (PCr), ATP, inorganic phosphate (Pi), and sugar phosphates after 5 min and 25 min of hypoxia. *Significantly different from prehypoxic values (P < 0.05).

(A) Relationship between hypoxic buffer perfusion and lactate washout after 5 min and 25 min of hypoxia. (B) HIF-1α expression at end of each perfusion protocol. Data are mean values (n = 6) ± SD. *Significantly different from prehypoxic values (P < 0.05).
DISCUSSION
We recently demonstrated that 64Cu-CTS and its analog 64Cu-ATS exhibit significantly greater hypoxia selectivity than the current lead compound 64Cu-ATSM in hearts perfused with hypoxic (0% O2) buffer (17). Although this finding was a promising first step in the screening process, the key to the progression of this class of compounds is to identify complexes selective for levels of hypoxia that correlate with survivable (and treatable) cardiac disease (9,10). The relative sensitivities of these complexes to pathophysiologically relevant degrees of cardiac hypoxia were previously unknown. In this study, we identified a key hypoxic threshold that induces the major hallmarks of compromised but salvageable myocardium: depressed contractile function, compromised phosphocreatine levels (but stable ATP levels), elevated HIF-1α expression, and increased but not maximal lactate washout (indicating residual oxidative reserve). At this threshold, achieved by perfusion with KHB saturated with 30% O2, we demonstrated that 64Cu-CTS is the only complex among the 4 evaluated that provides a hypoxic-to-normoxic tissue contrast that would be exploitable for PET imaging (9).
Our approach—identifying parallel biomarkers of biochemical compromise to correlate against tracer uptake—circumvents the difficult problem of describing tracer uptake in terms of absolute (and potentially arbitrary) intracellular oxygen concentrations, which not only are difficult to determine but also would vary in relevance dependent on oxygen demand, cardiac workload, and experimental model (16). Our approach also allows an immediate bioenergetic interpretation of the relevance of increased cardiac tracer retention, which is arguably translatable from the Langendorff perfused heart to the clinical situation. Although changes in cardiac energetics can be quantified by 31P MR spectroscopy in clinical MR systems, the technical capacity and infrastructure to do so is not widespread, requires significant expertise and long acquisition times, and results in images of poor spatial resolution. Correlating PET tracer uptake with these key changes in cardiac energetics could therefore provide the same biochemical insight as 31P MR spectroscopic imaging but exploit a technically simpler imaging approach with significantly greater temporal and spatial resolution (the typical voxel size for clinical 64Cu PET is 65 mm3 (22), compared with 560 mm3 for 31P MR imaging at 3 T (23)).
We demonstrated that perfusion of hearts with 30% O2-saturated KHB significantly depleted phosphocreatine but was sufficient to maintain intracellular ATP and a degree of contractility. These characteristics mirror the reductions in phosphocreatine-to-ATP ratio previously demonstrated by 31P MR spectroscopy in patients with heart failure (24,25) and hypertrophic cardiomyopathy (26) and correlate with declining left ventricular ejection fraction and increased mortality (27). Although moderate depletion of cardiac ATP has also been observed in patients diagnosed with hypertrophied and failing myocardium (28), we used a less severe experimental threshold at which phosphocreatine levels were compromised but ATP levels were maintained, to provide a more sensitive means of screening for diagnostically relevant hypoxia-selective complexes. Crucially, whereas 30% O2 KHB increased lactate release by the heart, the rate of lactate washout became maximal only when hearts were perfused with KHB equilibrated with 20% O2 and below, suggesting that at 30% O2 there was still an aerobic metabolic reserve. At this key threshold, therefore, cardiac energetics and contractile function were compromised, but there was residual oxidative metabolism (and by inference mitochondrial function), suggesting that this degree of hypoxia would be sustainable chronically, making it a reasonable model of chronic cardiac ischemia.
For increased intracellular HIF-1α, 30% O2 was also the threshold. As the key regulator of hypoxic gene expression, HIF-1α is responsible for numerous acute and chronic adaptive responses to tissue hypoxia, ranging from elevated glucose uptake and altered calcium handling to cardiac remodeling (29), cardiomyopathy (30), microvascular disease (31), and heart failure (32), whereas chronic activation of HIF-1α in animal models leads to progressive heart failure and premature death (33). Elevated HIF-1α was therefore a prerequisite for the threshold against which to evaluate our tracers. There is currently no noninvasive method for measuring intracellular HIF-1α; a hypoxia-specific imaging agent that correlates with the onset of hypoxia-dependent HIF-1α stabilization, such as we identify in 64Cu-CTS, is therefore a potentially useful development.
Although our isolated heart model is ideal for establishing basic structure–activity relationships of new tracers, it is limited in that it cannot inform on other important pharmacokinetic factors such as tracer metabolism. Hueting et al. have recently suggested in this journal that the biodistribution and pharmacokinetics of 64Cu-acetate in tumor-bearing mice is similar to that of 64Cu-ATSM when assessed after 2 or 16 h, and that 64Cu-acetate exhibits hypoxia selectivity in cultured cancer cells, suggesting that 64Cu-bis(thiosemicarbazone) complexes dissociate quickly in vivo and that the resultant biodistribution observed by PET is that of free copper, questioning the validity of 64Cu-ATSM as a hypoxia tracer (34). We and other groups have observed no such nonspecific uptake of ionic 64Cu2+ salts in normoxic or hypoxic myocytes in culture (15), CHO cells (35), or isolated buffer-perfused hearts (17,21). The wide variation in pharmacokinetics and early biodistributions that the different bis(thiosemicarbazones) have been shown to display, with some being hypoxia-selective (ATSM, ATS, CTS) and some not (pyruvaldehyde-bis(N4-methylthiosemicarbazone) [PTSM], glyoxal-bis(N4-methylthiosemicarbazone) [GTSM]), and with some crossing the blood–brain barrier (GTSM, PTSM, ATSM) and some not (ATS) (36,37), would also argue against a common nonselective mechanism of early tissue uptake. If such a mechanism does exist, it is likely dependent on tracer metabolism and on late recirculation of 64Cu2+ in copper transport proteins. We have recently shown that 64Cu-ATSM, 64Cu-CTS, and 64Cu-ATS all rapidly wash out of normoxic myocardium in rats in vivo to a stable low level within 5 min of injection, with no secondary creep of nonspecific cardiac accumulation due to recirculation in the ensuing 30 min of imaging (17), and no significant 64Cu retention in healthy myocardium by biodistribution after 90 min. If secondary recirculation of 64Cu occurs at later time points, the time between injection and imaging and the relative in vivo stability of these complexes would be an important consideration in their use and interpretation. Our study and many others that preceded it (14,17,21) highlight the rapid hypoxia selectivity and tissue clearance of these tracers (within 5 min from normoxic myocardium both ex vivo and in vivo) (17,38). We would therefore suggest that the rapid kinetics of these tracers should be exploited to minimize the potential impact of metabolism and recirculation by keeping imaging times short.
We used 64Cu in these experiments because its 12-h half-life allows us to perform several experiments from each batch. However, its half-life is not ideal in terms of patient exposure, and with a positron yield of only 17.8%, nor is its dosimetry. In contrast, 62Cu production does not require a cyclotron, has a half-life of only 9.74 min, and has a 98% positron yield. The rapid kinetics that these tracers display would be very well suited to exploiting the dose-limiting advantages of 62Cu radiolabeling clinically. We used isolated perfused hearts in this study because the model allows the accurate and reproducible induction of a range of hypoxic severity that would not be possible (or survivable or measurable) in vivo. It should of course be noted that tracer pharmacokinetics in blood may differ from those in aqueous solution, and that the relationship between cardiac workload, arterial blood supply, and tracer retention is likely to differ from that in vivo. We have, however, demonstrated the relative hypoxia selectivities of these tracers perfused under the same conditions, and 64Cu-CTS appears to be a significant improvement on 64Cu-ATSM in terms of hypoxia sensitivity.
We are currently unable to explain fully why 64Cu-CTS exhibits better selectivity for low-grade hypoxia than 64Cu-ATSM. Previous reports have suggested that hypoxia selectivity might be primarily governed by redox potential, yet 64Cu-ATS, 64Cu-CTS, 64Cu-ATSM, and 64Cu-ATSE all have the same redox potential (−0.59 V vs. Ag/AgCl (35)) and different hypoxia selectivities. It therefore appears that although redox potential imparts hypoxia selectivity generally (the non–hypoxia-selective tracer 64Cu-PTSM has a lower redox potential of −0.51 V), subtle modification of redox potential is not the only route by which hypoxia selectivity can be fine-tuned. We previously demonstrated that decreasing the tracer lipophilicity increased tracer fast clearance rate and improved hypoxic-to-normoxic contrast over 64Cu-ATSM (17) (the logP values of 64Cu-ATSE, 64Cu-ATSM, 64Cu-CTS, and 64Cu-ATS are 2.34, 1.61, 1.01, and 0.35, respectively (21,35)). There is a limit to this tactic, however, since 64Cu-ATS, which has the lowest lipophilicity, provided no further gain in hypoxia sensitivity at the 30% threshold. We speculate that the subtle balance between redox potential, lipophilicity, and steric hindrance of redox and ligand exchange reactions governs residence time in the cell (or its intracellular localization) and determines the rate at which each complex is reduced, reoxidized, and dissociated to release its payload.
CONCLUSION
Hypoxia imaging has the capacity to augment current techniques for identifying viable but at-risk myocardium. Diffuse hypoperfusion associated with noncompensated hypertrophy or microvascular disease is currently difficult to diagnose by imaging perfusion; specifically imaging the resultant hypoxia by PET may be a useful alternative approach. 64Cu-ATSM seems insufficiently sensitive to target myocardium compromised by such low-level survivable hypoxia; we have identified 64Cu-CTS as a potentially more suitable PET tracer in this regard.
DISCLOSURE
The costs of publication of this article were defrayed in part by the payment of page charges. Therefore, and solely to indicate this fact, this article is hereby marked “advertisement” in accordance with 18 USC section 1734. Financial support was received from the KCL BHF Centre of Research Excellence, BHF award RE/08/003 (grant PG/10/20/28211), the Department of Health via the National Institute for Health Research (NIHR) comprehensive Biomedical Research Centre award to Guy’s and St. Thomas’ NHS Foundation Trust in partnership with King’s College London and King’s College Hospital NHS Foundation Trust, and the King’s College London and UCL Comprehensive Cancer Imaging Centre. This work was also funded by the British Heart Foundation, the CRUK, and EPSRC in association with the MRC and DoH (England). No other potential conflict of interest relevant to this article was reported.
Acknowledgments
The views expressed in this article are those of the authors and not necessarily those of the NHS, the NIHR, or the DoH (England).
Footnotes
Published online Apr. 16, 2015.
- © 2015 by the Society of Nuclear Medicine and Molecular Imaging, Inc.
REFERENCES
- Received for publication September 10, 2014.
- Accepted for publication March 26, 2015.


