


Abstract
123I-iodobenzovesamicol is a SPECT radioligand selective for the vesicular acetylcholine transporter (VAChT) and used to assess the integrity of cholinergic pathways in various neurologic disorders. The current noninvasive method for quantitative analysis of 123I-iodobenzovesamicol, based on multilinear reference tissue model 2 (MRTM2), requires repeated scans for several hours, limiting its application in clinical trials. Our objective was to validate a simplified acquisition method based on a single 123I-iodobenzovesamicol static scan preserving the quantification accuracy. Three acquisition times were tested comparatively to a kinetic analysis using MRTM2. Methods: Six healthy volunteers underwent a dynamic SPECT acquisition comprising 14 frames over 28 h and an MR imaging scan. MR images were automatically segmented, providing the volumes of 19 regions of interest (ROIs). SPECT datasets were coregistered with MR images, and regional time–activity curves were derived. For each ROI, a complete MRTM2 pharmacokinetic analysis, using the cerebellar hemispheres as the reference region, led to the calculation of a 123I-iodobenzovesamicol-to-VAChT binding parameter, the nondisplaceable binding potential (BPND-MRTM2). A simplified analysis was also performed at 5, 8, and 28 h after injection, providing a simplified BPND, given as BPND-t = CROI − Ccerebellar hemispheres/Ccerebellar hemispheres, with C being the averaged radioactive concentration. Results: No significant difference was found among BPND-5 h, BPND-8 h, and BPND-MRTM2 in any of the extrastriatal regions explored. BPND-28 h was significantly higher than BPND-5 h, BPND-8 h, and BPND-MRTM2 in 9 of the 17 regions explored (P < 0.05). BPND-5 h, BPND-8 h, and BPND-28 h correlated significantly with BPND-MRTM2 (P < 0.05; ρ = 0.99, 0.98, and 0.92, respectively). In the striatum, BPND-28 h was significantly higher than BPND-5 h and BPND-8 h. BPND-5 h differed significantly from BPND-MRTM2 (P < 0.05), with BPND-5 h being 43.6% lower. Conclusion: In the extrastriatal regions, a single acquisition at 5 or 8 h after injection provides quantitative results similar to a pharmacokinetic analysis. However, with the highest correlation and accuracy, 5 h is the most suitable time to perform an accurate 123I-iodobenzovesamicol quantification. In the striatum, none of the 3 times has led to an accurate quantification.
Many recent studies have revealed the involvement of cholinergic impairment in neurologic disorders, leading to growing interest in in vivo imaging of cholinergic networks (1–3). 123I-iodobenzovesamicol is a highly selective SPECT radioligand for imaging of the vesicular acetylcholine transporter (VAChT), an in vivo presynaptic marker of the cholinergic neurons reflecting the integrity of the brain cholinergic pathways. Indeed, 123I-iodobenzovesamicol imaging demonstrated impaired cholinergic systems in various neurodegenerative diseases (4–7).
The current noninvasive method for quantification of 123I-iodobenzovesamicol SPECT data, based on the pharmacokinetic multilinear reference tissue model 2 (MRTM2) (8,9), allows the calculation of an 123I-iodobenzovesamicol-to-VAChT binding ratio, the nondisplaceable binding potential (BPND). Even though the occipital cortex has been classically used as the reference region (9), use of the cerebellum was also recently proposed (10), and particularly the cerebellar hemispheres (11). 123I-iodobenzovesamicol quantification with MRTM2 was successful in providing a better understanding of pathophysiology in neurologic disorders involving cholinergic impairment (5,6). However, the technique requires repeated scans for several hours, limiting its application in large-scale clinical trials. Alternative methods exist to derive kinetic parameters from the analysis of the activity distribution at equilibrium, when the target–tracer association and dissociation rates are equal (12,13). In a previous study, we have shown that a consistent BPND calculation was possible using a single acquisition at 6 h after injection (9). Indeed, a significant correlation was found with the complete kinetic MRTM2, increasing with time and suggesting that the acquisitions should be extended beyond 6 h (9), possibly until 24 h after injection as proposed by Kuhl et al. (14). However, this simplified quantification method was performed only in the striatum, a region with a high level of 123I-iodobenzovesamicol binding, whereas cholinergic pathway dysfunctions involve areas with low levels of 123I-iodobenzovesamicol binding.
To find the optimal trade-off between accuracy and simplicity for 123I-iodobenzovesamicol quantification throughout cholinergic pathways, we proposed assessing the validity of a single-SPECT-scan acquisition method with 123I-iodobenzovesamicol across the whole brain, by testing various single-scan times of 5 h, 8 h, and 28 h after injection. The proposed method was compared with the kinetic MRTM2 method using dynamic imaging data acquired until 28 h after injection. With regard to choice of the reference region, the similarity between the occipital cortex and the cerebellar hemispheres was assessed.
MATERIALS AND METHODS
Subjects
The participants consisted of 6 healthy volunteers (mean age ± SD, 66.8 ± 1.5 y) without any neuropsychiatric disorder based on a screening interview by an experienced senior neuropsychologist.
The study was initiated after protocol approval by the Institutional Human Ethics Committee (registration number 2002/01) and radioactive drug approval by the National Health Product Safety Agency. Before providing written consent, all participants were presented with the basic design of the study and were informed that they could withdraw from the investigation at any time.
Radiochemistry
123I-iodobenzovesamicol was prepared and controlled as previously described (7). Briefly, after radioiodination, 123I-iodobenzovesamicol was purified by high-pressure liquid chromatography and Sep-Pack C18 classic cartridge (Waters) and filtered, leading to 10 mL of sterile solution of 123I-iodobenzovesamicol. Before injection, the solution was assessed to be pyrogen-free using the Endosafe-PTS portable test system (Charles River Laboratories).
Scanning Protocol
Anatomic MR Imaging
For anatomic colocalization with the SPECT data, subjects underwent a 3-dimensional T1-weighted MR imaging sequence (repetition time/echo time, 7.1/3.5 ms; 8° flip angle; field of view, 256 × 256 mm to cover the whole brain, yielding 228 slices [1-mm slice thickness; 1-mm3 isotropic voxel size]) using a 1.5-T MR imaging system (Philips).
SPECT/CT Imaging
Imaging was performed on a SPECT/CT Symbia T2 camera (Siemens) equipped with low-energy thin-section collimators. Participants were orally given 400 mg of potassium perchlorate 30 min before and 24 h after imaging. After a mean intravenous injection of 235.1 ± 41.9 MBq of 123I-iodobenzovesamicol, the dynamic SPECT images were acquired over 28 h at 6 different times: 5 frames of 6 min starting at the time of injection, 2 frames of 15 min at 2, 3, 5, and 8 h after injection, and 1 final 15-min frame at 28 h after injection (64 projections with a matrix of 64 × 64 over 360°). Between each of the first 5 acquisitions, the participants were allowed to rest outside the gantry.
SPECT images were reconstructed on a 64 × 64 matrix using a Flash (Siemens) 3-dimensional iterative reconstruction (4 iterations, 8 subsets) and a voxel size of 6.8 × 6.8 × 6.8 mm. Attenuation correction was based on the CT image, and decay correction and normalization for frame duration were also performed. All the frames were rigidly registered together and with the CT image, to ensure the patient’s brain was in the exact same position in all images during creation of the dynamic SPECT dataset.
SPECT Data Processing
SPECT Data Registration to MR Images
For each subject, the participants’ CT and MR images were rigidly coregistered and the transformation parameters were subsequently applied to the SPECT dataset, providing a 4-dimensional dynamic SPECT image registered to the MR image.
Partial-Volume Effect Correction of Dynamic SPECT Dataset
The MR-coregistered SPECT image was corrected for partial-volume effect using the Müllër MR-based method (15), implemented in PMOD software (version 3.3; PMOD Technologies). For each subject, the MR image was automatically segmented into gray matter, white matter, and cerebrospinal fluid probability maps and the partial-volume correction procedure subsequently proceeded, correcting the SPECT data for gray matter spill-out and white matter spill-in.
Time–Activity Curve Calculation
For each participant, the MR-registered and partial-volume effect–corrected dynamic SPECT data were used for derivation of regional time–activity curves. For each subject, the MR image was automatically segmented using Freesurfer software (16), providing the volumes and labels of 19 gray matter regions of interest (ROIs), including various cortical and subcortical structures: orbitofrontal cortex, dorsolateral and ventrolateral cortices, motor and premotor cortices, anterior prefrontal cortex, primary visual cortex, inferior and middle occipital cortices, superior occipital cortex, superior parietal cortex, inferior parietal cortex, temporal cortex, anterior cingulate cortex, posterior ventral cingulate cortex, posterior dorsal cingulate cortex, hippocampus, amygdalohippocampal complex, thalamus, striatum, cerebellar vermis, and cerebellar hemispheres. The PMOD software was used to subsequently apply this gray matter template to each frame of the registered and partial-volume effect–corrected dynamic SPECT data to obtain average decay-corrected regional activities, which were plotted against time to derive regional time–activity curves.
Pharmacokinetic Model
Theory of Model-Based Analysis
Compartment modeling describes brain uptake and binding of radiotracer. The ordinary differential equations describing the 2-tissue-compartment models are Eq. 1where Cp is the radiotracer concentration in plasma, CT is the regional time–activity curve of the radiotracer in the tissue of interest, CS is the specifically bound radiotracer concentration in tissue, and CND (nondisplaceable) is the free and nonspecifically bound radiotracer concentration in tissue. The rate constants K1 (mL/g per minute) and k2 (per minute) describe the influx and efflux, respectively, of the radiotracer through the blood–brain barrier, and the rate constants k3 (per minute) and k4 (per minute) describe the tracer transfer between the nondisplaceable (CND) and the specific binding (CS) compartments (9).
In a reference region, a region devoid of receptor sites, k3 is equal to 0 and the model reduces to a single tissue compartment described by the equation Eq. 2where C′ND is the radiotracer concentration in the reference region, and the rate constants K′1 and k′2 describe the influx and efflux, respectively, of the radiotracer to and from the reference region (9).
Quantification of 123I-Iodobenzovesamicol SPECT Data
In a previous study (9), pharmacokinetic modeling using multilinear reference tissue model 2 (MRTM2) (8) was shown to best correlate with invasive blood-sampling analysis (14) and was therefore considered the reference method for noninvasive quantification of 123I-iodobenzovesamicol data. A 2-step approach used with MRTM2, combining calculation of the reference region–to–plasma k′2 and multilinear regression analysis (9), led, for each ROI, to the calculation of the BPND value, a parameter that is proportional to the density of receptor sites—in this case, VAChT binding sites.
In the present study, we tested two 123I-iodobenzovesamicol quantification methods. First, we applied the MRTM2 method and calculated 123I-iodobenzovesamicol-to-VAChT BPND values for each participant and each ROI, using the cerebellar hemispheres as the reference region. We also applied a simplified analysis to calculate BPND values, based on a single acquisition at 5, 8, and 28 h after injection. Theoretically, a simplified analysis is valid at peak equilibrium, when the specific binding is maximum, corresponding to dCS(t)/dt = 0 (9,12,13). Assuming that CND equals C′ND, from Equation 1 we have Eq. 3Consequently, in the proposed simplified analysis, BPND values were calculated for each participant, each ROI, and each selected single-scan time, as BPND-t = (CROI − Ccerebellar hemispheres)/Ccerebellar hemispheres, where C is the averaged radioactive concentration measured at the selected single-scan time.
Statistical Analysis
In each ROI, the Friedman repeated-measures ANOVA by ranks was used to assess differences between BPND values obtained with the 4 following methods: MRTM2 and a single scan acquired at 5, 8, or 28 h after injection. Post hoc paired comparisons were achieved with the Dunn test. Correlations between BPND values calculated with a single acquisition and BPND values calculated with the MRTM2 method were assessed using Spearman correlations. Statistical analyses were performed using SPSS software (version 22; IBM) and Statistica software (version 9; Statsoft). A P value of less than 0.05 was considered statistically significant.
RESULTS
Brain SPECT Images and Time–Activity Curves
For a representative subject, Figure 1A shows images obtained at 0, 5, 8, and 28 h after injection. A typical image of cerebral blood flow with diffuse tracer is visible immediately after injection, whereas differential binding of 123I-iodobenzovesamicol appears over time, predominantly in the striatum. Figure 1B represents the time–activity curves averaged over the population in some brain regions. Uptake is seen to peak within the first 30 min, a characteristic phenomenon of flow-mediated tracer delivery in the brain. Two hours after injection, sharp contrast between regions with high and low cholinergic innervation is found, with the highest uptake being in the striatum and the lowest in the cerebellar hemispheres, chosen as the reference region. This contrast is strengthened over time, as tracer binding decreases in regions with moderate to low cholinergic innervation (thalamus, parahippocampal complex, vermis, cortical regions, cerebellar hemispheres) and remains stable in the striatum up to 28 h after injection. The mean striatum-specific binding, calculated as the difference [striatum − cerebellar hemispheres] (dashed curve in the figure), reaches a maximum at 8 h after injection, which is maintained until 28 h.

Cross-sectional SPECT images acquired at 0, 5, 8, and 28 h after injection (A) and characteristic tissue time–activity curves (data are mean ± SE of population) for some brain regions (solid lines) and striatum-specific binding curve (dashed) (B).
Reference Region Assessment
Mean time–activity curves obtained in the cerebellar hemispheres, the cerebellar vermis, and the superior occipital cortex are visible in Figure 1B. For a better visual assessment, Figure 2 shows curves obtained between 2 and 28 h after injection for the same ROIs. 123I-iodobenzovesamicol concentrations were higher in the vermis than in the cerebellar hemispheres. In the latter region, 123I-iodobenzovesamicol concentrations were similar to those in the superior occipital cortex.

Mean time–activity curves obtained between 2 and 28 h after injection for cerebellar vermis, cerebellar hemispheres, and superior occipital cortex.
Quantitative Analyses in the Extrastriatal ROIs
The BPND results for the extrastriatal regions from the MRTM2 kinetic analysis and the simplified analyses at 5, 8, and 28 h after injection are presented in Figure 3 and Table 1. A Friedman repeated-measures ANOVA among the BPND-5 h, BPND-8 h, BPND-28 h, and BPND-MRTM2 values showed a significant difference in 9 of the 17 explored regions (P < 0.05). Post hoc paired comparisons with the Dunn test revealed that BPND-28 h was significantly higher than BPND-5 h and BPND-8 h in 5 of the 17 explored regions (P < 0.05) and than BPND-5 h in 2 of the 17 explored regions (P ≤ 0.01). Post hoc paired comparisons with the Dunn test also revealed that BPND-28 h was significantly higher than BPND-5 h and BPND-MRTM2 in the hippocampus (P < 0.05) and than BPND-8 h in the dorsal and ventrolateral cortices (P < 0.05).

BPND values calculated in extrastriatal ROIs according to the method. Data are mean ± SE of population. *Significant difference vs. MRTM2 and static analysis at 5 h (Dunn, P < 0.05). **Significant difference vs. 5 h (Dunn, P ≤ 0.01). ***Significant difference vs. static analyses at 5 and 8 h (Dunn, P < 0.05). §Significant difference vs. 8 h (Dunn, P < 0.05).
BPND Values Calculated in Extrastriatal ROIs
A correlation study was performed between BPND evaluated with MRTM2 and BPND evaluated with the simplified analyses performed at 5, 8, and 28 h after injection (Fig. 4). A significant correlation was found for all 3 methods: ρ = 0.99, P < 0.05; ρ = 0.98, P < 0.05; and ρ = 0.92, P < 0.05, respectively.

Correlation between BPND values calculated using MRTM2 and those calculated using static analysis at 5 h (A and B), 8 h (C), and 28 h (D). As striatum data point was far from others (A), correlation coefficients were recalculated after exclusion of data point (B–D). *Statistically significant (Spearman, P < 0.05).
Quantitative Analyses in the Striatum
The results of BPND obtained in the striatum using the MRTM2 kinetic analysis and the simplified analyses at 5, 8, and 28 h after injection are presented in Table 2. A Friedman repeated-measures ANOVA among the BPND-5 h, BPND-8 h, BPND-28 h, and BPND-MRTM2 values showed a significant difference (P < 0.0001). Post hoc paired comparisons with the Dunn test revealed that BPND-5 h differed significantly from BPND-MRTM2 (P < 0.05), with BPND-5 h being 43.6% lower. Post hoc paired comparisons with the Dunn test also showed that BPND-28 h differed significantly from BPND-5 h and BPND-8 h (P < 0.05).
BPND Values Calculated in Striatum
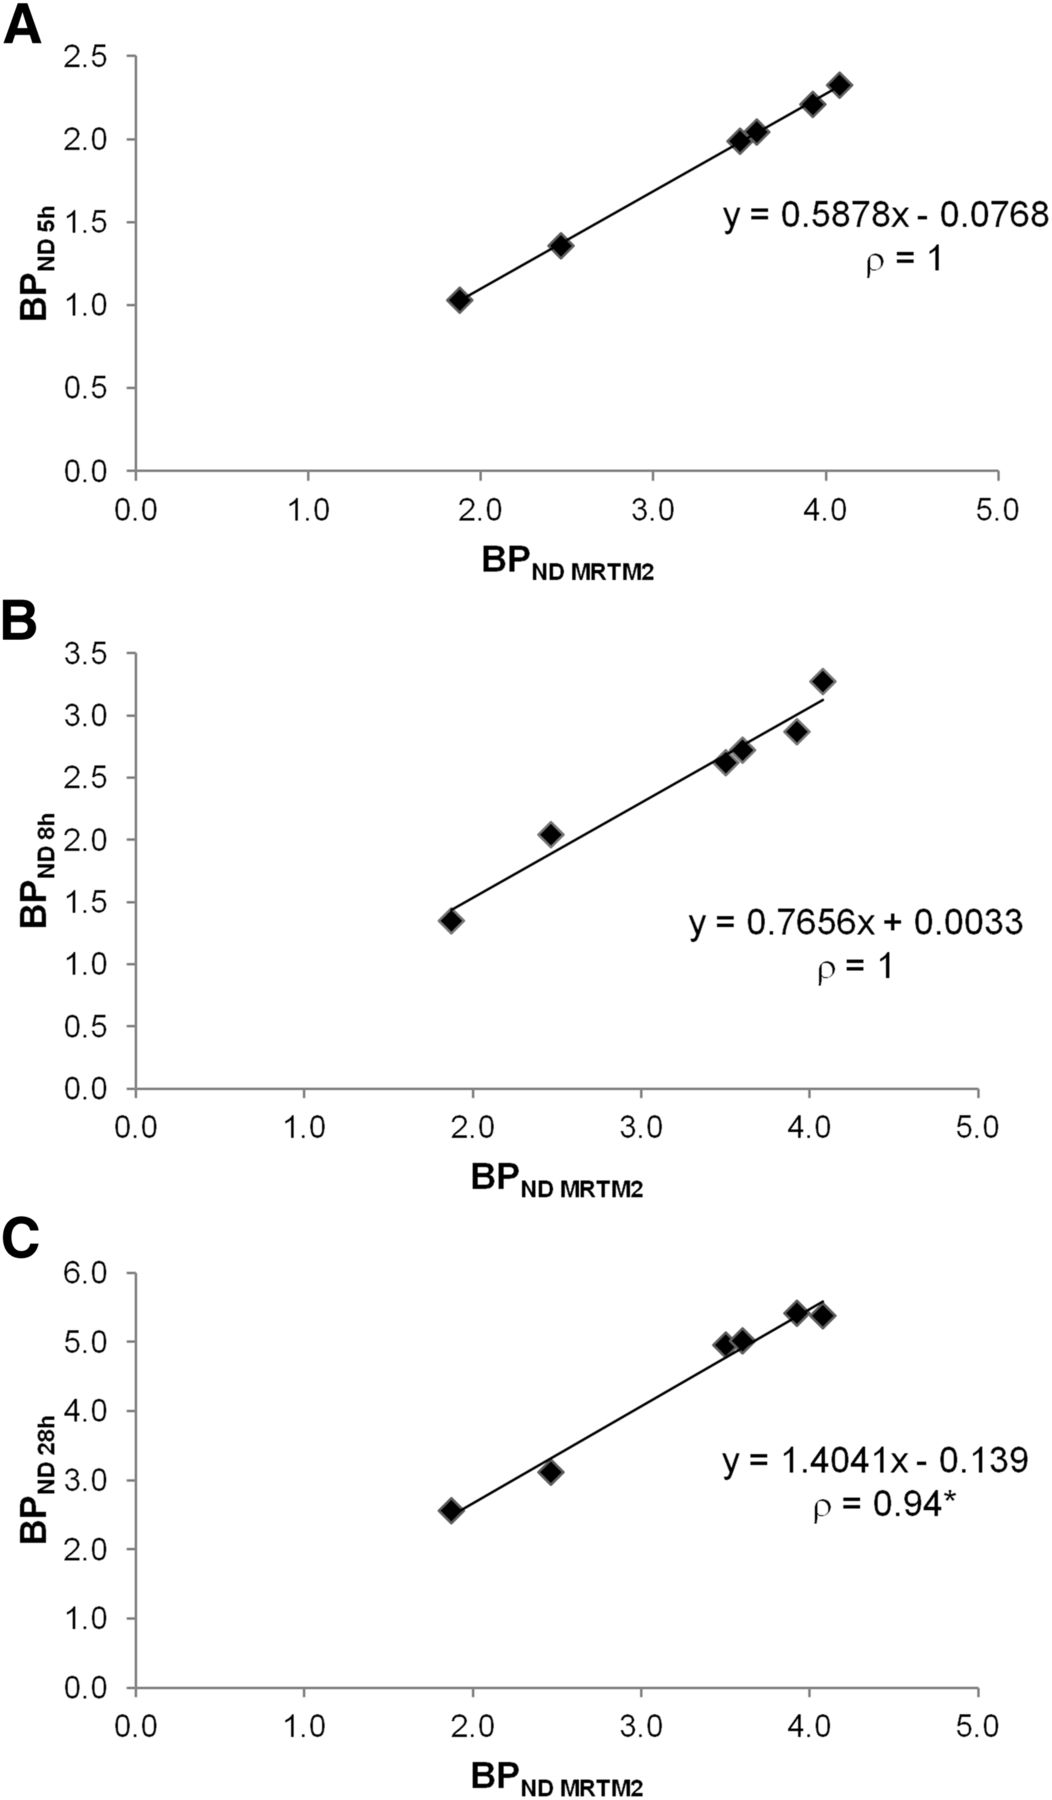
A correlation study with the Spearman test was performed between BPND evaluated with MRTM2 and BPND evaluated with the simplified analyses at 5, 8, and 28 h after injection (Fig. 5). Highly significant correlations (ρ = 1) were shown between BPND-5 h and BPND-MRTM2 (A) and between BPND-8 h and BPND-MRTM2, and a significant, though less powerful (ρ = 0.94, P = 0.005), correlation was found between BPND-28 h and BPND-MRTM2 (C).

Correlation study in striatum between BPND values calculated using MRTM2 and those calculated using static analysis at 5 h (A), 8 h (B), and 28 h (C). *Statistically significant (Spearman, P = 0.005).
DISCUSSION
Until now, the noninvasive method used to quantify 123I-iodobenzovesamicol consisted of a dynamic SPECT acquisition comprising 5 scans acquired until 7 h after injection, coupled with a postprocessing MRTM2 kinetic analysis based on the use of the occipital cortex as the reference region (9). In the present study, an alternative simplified 123I-iodobenzovesamicol method based on the use of a single static acquisition was evaluated. To this end, the SPECT dynamic acquisition was extended until 28 h after injection, and several acquisition times were compared to determine the most suitable single static acquisition providing a simplified 123I-iodobenzovesamicol quantification without deteriorating the quantitative accuracy. The most important finding of the present study was that a single acquisition is able to provide a useful index for 123I-iodobenzovesamicol quantification. This result confirms the hypothesis stated previously that a simplified acquisition protocol is routinely usable in clinical practice to quantify 123I-iodobenzovesamicol (9).
In the first step of this methodologic work, the choice of the occipital cortex as the reference region to quantify 123I-iodobenzovesamicol to VAChT BPND was reconsidered. Indeed, in some neurodegenerative diseases, especially in dementia with Lewy bodies, characterized by occipital hypoperfusion and hypometabolism (17), tracer delivery in the occipital cortex may be different from that in healthy subjects, leading to errors in the calculation of BPND values in the remaining brain regions. Recently, the use of the cerebellum as the reference region for quantification of 123I-iodobenzovesamicol SPECT data has been validated using an arterial input function (10). Furthermore, a recent study using a novel PET VAChT radiotracer has shown in healthy subjects similar levels of binding in the visual cortex and cerebellum as well as a differential cholinergic innervation within the cerebellum between the vermal region and the cerebellar hemispheres (11). This result challenges the statement that, from a cholinergic point of view, the occipital cortex is the most sparsely innervated region in the human brain. For this reason, in the present study, the cerebellar vermis was manually delineated and separated from the rest of the cerebellum. Consequently, 123I-iodobenzovesamicol uptake was found to be higher in the vermis than in the cerebellar hemispheres and of the same magnitude when the superior occipital cortex and the cerebellar hemispheres were compared (Figs. 1B and 2). This result clearly demonstrates that 123I-iodobenzovesamicol is a suitable tracer to evidence a differential cholinergic innervation within the cerebellum. Moreover, with levels of tracer concentration comparable to those observed in the occipital cortex, the cerebellar hemispheres can reasonably be chosen as the reference region for 123I-iodobenzovesamicol quantification, especially in patients with dementia with Lewy bodies. In this study, the choice of the cerebellar hemispheres as the reference region provided regional BPND values concordant with the known densities of cholinergic sites in the brain (18), high uptake levels being observed in the striatum, intermediate in the thalamus and cerebellar vermis, and low in the cortex.
The finding that the specific binding curve of 123I-iodobenzovesamicol increases up to 6 h after injection in the striatum (Fig. 1B) is in line with our previous study in this region, suggesting a necessary extension of the SPECT acquisition beyond 6 h to reach the peak equilibrium time (9). The underestimation of BPND-8 h and the overestimation of BPND-28 h allow us to assume that equilibrium in the striatum is reached between 8 and 28 h after injection, reflecting the high expression of VAChT in this region. In contrast, brain regions with moderate to low cholinergic innervation, including the reference region of the cerebellar hemispheres, showed rapid and constant tracer clearance from 2 to 28 h after injection, demonstrating that maximum uptake is reached earlier in extrastriatal regions than in the striatum. These differences in tracer kinetics between regions with high and low cholinergic innervation are in line with our previous study, stating that the kinetics of the radiotracer concentration in the reference region and the free and nonspecifically bound radiotracer concentration in tissue were different (9).
As a consequence of such interregional variations of 123I-iodobenzovesamicol radiotracer kinetics, BPND-28 h is overestimated in several regions comparatively to BPND-5 h, BPND-8 h, and BPND-MRTM2 (Figs. 3–5; Tables 1 and 2). At first glance, such results argue against the possibility of performing an accurate quantification of 123I-iodobenzovesamicol at 28 h after injection. However, a couple of points are noteworthy concerning a 123I-iodobenzovesamicol single acquisition at 28 h. First, a highly significant correlation was found between BPND-28 h and BPND-MRTM2 (Fig. 4D). Second, an acceptable—though less powerful—correlation (ρ = 0.86, P < 0.05; data not shown) was found between BPND-28 h and k3 values calculated by Kuhl et al. with arterial blood sampling (14).
The overestimation of the BPND values, observed when a simplified analysis is performed at the late time of 28 h after injection, is strongly attenuated when the analysis is conducted at earlier times, representing the main result of the present study. Indeed, no significant difference was found between BPND-5 h, BPND-8 h, and BPND-MRTM2 in any extrastriatal region explored (Fig. 3), providing evidence that a simplified and accurate analysis is feasible at early times. In Figure 4, the correlation study performed among BPND-MRTM2 and BPND-5 h, BPND-8 h, and BPND-28 h shows the highest ρ value for a static analysis at 5 h. Furthermore, on the basis of the equations of the regression lines, the proposed simplified method provides reasonably accurate BPND values at the 5-h time point (Fig. 4B) and overestimated BPND values at the 8- and 28-h time points (Figs. 4C and 4D), suggesting that overestimation increases with time. Thus, with the higher correlation and an acceptable accuracy, this result confirms that 5 h after injection is the most suitable acquisition time to perform accurate 123I-iodobenzovesamicol quantification in extrastriatal regions.
As far as the striatum is concerned, the significant correlations found for the 3 imaging times (Fig. 5) demonstrate the feasibility of a simplified quantification. However, our results do not allow for a conclusion on the most appropriate time to accurately quantify 123I-iodobenzovesamicol. Indeed, an underestimation of −43.6% and −23.3% was observed at 5 and 8 h, respectively, after injection, whereas an overestimation of +36.1% was found at 28 h after injection (Table 2). Slopes of the regression lines presented in Figure 5 confirm these results. These findings suggest that the most appropriate time to perform an accurate simplified quantification in the striatum is likely to be a few hours beyond 8 h, in accordance with the specific binding curve in Figure 1B.
CONCLUSION
In the extrastriatal regions, a single acquisition at 5 or 8 h after injection provides quantitative results similar to a pharmacokinetic analysis, whereas acquisition at 28 h tends to give higher results. Our study demonstrated that 5 h is the most appropriate time to perform an accurate, simplified quantification of 123I-iodobenzovesamicol. Although less relevant from a practical point of view, 8 h remains a valuable time, whereas 28 h is less accurate. In the striatum, the region richest in cholinergic neurons, none of the 3 studied times has enabled an accurate quantification, probably because equilibrium is reached between 8 and 28 h after injection. Future work is needed to determine the appropriate time to acquire images between 8 h and 28 h after injection.
DISCLOSURE
The costs of publication of this article were defrayed in part by the payment of page charges. Therefore, and solely to indicate this fact, this article is hereby marked “advertisement” in accordance with 18 USC section 1734. This study was supported by Eisai Pharmaceuticals. No potential conflict of interest relevant to this article was reported.
Footnotes
Published online Apr. 23, 2015.
- © 2015 by the Society of Nuclear Medicine and Molecular Imaging, Inc.
REFERENCES
- Received for publication August 8, 2014.
- Accepted for publication April 6, 2015.


