


Abstract
18F-(E)-N-(3-iodoprop-2-enyl)-2β-carbofluoroethoxy-3β-(4′-methyl-phenyl) nortropane (18F-FE-PE2I) is a recently developed radioligand for the in vivo quantification of the dopamine transporter (DAT) in the striatum and substantia nigra (SN). The aim of this study was to examine the suitability of 18F-FE-PE2I as a tool for imaging the nigrostriatal pathway in Parkinson disease (PD) with PET. Methods: Ten PD patients (9 men and 1 woman; mean age ± SD, 60 ± 9 y; Hoehn and Yahr, 1–2; Unified Parkinson Disease Rating Scale motor, 18.9 ± 6.7) and 10 controls (9 men and 1 woman; mean age ± SD, 60 ± 7 y) were included. PET measurements with 18F-FE-PE2I were conducted for 93 min using the High-Resolution Research Tomograph. Venous blood was drawn to compare protein binding, parent fraction, and radiometabolite composition in PD patients and controls. Regions of interest for the caudate, putamen, ventral striatum, SN, and cerebellum were drawn on coregistered MR images. The outcome measure was the binding potential (BPND) estimated with the simplified reference tissue model and the Logan graphical analysis, using the cerebellum as a reference region. Time stability of BPND was examined to define the shortest acquisition protocol for quantitative studies. The wavelet-aided parametric imaging method was used to obtain high-resolution BPND images to compare DAT availability in the striatum and SN in PD patients and control subjects. Group differences were assessed with the unpaired t test (P < 0.05). Results: Parent, radiometabolite fractions, plasma concentration, and cerebellar uptake of 18F-FE-PE2I did not differ significantly between PD patients and controls. Stable estimates of BPND (<8% of the 93-min value) were obtained with the simplified reference tissue model using approximately 66 min of data. BPND values in PD patients were significantly lower than those in controls (P < 0.05) in the caudate (2.54 ± 0.79 vs. 3.68 ± 0.56), putamen (1.39 ± 1.04 vs. 4.41 ± 0.54), ventral striatum (2.26 ± 0.93 vs. 3.30 ± 0.46), and SN (0.46 ± 0.20 vs. 0.68 ± 0.15). Conclusion: 18F-FE-PE2I is clearly a suitable radioligand for DAT quantification and imaging of the nigrostriatal pathway in PD. Similar metabolism in controls and PD patients, suitability of the cerebellum as a reference region, and accuracy of quantification using approximately 66 min of PET data are advantages for noninvasive and simplified imaging protocols for PD studies. Finally, DAT loss in PD can be measured in both the striatum and the SN, supporting the utility of 18F-FE-PE2I as an imaging tool of the nigrostriatal pathway.
The dopamine transporter (DAT) is a presynaptic membrane protein having a major role in the regulation of extracellular dopamine levels. DAT is highly enriched in nigrostriatal axons and terminals whereas the density is lower in cell bodies and dendrites of the substantia nigra (SN) (1,2). Several neurodegenerative and neuropsychiatric disorders are associated with dysregulations of presynaptic dopaminergic activities and alterations of the dopamine homeostasis (3–8). In Parkinson disease (PD), the DAT is a useful biomarker to understand the relationship between early dopaminergic dysfunction and clinical manifestation (9,10). A loss-of-function mutation in the SLC6A3 gene, which encodes for DAT, is responsible for a rare form of parkinsonism and dystonia (11). In addition, the pathologic process in idiopathic PD and related movement disorders is characterized by accumulation of α-synuclein within the nigrostriatal pathways. Finally, reduced levels of DAT indirectly reflect degeneration of nigrostriatal neurons (12–15). Over the years, several radioligands have been developed for PET imaging of the DAT, although only a few of them qualify for broad clinical application based on possible radiolabeling with 18F and optimal kinetic properties (16). An important requisite to consider is also the capability to quantify the DAT in the SN, the region in which the cell bodies of the dopaminergic neurons are located. Imaging of the nigrostriatal pathway (DAT in SN and striatum) might contribute to a better understanding of the relationship between dopaminergic dysfunction and clinical manifestations in PD and also serve as an imaging marker for clinical applications.
18F-(E)-N-(3-iodoprop-2-enyl)-2β-carbofluoroethoxhy-3β-(4′-methylphenyl) nortropane (18F-FE-PE2I) is a recently developed radioligand with suitable affinity for DAT (Ki = 12 nM) and low affinity for other monaminergic transporters (17,18). In nonhuman primates, 18F-FE-PE2I displays a high target-to-background ratio, fast washout from the brain, early peak equilibrium, and a favorable metabolic profile (17–20). In addition, initial studies in healthy subjects have shown that the quantification of 18F-FE-PE2I binding to the DAT can be accurately and reliably performed using the simplified reference tissue model (SRTM) with the cerebellum as a reference region (21,22). The aim of this study was to examine the suitability of 18F-FE-PE2I as a tool for imaging the nigrostriatal pathway in PD. To examine the suitability of noninvasive and simplified quantification, we compared the metabolism of 18F-FE-PE2I in PD patients and controls and examined the shortest time of imaging that provides stable estimates of binding potential (BPND). To examine regional differences of DAT availability in the striatum and SN between controls and PD patients, we used BPND images obtained with the wavelet-aided–based parametric imaging method (WAPI).
MATERIALS AND METHODS
Subjects
The study was approved by the Ethics Committee of the Stockholm Region and by the Radiation Safety Committee of the Karolinska University Hospital, Solna, Stockholm, Sweden. Written consent was obtained from each subject after detailed explanation of the study procedures. Ten control subjects were included (Table 1). They were recruited by advertisement in a local newspaper and were healthy according to medical and psychiatric history, physical examination, blood chemistry, electrocardiogram, and MR imaging of the brain. The control subjects were matched by age and sex to 10 PD patients recruited at the Movement Disorder Clinic of the Karolinska University Hospital, Huddinge, Stockholm, Sweden (Table 1). All patients satisfied the clinical diagnosis of PD according to the U.K. Parkinson Disease Society Brain Bank diagnostic criteria (23). Patients were evaluated clinically during a drug on-state with the Hoehn and Yahr (H&Y) staging and the Unified Parkinson Disease Rating Scale (UPDRS) (Supplemental Appendix; supplemental materials are available at http://jnm.snmjournals.org). None of the subjects had any psychiatric axis I condition according to the criteria defined by the Structured Clinical Interview for the Diagnostic and Statistical Manual of Mental Disorders (24).
Demographic and Clinical Data of Control Subjects (S01–S10) and PD Patients (P1–P10)
PET Experimental Procedures
18F-FE-PE2I was prepared via nucleophilic radiofluorination of its tosylate precursor (25). After purification and isolation, 18F-FE-PE2I was formulated in a solution of ethanol (10%) in physiologically buffered saline before final sterilization by filtration (0.22 mm; Millex GV filter [Millipore]). Specific radioactivity at the time of injection was 129 ± 47 GBq/μmol in control subjects and 179 ± 124 GBq/μmol in PD patients. The injected radioactivity was 208 ± 11 MBq in control subjects and 198 ± 19 MBq in PD patients, and the injected mass was 0.85 ± 0.4 and 0.74 ± 0.5, respectively. PET measurements of 93 min were performed using the High Resolution Research Tomograph (HRRT) system (Siemens Medical Solutions) (Supplemental Appendix). MR imaging scans of all participants were obtained on a 3-T unit (Discovery MR750; GE Healthcare) at the Karolinska University Hospital as part of the subjects’ evaluation and to delineate anatomic brain regions of interest (ROIs) (Fig. 1). Three-dimensional T1-weighted images (156 slices with 1.0 mm of thickness) were obtained for coregistration with PET images and for ROI analysis (Supplemental Appendix). Radiometabolite analysis and measurement of protein binding were performed in all subjects. Venous blood samples were collected to measure the plasma concentration of 18F-FE-PE2I in control subjects and PD patients. Blood samples (2–3 mL) were drawn at 1, 3, 5, 10, 20, 30, 45, 60, 75, and 90 min and centrifuged at 2,000g for 2–4 min at room temperature to separate plasma (0.7–1.5 mL). Blood and plasma samples were counted in a NaI well counter (18). Plasma proteins were denatured by the addition of a 1.4× volume of acetonitrile. After being stirred in a vortex mixer, the samples were centrifuged at 2,000g for 4 min at room temperature and 2–3 mL of water were added to the supernatant plasma–acetonitrile mixture, which was then injected into a radio–high-performance liquid chromatography (HPLC) system (26). Separation was performed on an XBridge C18 column (Waters; 50 × 10 mm interior diameter, 2.5 μm + guard 10 × 10 mm interior diameter, 5 μm) at a flow rate of 6 mL/min. The mobile phase consisted of (A) 0.1% formic acid in water and (B) 0.1% formic acid in acetonitrile. The elution profile used started from 15% B and continued isocratic for 4 min and then reached 40% B after 8 min and 70% B after 9 min. Peaks corresponding to radioactive compounds eluting from the column were integrated, and their areas were expressed as a percentage of the sum of the areas of all detected radioactive compounds (decay-corrected to the time of injection on the HPLC). The free fraction (fp) of 18F-FE-PE2I in plasma was estimated using an ultrafiltration method (Supplemental Appendix).
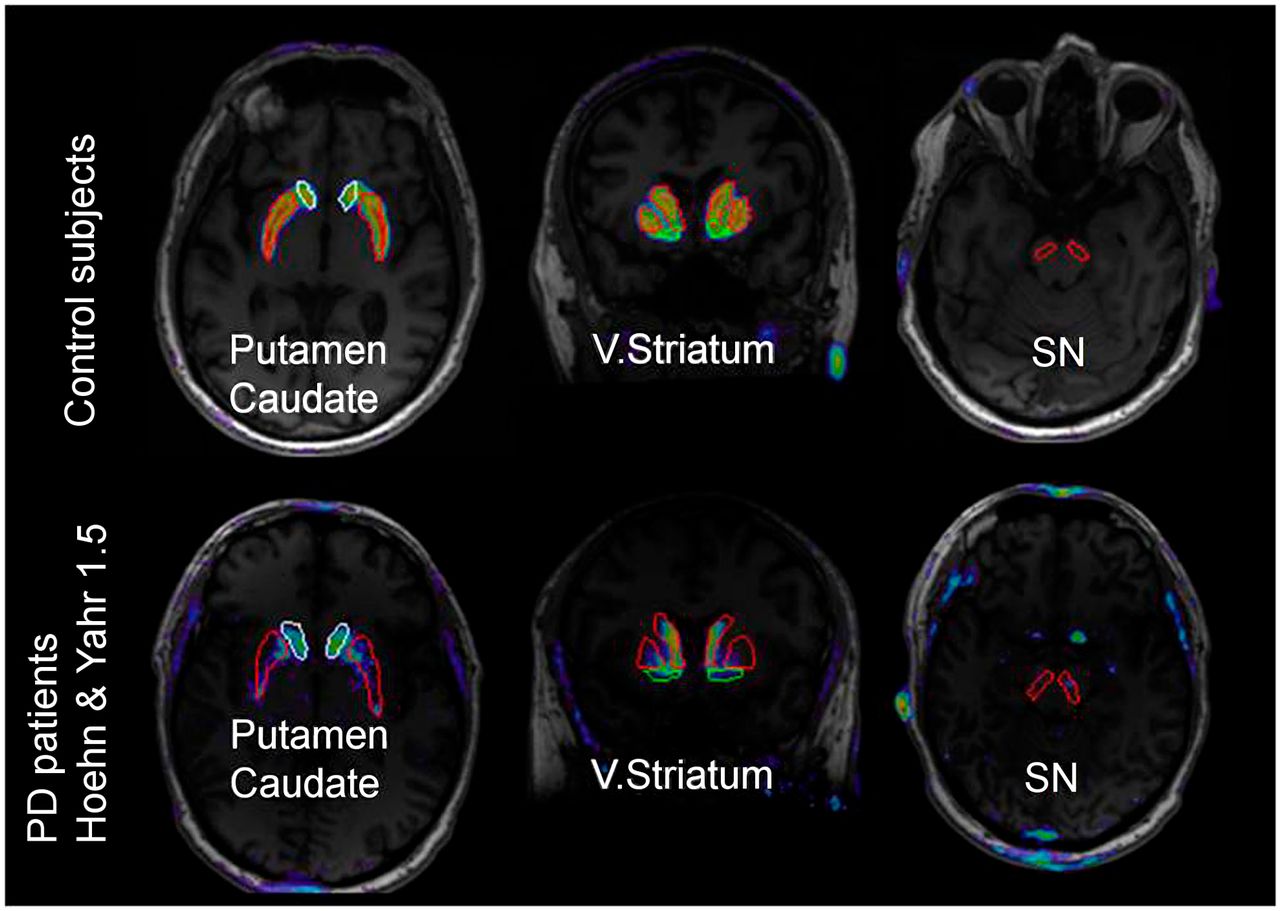
ROIs (caudate, putamen, ventral striatum, and SN) overlaid on MR–PET images in control subject and PD patient. V. = ventral.
DAT Quantification
PET data were analyzed with SRTM (27) and Logan graphical analysis (LoganRef) (28) using the cerebellum as a reference region. The outcome measure was BPND. To validate the use of the cerebellum as a reference region for the quantitative analysis in PD, we compared the apparent distribution volume (VT AUC ratio) in the cerebellum in both groups. VT AUC ratio was defined as the ratio between the area-under-the-time–activity-curve (AUC) of the cerebellum and the AUC of the radioactivity concentration of 18F-FE-PE2I in venous plasma between 3 and 90 min. SRTM was considered the method of reference, based on previous validation work (20,21). The estimation of BPND with LoganRef was performed using the k2′ estimated with SRTM for each region (20). The last 11 points of the linear plot were used to fit the data (t* = 33 min). The time of equilibrium, t*, was selected according to the time after which changes in slope of less than 10% were observed for all ROIs. Time stability of BPND was examined by removing each time point from 93 to 36 min and refitting the data with the initial parameters. For each time point, BPND was expressed as percentage of the value estimated using 93 min of analysis. The quantitative analyses were performed with the software PMOD (version 3.3; PMOD Group).
Parametric images were generated using the WAPI software (29) with optimized parameters as previously reported (30). Voxel-based BPND estimation was obtained using LoganRef (t* = 33 min) and the cerebellum as a reference region. The manually delineated ROIs were projected on the parametric images using the MR imaging–PET transformation matrix to measure the average regional BPND (Fig. 1). Voxel-based BPND values estimated with parametric imaging were compared with ROI-based BPND values estimated with SRTM and LoganRef.
Statistical Analysis
Differences between groups were assessed with the unpaired, 2-tailed t test (P < 0.05). Linear regression analysis and Pearson r were used to assess correlations between BPND values estimated with SRTM and BPND values estimated with LoganRef, and between voxel-based BPND values estimated with parametric imaging and ROI-based BPND values estimated with SRTM and with LoganRef. Differences of BPND between controls and PD patients were evaluated with the unpaired, 2-tailed t test (P < 0.05 with Bonferroni correction for the 4 ROIs). Correlation between the BPND of 18F-FE-PE2I and clinical variables (disease duration, H&Y stage, and UPDRS motor) was performed with a multiple regression analysis using a backward approach. BPND was set as a dependent variable and clinical variables as predictors. Standardized coefficients (Beta) were reported for significant models and predictors. The software SPSS (version 22; IBM) was used.
RESULTS
All subjects participated in the study according to the protocol. There were no statistically significant differences between PD patients and controls in age, weight, years of education, and Mini-Mental State Examination (Table 1). Although the Montgomery–Åsberg Depression Ratings Scale scores did not differ significantly between the 2 groups, the Beck Depression Inventory scores were significantly higher in PD patients than in control subjects (Table 1), most likely because of the higher prevalence in PD patients of mood-related symptoms, such as fatigue and lack of energy.
Radiometabolite Analysis and Protein Binding
After intravenous injection of 18F-FE-PE2I, the radioligand was rapidly metabolized both in controls and in PD patients. At 20 min, the unchanged radioligand in plasma corresponded to 23% of total radioactivity in control subjects and to 26% in PD patients. This percentage decreased to 11% in controls and to 14% in PD patients at 60 min after injection (Fig. 2). The HPLC analysis of the plasma samples collected after the injection of 18F-FE-PE2I revealed the presence of radiometabolite peaks, among which 2 have been identified previously (31). 18F-FE-PE2I-CH2OH (retention time, 3.7) represented less than 2% and 18F-FE-PE2I-COOH (retention time, 4.4) less than 13% of the plasma radioactivity at 60 min after injection (Supplemental Figs. 1 and 2). There was no statistically significant difference in the fraction of the 2 radiometabolites in plasma between control subjects and PD patients. The fp of 18F-FE-PE2I was 1.5% ± 1.5% in controls and 1.4% ± 1.1% in PD patients.
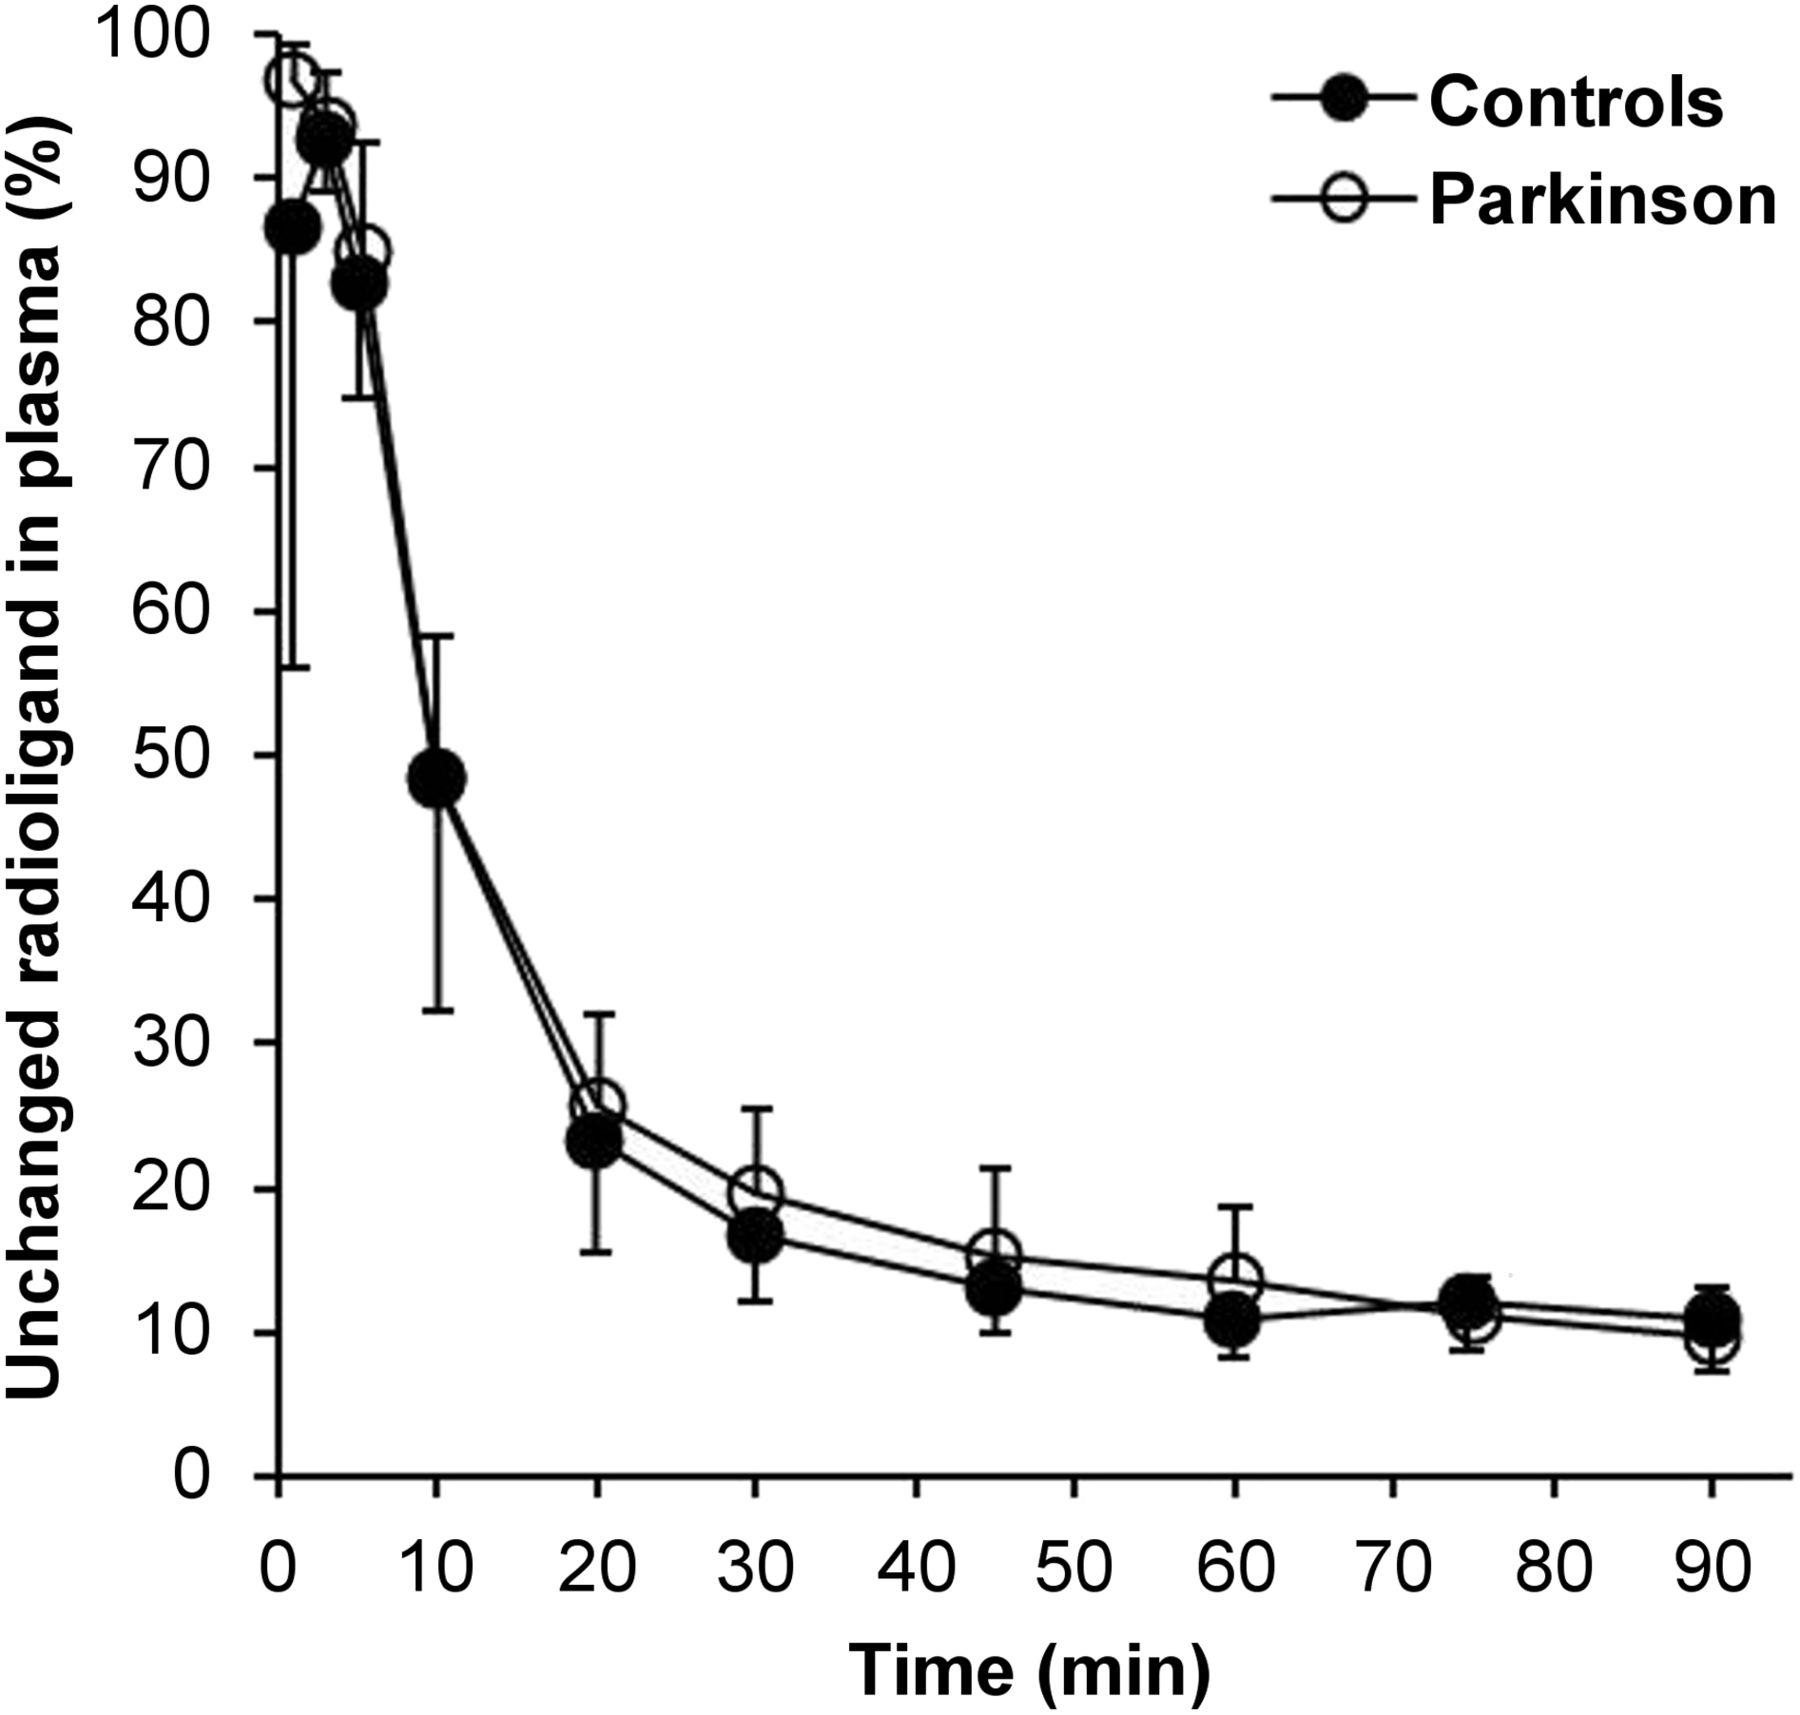
Average unchanged radioligand in plasma of PD patients and controls. Mean ± SD.
Evaluation of DAT Availability In Vivo with 18F-FE-PE2I
The regional brain uptake of 18F-FE-PE2I was lower in PD patients than in control subjects in the caudate, putamen, ventral striatum, and, to some extent, also in SN (Fig. 3). The AUC of the cerebellar time–activity curve (Fig. 3) was 117.5 ± 13.2 standardized uptake value × min in control subjects and 127.2 ± 13.7 standardized uptake value × min in PD patients (not significant). No significant difference in the VT AUC ratio of the cerebellum was found between controls (5.6 ± 2) and PD patients (5.8 ± 2). A statistically significant correlation was found between BPND obtained with LoganRef and SRTM (Fig. 4). Stable estimates of BPND with SRTM (<8% of BPND measured at 93 min, SD < 8%) were obtained using the first 66 min of the time–activity curves for both PD patients and control subjects. In PD patients, LoganRef BPND estimates at 66 min were less stable in the SN (Supplemental Fig. 3). Moreover a statistically significant correlation between voxel-based BPND and ROI-based BPND was observed (Fig. 5; Supplemental Fig. 4). BPND images of 18F-FE-PE2I (Fig. 6) displayed a distribution of binding in the striatum and the mid brain, consistent with the known anatomic distribution of DAT (32). A clear delineation of caudate, putamen, and SN was visible. Furthermore, coronal images enabled also the visualization of the DAT along the nigrostriatal tracts (Fig. 6). In early-PD patients, an asymmetric reduction of DAT availability was found mainly in the putamen, followed by the caudate, ventral striatum, and SN (Fig. 6; Supplemental Appendix). The BPND was significantly lower in PD patients than in controls (P < 0.05) in the caudate (2.54 ± 0.79 vs. 3.68 ± 0.56), putamen (1.39 ± 1.04 vs. 4.41 ± 0.54), ventral striatum (2.26 ± 0.93 vs. 3.30 ± 0.46), and SN (0.46 ± 0.20 vs. 0.68 ± 0.15) (Fig. 7).

Regional standardized uptake values (SUV) time–activity curves of 18F-FE-PE2I (mean value) in PD patients and control subjects (CS).
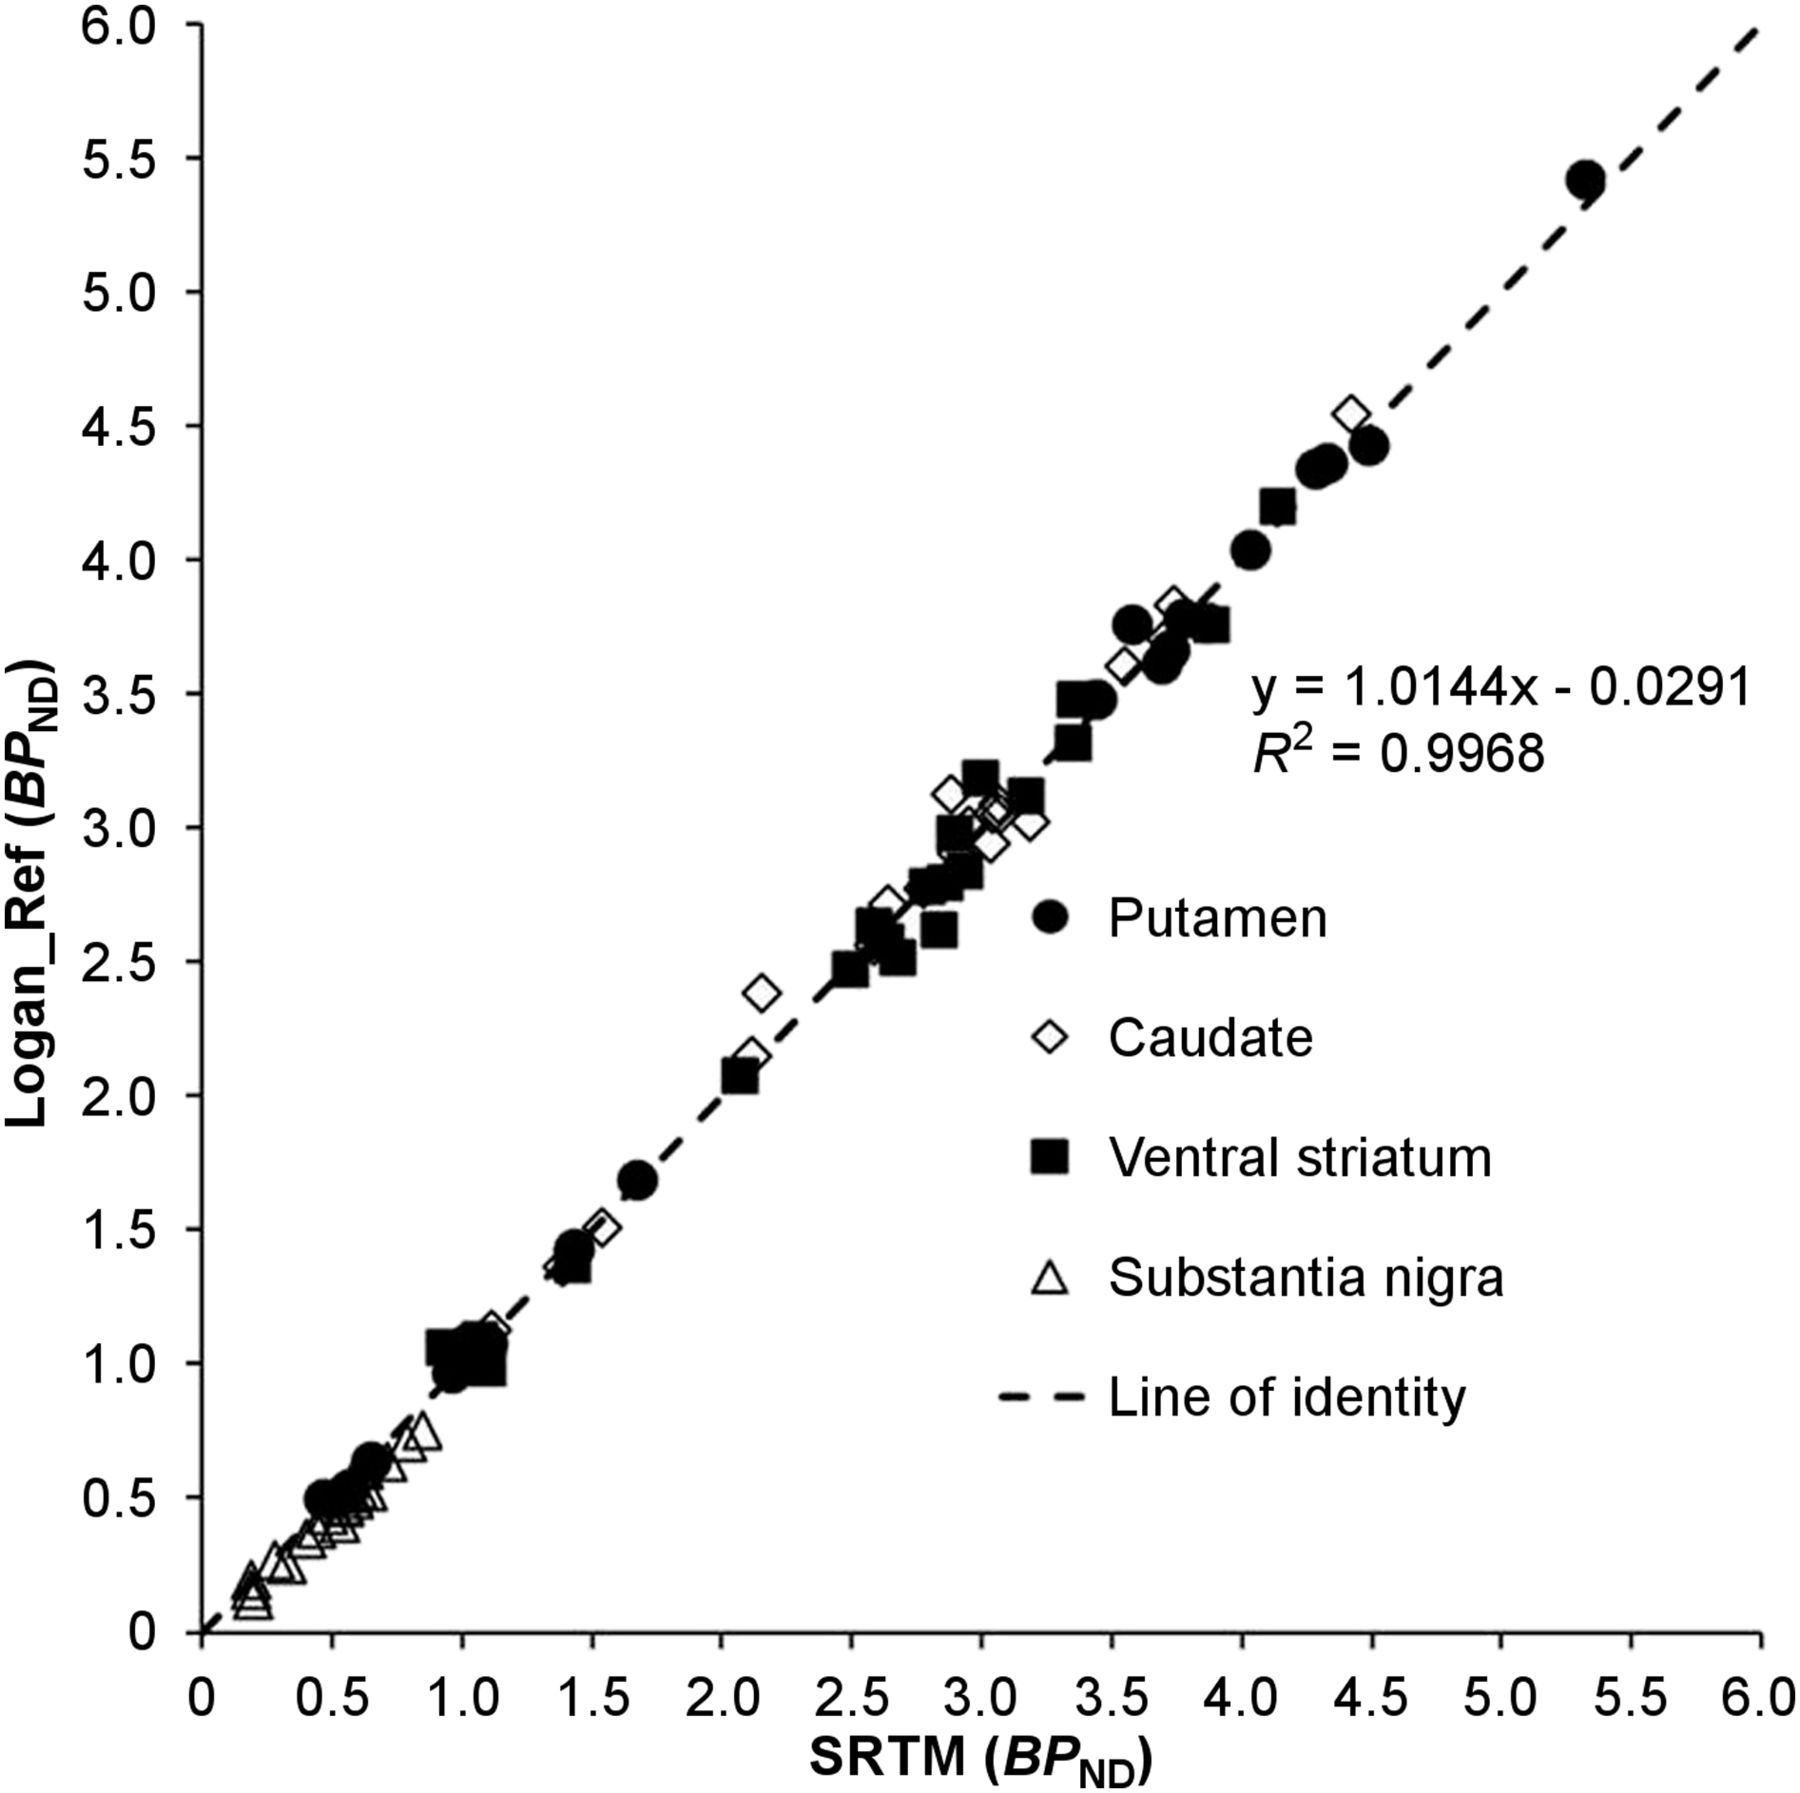
Correlation of BPND estimated with SRTM and LoganRef. Each data point represents BPND values of each subject (Supplemental Table 1 provides mean and SD).

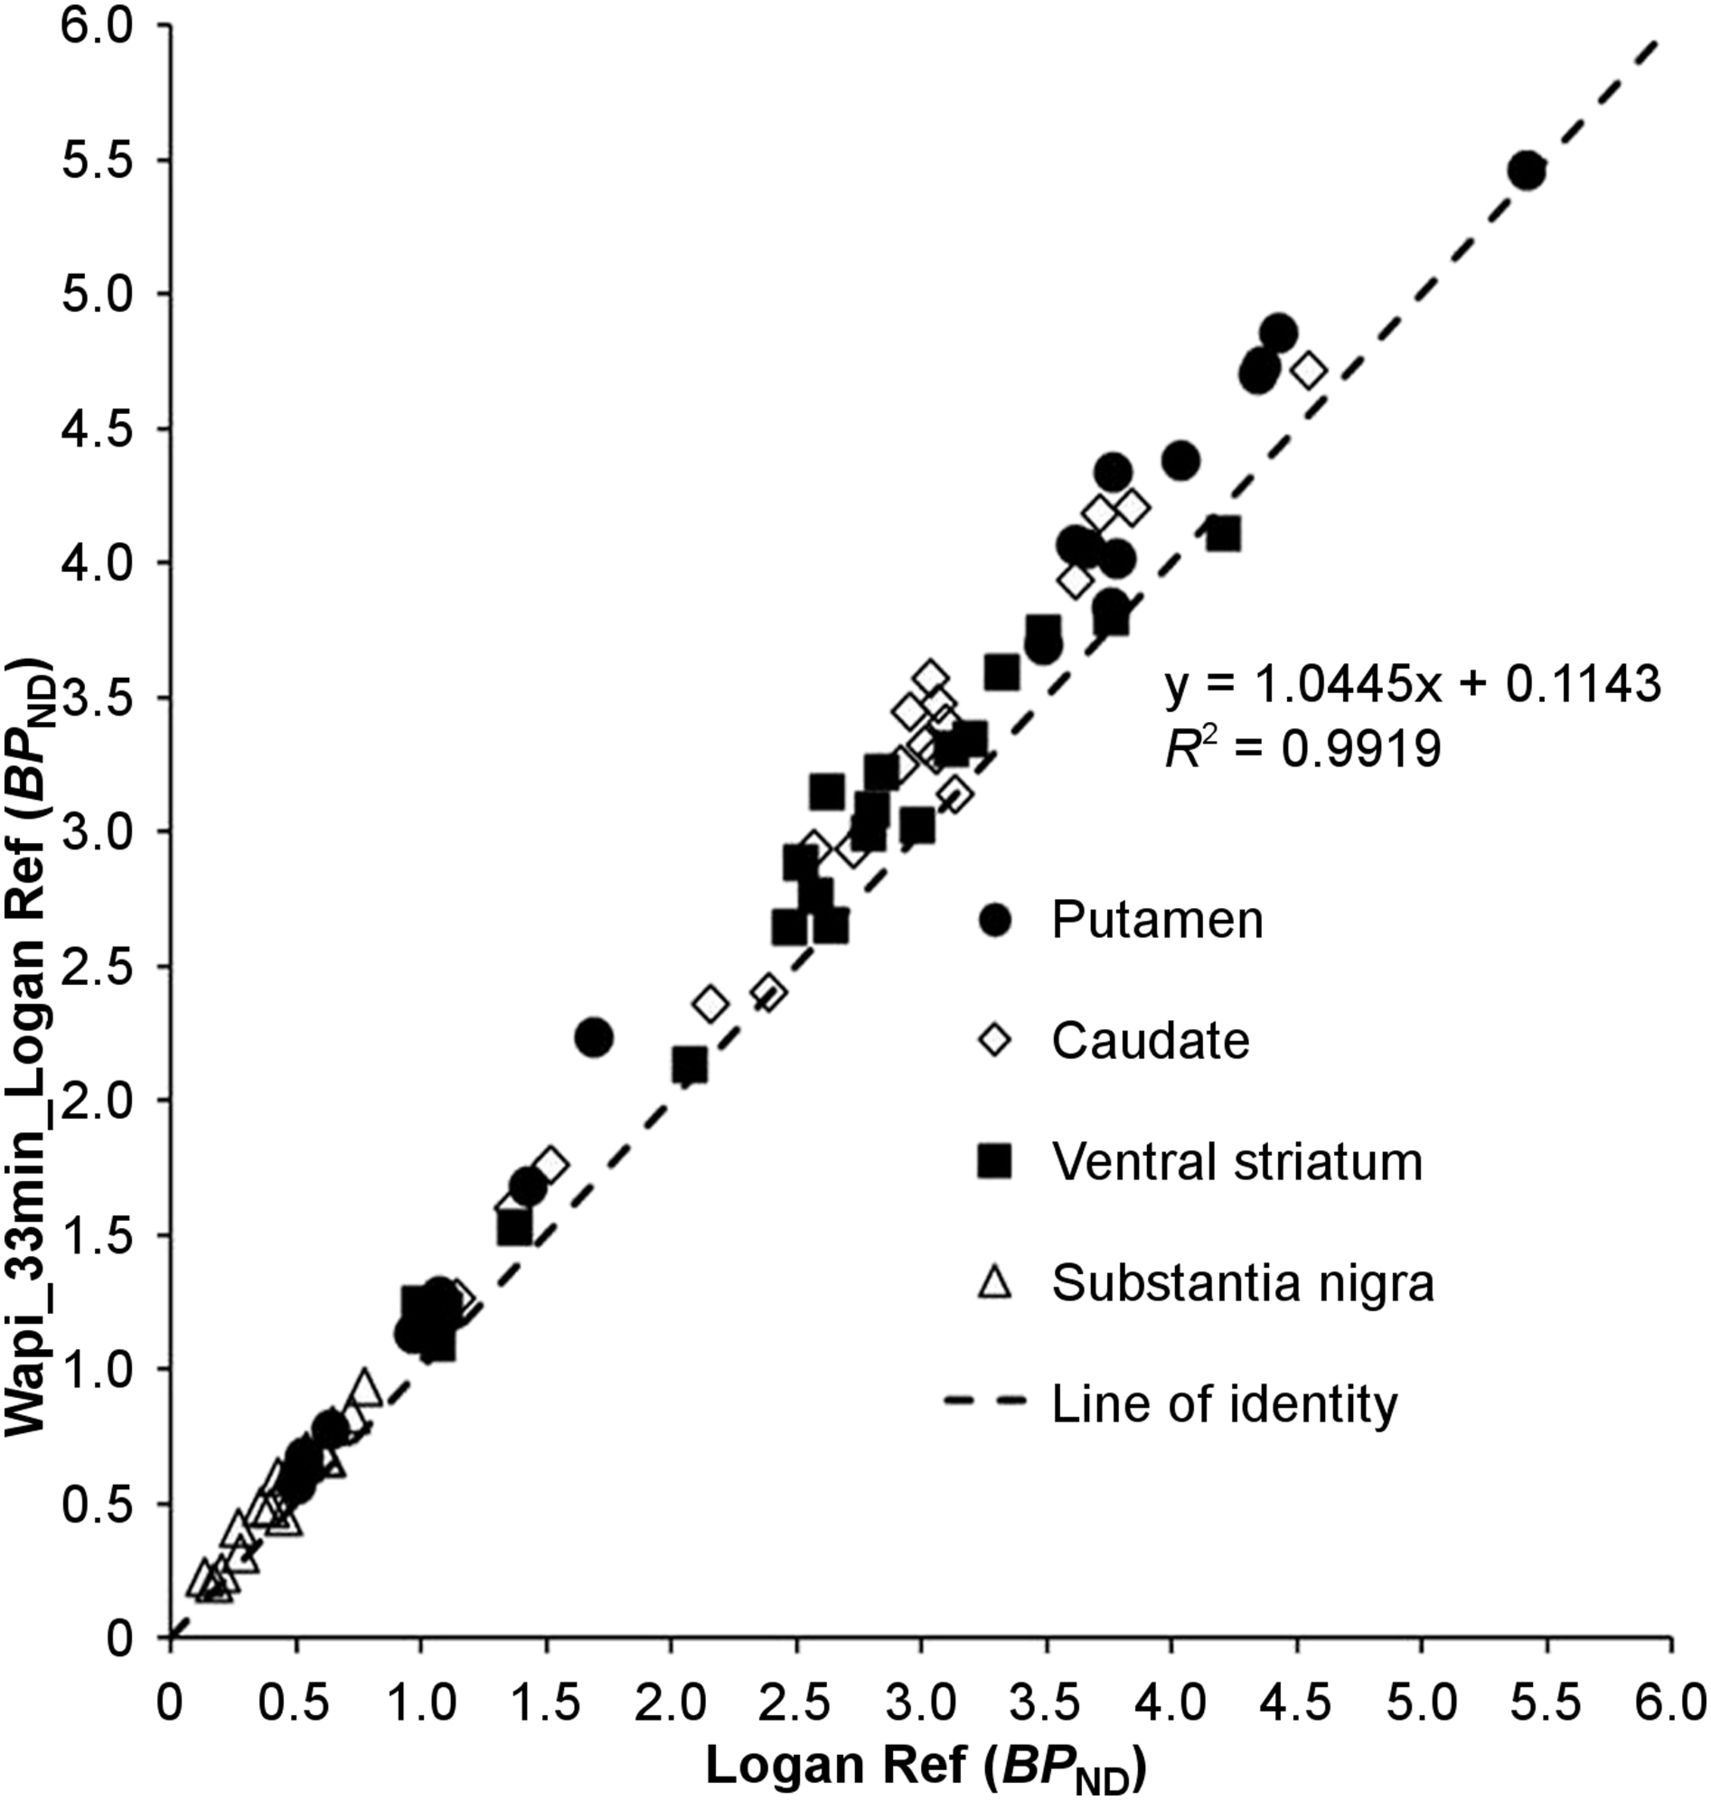
Correlation of BPND estimated with WAPI (Wapi_33 min_Logan Ref) and estimated with Logan Ref. Each data point represents BPND values of each subject.

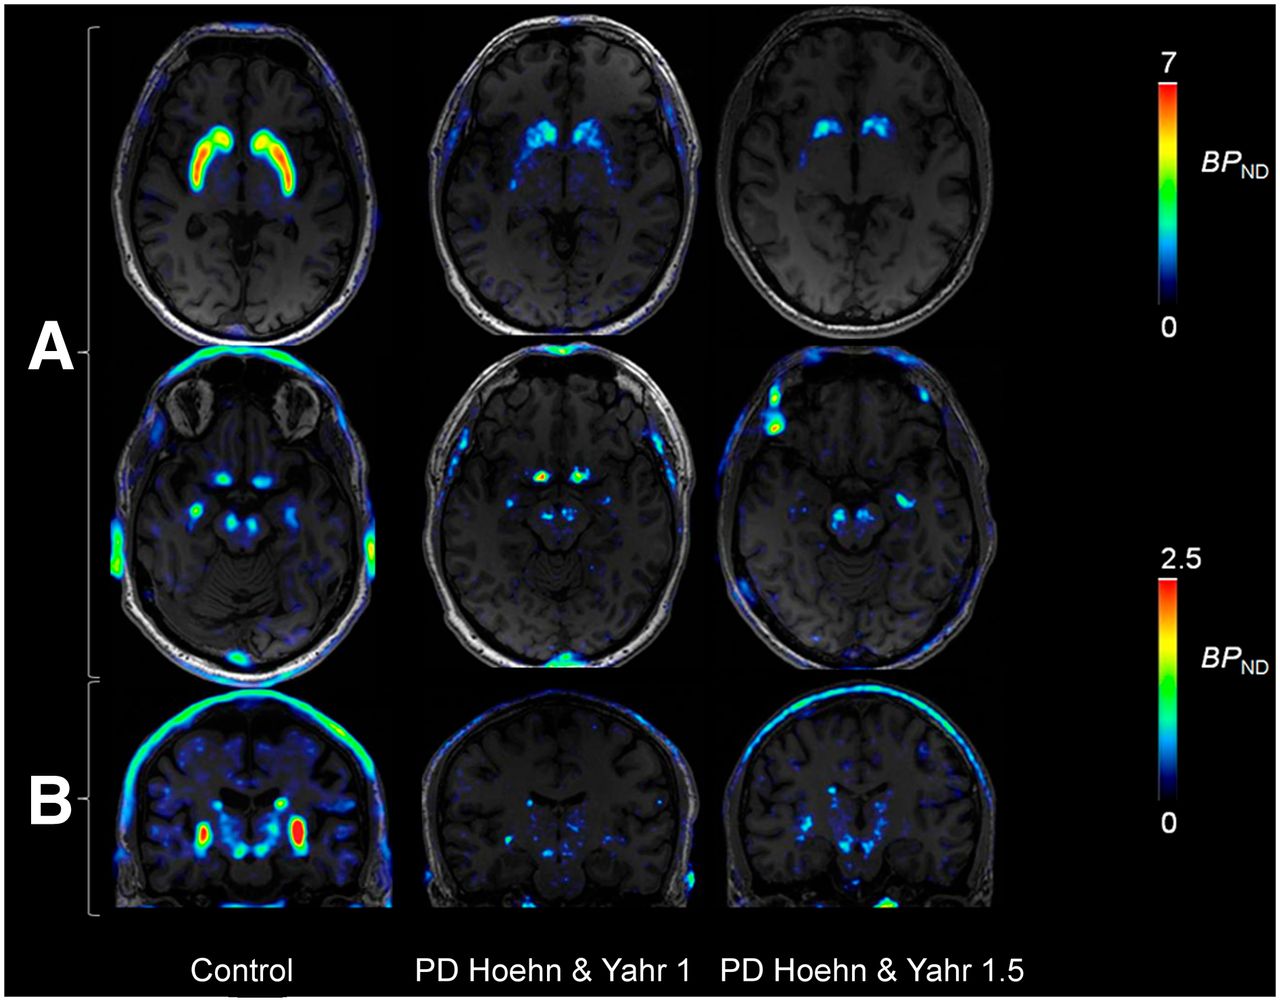
WAPI in control subject and 2 patients with PD at H&Y stage 1 and 1.5. Images are at level of basal ganglia (A), substantia nigra, and mid-brain coronal view (B).
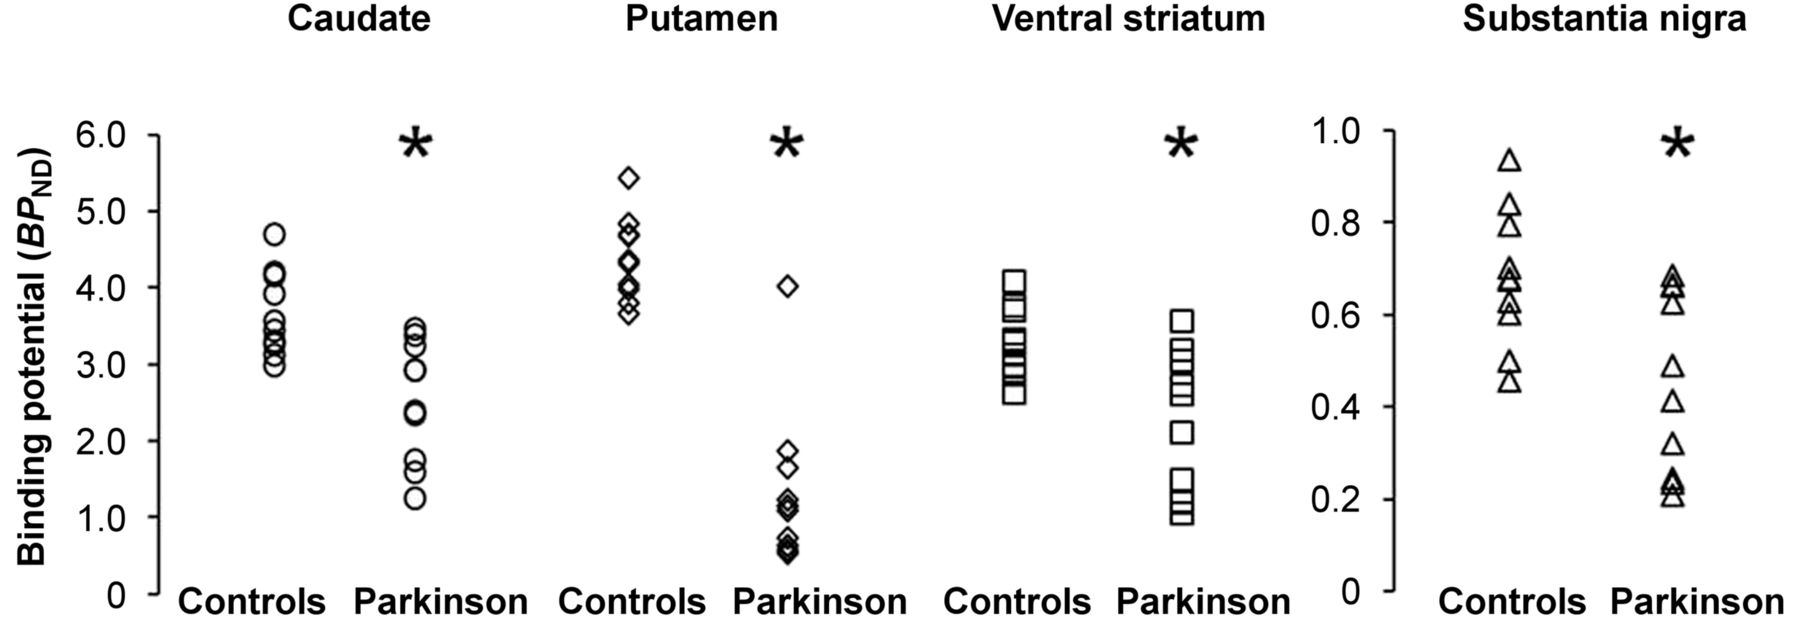
Regional BPND values in controls and PD patients. Patient with normal DAT binding can be considered as a SWEDD (scan without evidence of dopamine deficit) *P < 0.05 (with Bonferroni correction for 4 regions examined).
Correlation with Clinical Data
In PD patients, caudate BPND showed a trend toward a negative correlation with disease duration (β = −0.535, P = 0.05) and UPDRS motor (β = −0.470, P = 0.08). A negative correlation was found between ventral striatum BPND and UPDRS motor (β = −0.674, P = 0.032). No statistically significant correlations were found between BPND in the putamen or SN and clinical variables.
DISCUSSION
This study was designed to determine the suitability of 18F-FE-PE2I as a PET radioligand for the in vivo imaging of the nigrostriatal pathway in PD. The results show that the in vivo properties of 18F-FE-PE2I make the tracer a promising imaging tool for clinical studies in PD, enabling the quantification of DAT availability at the level of the axonal terminals (striatum) and at the level of the cell bodies of dopaminergic neurons (SN). 18F-FE-PE2I showed similar metabolism in control subjects and PD patients and results showed that quantitative measures of DAT availability could be obtained with approximately 66 min of PET data, using the cerebellum as a reference region. High-resolution parametric images of BPND generated with WAPI provided accurate quantification of the DAT in the striatum and in the SN and could be used as an imaging marker for clinical trials in PD.
In Vivo Metabolism of 18F-FE-PE2I
The parent fraction of 18F-FE-PE2I in plasma was similar in control subjects and PD patients. Two radiometabolites are considered important in light of their possible contribution to the quantification. 18F-FE-PE2I-CH2OH was observed in negligible amounts, on average less than 2%, and in some subjects it could not be easily separated on the HPLC because of its low amount. A structurally similar radiometabolite (11C-PE2I- CH2OH) has been shown to enter the brain in rats and most likely to bind to the DAT (33). Such small amount of the radiometabolite in the human plasma indicates that its contribution to the measured brain radioactivity would be negligible and would not influence the DAT quantification. The other radiometabolite, 18F-FE-PE2I-COOH, is less lipophilic and most likely not capable of crossing the blood–brain barrier (31). In this study, we also examined the plasma fP of 18F-FE-PE2I, which was found to be less than 3%. The relatively high protein binding of 18F-FE-PE2I is not a limitation for DAT quantification, although it decreases the reliability of the measurement of fp.
Quantification of 18F-FE-PE2I
18F-FE-PE2I showed favorable kinetic properties with relatively fast washout from the brain, confirming previous results obtained in nonhuman primates and young control subjects. The cerebellum was found to be a suitable reference region because no statistically significant differences of VT AUC ratio were found between controls and PD patients. In healthy subjects, it has been shown that SRTM is a suitable and reliable quantification method (21,22). Because parametric imaging is based on the use of LoganRef, we first compared LoganRef applied at the ROI level with SRTM and found an excellent correlation of BPND for all subjects examined. To identify the shortest imaging time that provided accurate estimates of BPND, we examined the effect of decreasing the duration of imaging in both PD patients and control subjects.
Stable estimates were obtained in PD patients and controls with 66 min of data using SRTM, suggesting the possibility of the use of a shorter acquisition time.
This acquisition time ensures a better compliance to the PET procedure for PD patients. We have previously shown that the accurate quantification of receptor binding data acquired with the HRRT in small brain regions, such as the SN, can be achieved using parametric imaging with the WAPI software (30). Therefore, we compared voxel-based BPND values measured from parametric images with ROI-based BPND values obtained with LoganRef and found an excellent correlation. The slope of the linear regression equation showed that voxel-based BPND estimates were 12% ± 7% higher than ROI-based BPND values. This slight overestimation would compensate the known underestimation of the LoganRef and might be related to the specific noise reduction performed with the wavelet-aided approach. Moreover, the 18F-FE-PE2I parametric images obtained with the HRRT permitted a clear visualization of the SN and nigrostriatal tracts, making possible the in vivo examination of the entire nigrostriatal pathway.
DAT Binding in Early-PD Patients
The preliminary results in early-PD patients indicate a predominant DAT loss in the dopaminergic terminals projecting to the putamen, with a smaller DAT loss in the SN. These findings are consistent with recent in vivo and postmortem findings suggesting that the primary degeneration in PD occurs at the level of the striatal terminals, followed subsequently by cell loss in the SN (34,35). These data would suggest that at the early stage of the disease, a consistent proportion of nigral cells are still viable and could be a suitable target for therapeutic strategies aimed at preserving surviving neurons, to delay the progression of the disease. However, these results need to be confirmed in a larger cohort of PD patients, in which the patients are also followed longitudinally to examine the relationship between disease progression and DAT decrease in the striatum and SN.
Additional Considerations
In this study, we did not find a significant correlation between DAT availability in the putamen and clinical variables. The lack of significant correlation, which was previously reported in a large cohort of PD patients (5), could be attributed to various reasons. The study was not designed for the purpose of finding correlations with clinical data; therefore, the statistical power was influenced by the limited sample size. Some variables, such as the UPDRS, could have been influenced by the treatment, because the patients were examined clinically on-medication. Finally, the ROIs were delineated on the whole putamen. Therefore, BPND could have been underestimated because of partial-volume effects, decreasing the agreement between imaging and clinical outcome measures. The examination of a larger group of patients at different stages of the disease and the measurement of BPND in different regions of the putamen are needed to examine in detail the correlations between DAT availability and clinical outcome measures.
CONCLUSION
18F-FE-PE2I is a DAT radioligand with favorable in vivo characteristics enabling the noninvasive examination of nigrostriatal DAT availability in parkinsonian patients. Accurate DAT quantification in PD patients can be obtained at 66 min of data, suggesting the potential utility of the radioligand as an imaging tool for applied clinical studies.
DISCLOSURE
The costs of publication of this article were defrayed in part by the payment of page charges. Therefore, and solely to indicate this fact, this article is hereby marked “advertisement” in accordance with 18 USC section 1734. The study was supported by funds from the Swedish Foundation for Strategic Research (SSF) and an AstraZeneca Translational Science Center-KI grant. No other potential conflict of interest relevant to this article was reported.
Acknowledgments
The work is dedicated to the late friend and colleague Raffaella Valigi Björck.
Footnotes
Published online Mar. 19, 2015.
- © 2015 by the Society of Nuclear Medicine and Molecular Imaging, Inc.
REFERENCES
- Received for publication November 28, 2014.
- Accepted for publication February 25, 2015.


Jump to section
Related Articles
Cited By...
- Imaging Dopaminergic Neurotransmission in Neurodegenerative Disorders
- Whole-Body Biodistribution and Dosimetry of the Dopamine Transporter Radioligand 18F-FE-PE2I in Human Subjects
- Optimal Acquisition Time Window and Simplified Quantification of Dopamine Transporter Availability Using 18F-FE-PE2I in Healthy Controls and Parkinson Disease Patients