


Abstract
Neurofibrillary tau pathology and amyloid β (Aβ) plaques, characteristic lesions of Alzheimer disease (AD), show different neocortical laminar distributions. Neurofibrillary-tangle tau pathology tends to be closer to the gray matter–white matter boundary, whereas Aβ is dispersed throughout the width of the cortical ribbon. Methods: Using PET radiotracers for tau and Aβ lesions, we developed an image analysis tool to measure the distance of tracer-positive voxels from the gray matter–white matter boundary. We studied 5 AD and 5 healthy subjects with both 18F-THK5117 (tau) and 11C-Pittsburgh compound B (Aβ) PET. Results: On average, tau-positive voxels were closer to the white matter than were Aβ-positive voxels. This effect was found for all AD subjects and for all regions, both before and after regionally adjusting for the nonspecific white matter binding of both tracers. The differential laminar pattern was validated through postmortem examination. Conclusion: Within cortical lamina, distance measures may be of value in testing PET tracers for their anatomic selectivity.
Senile amyloid plaques and neurofibrillary tangles (tau pathology) are the two characteristic lesions required for a neuropathologic diagnosis of Alzheimer disease (AD) (1). On histopathology, amyloid β (Aβ) plaques are extracellular and dispersed throughout the neocortical ribbon (2). During the progression of AD, tau tangles initially appear in the hippocampal formation and subsequently in the neocortex (3), where they are intracellular and preferentially located in neocortical layers V and VI, closer to the gray matter–white matter boundary (4). Analogs of thioflavin T such as 11C-Pittsburgh compound B (PiB) adapted for PET have been validated for imaging Aβ deposits (5). Recently, PET compounds have been developed to label tau pathology (6–8).
Typically, PET images are analyzed by assessing regional signal uptake in the cerebral cortex, but the distribution of signal within the cortical ribbon is ignored. The objective of this study was to investigate whether the differential spatial distributions of these two lesions in the cortical ribbon of AD patients can be detected with PET imaging. We tested the hypothesis that the bound tau tracer is closer to the gray matter–white matter boundary than is Aβ.
MATERIALS AND METHODS
Participants
Ten subjects were studied: 5 with probable AD (3 women and 2 men; mean age ± SD, 77.4 ± 13.0 y; range, 57–88 y; Mini-Mental State Examination score, 18.8 ± 5.9; Clinical Dementia Rating, 2.0 ± 1.0; education, 12.2 ± 3.6 y) and 5 healthy elderly controls (4 men and 1 woman; mean age, 71.6 ± 4.2 y; range, 67–78 y; Mini-Mental State Examination score, 28.8 ± 1.8; Clinical Dementia Rating, 0; education, 13.6 ± 2.2 y). Written informed consent was obtained from all participants. One AD postmortem autoradiography validation study was conducted using 3H-THK5117 and 3H-PiB. The protocol was approved by the Ethics Committee of Tohoku University Hospital. Controls were recruited by advertisements in the community. AD patients were recruited from the memory clinic of Tohoku University Hospital. The clinical and neuropsychological performance of the participants was assessed by a neurologist and a neuropsychologist in consensus, who were not aware of the PET results. AD was diagnosed according to the criteria of the National Institute of Neurologic and Communicative Disorders and Stroke/Alzheimer’s Disease and Related Disorders Association.
Image Acquisition
MR imaging was performed on a SIGNA 1.5-T magnet (GE Healthcare). A 3-dimensional volumetric acquisition of a T1-weighted spoiled gradient recalled sequence produced gapless axial sections (echo time/repetition time, 2.4/50 ms; flip angle, 45°; acquisition matrix, 256 × 256; 1 excitation; field of view, 22 cm; slice thickness, 2.0 mm). The two radiotracers, 6-[(3-18F-fluoro-2-hydroxy)propoxy]-2-(4-methylaminophenyl)quinoline (18F-THK5117) and 11C-PiB, were prepared at the Cyclotron and Radioisotope Center of Tohoku University. 18F-THK5117 was synthesized as described previously (9). 11C-PiB PET was synthesized using the 1-step11C-methyl triflate approach (10). PET data were acquired using an Eminence STARGATE PET scanner (Shimadzu) from 0 to 90 min for 18F-THK5117 with a dosage of 185 mBq and from 0 to 70 min for 11C-PiB with dosage of 296 mBq.
Image Analysis
For each subject, dynamic PET frames of both 18F-THK5117 and 11C-PiB were realigned using SPM8 software (www.fil.ion.ucl.ac.uk/spm). Standardized uptake value (SUV) images were generated from 18F-THK5117 using the 50- to 80-min frames and from 11C-PiB using the 50- to 70-min frames. All SUV images were coregistered to the corresponding MR imaging volumes using SPM8. MR imaging–determined regions of interest were used to sample the PET images. MR imaging–based regions of interest were determined by Free-Surfer (version 5.1, http://surfer.nmr.mgh.harvard.edu) for the gray and white matter for the entire neocortex (principal outcome) and separately for the frontal, parietal, occipital, and temporal lobes and for the cerebellum. For each tracer, the cerebellar gray matter was used to create regional SUV ratios (SUVRs).
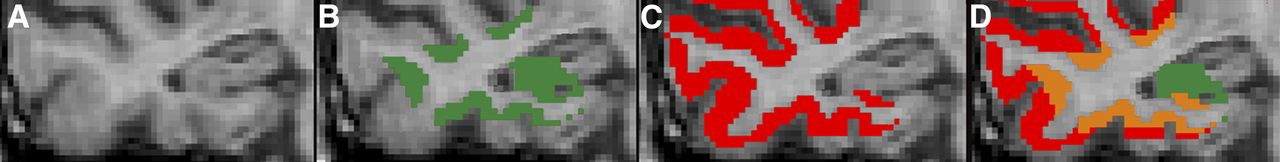
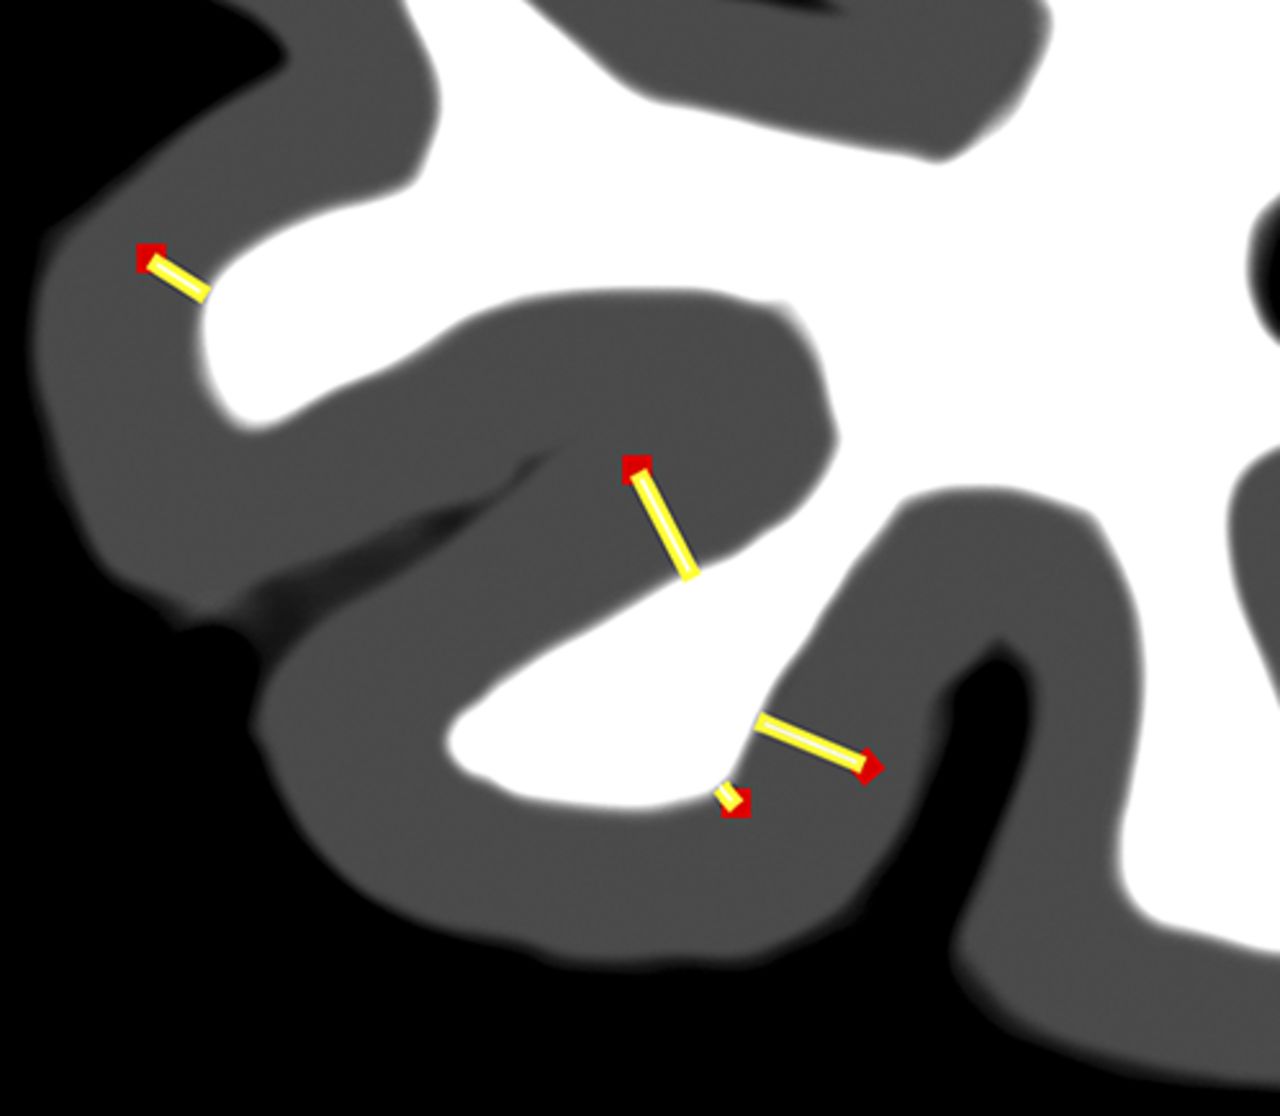
Cutoff cortex values for positive and negative 18F-THK5117 and 11C-PiB PET voxels were regionally defined referencing the mean control SUVR and SD. Cutoffs were tested at 1.5 (Fig. 1) and 1.0 times the SD. A distance[v] measure was generated for all positive cortical voxels for each tracer based on the shortest distance to the MR imaging–defined gray matter–white matter boundary (Fig. 2). To test whether distance[v] distinguished 18F-THK5117 binding from 11C-PiB binding, the distributions in AD subjects were estimated for each of the regions of interest. Voxels located in the neocortex with an apparent thickness of less than 1.0 mm (likely caused by segmentation errors, <10% of total) were excluded from the analysis.

(A) T1-weighted MR image of right temporal cortex of AD patient. (B) Tau-positive voxels (green). (C) Amyloid-positive voxels (red). (D) Overlapping tau and amyloid voxels (orange). All are at 1.5-SD cutoff.

Schematic representation of distance[v] image. For each PET tracer, positive gray ribbon voxels (red dots) were defined by statistical threshold and shortest distance to white matter boundary computed (yellow line). Gray matter ribbon and gray matter–white matter boundary are defined by MR imaging.
Statistical Analysis
We tested the hypothesis that distance[v] is shorter for tau than for Aβ by the paired t test and the nonparametric Wilcoxon signed-rank test. A residual approach was taken to adjust for the confounding effects of nonspecific white matter uptake of the two tracers. Specifically, in the control group, regional regression equations defining the relationships between distance[v] and adjacent white matter uptake were estimated. Subsequently, these regression models were applied to the AD group and used to calculate the AD residuals (residual = actual value minus predicted value). The residuals and actual values were tested. Analyses were performed with SPSS, version 19 (IBM). Results were declared statistically significant when P was less than 0.05.
RESULTS
Compared with controls (C), the total neocortex SUVR was higher in AD for both 11C-PiB ( SUVR-C = 1.13 ± 0.04,
  SUVR-AD = 1.69 ± 0.17) and 18F-THK5117 (
 SUVR-C = 1.12 ± 0.06,
  SUVR-AD = 1.31 ± 0.07). The average cortical thickness was 1.90 mm in AD patients and 2.85 mm in controls. For both the 1.5- and the 1.0-SD cutoffs, in all regions the mean distance[v] was significantly shorter for tau than for Aβ. Adjustment for partial-volume artifacts did not change the results (Table 1). All significant test results were confirmed using the Wilcoxon signed-rank test. Figure 1 shows the AD spatial distribution of tau and Aβ tracer binding in the temporal lobe of a representative patient. The individual distance[v] data are in the supplemental data (available online at http://jnm.snmjournals.org).
Mean Distance[v] and Total Counts for 18F-THK5117– and 11C-PiB–Positive Voxels (1.5-SD Cutoff)
For 11C-PiB at the 1.5-SD cutoff, the total number of positive voxels (1.1 × 10⁶) was approximately 5 times greater than that for 18F-THK5117 (0.2 × 10⁶). Histogram analysis of the neocortical distribution pattern of 11C-PiB– and 18F-THK5117–positive voxels showed that 18F-THK5117 skewed toward shorter distances (Fig. 3). This distribution pattern was not observed in controls (Supplemental Fig. 1).
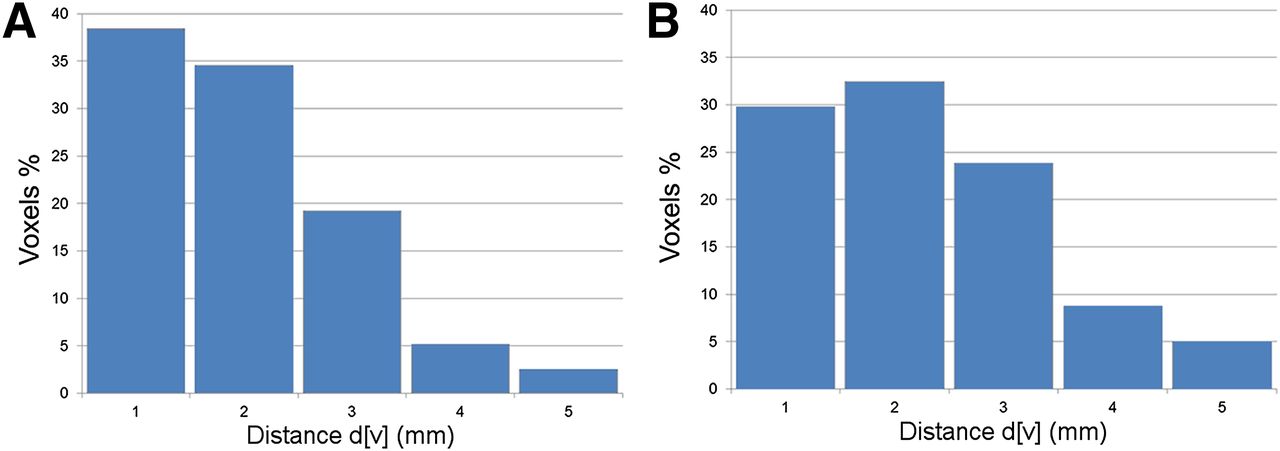
AD distance[v] histogram for neocortical 18F-THK5117– and 11C-PiB–positive voxels (1.5 SDs). (A) Distance[v] histogram of 18F-THK5117–positive voxels in total neocortex. (B) Distance[v] histogram of 11C-PiB–positive voxels in total neocortex.
The postmortem autoradiography study also showed that tau binding localized to the deeper cortical layers, whereas 11C-PiB binding was more widely distributed (Fig. 4).

AD autoradiography images: 3H-THK5117 (green) (A), 3H-PiB (red) (B), and overlapping tau and amyloid binding (orange) (C). Arrows highlight more inferior tau pathology distribution.
DISCUSSION
Previous studies have shown a diagnostic value for PiB (5) and for THK5117 (8) in AD. However, the intralaminar distributions of THK5117 and PiB have not been previously described. In agreement with neuropathologic evidence that tau and Aβ, the principal lesions of AD, have different cortical laminar distributions (4), we present the first (to our knowledge) PET imaging confirmation of this distribution pattern. Neurofibrillary pathology in AD is typically found in the deeper cortical lamina whereas plaques are widely distributed (2,4). In agreement, we found with PET that the average distance[v] of tau-positive cortical voxels to the gray matter–white matter boundary is shorter than that of Aβ-positive voxels. We observed this effect in each AD subject and for all regions tested. These PET findings are further supported by our postmortem study using THK5117 and PiB to map Aβ and tau pathology.
Although the distance[v] difference between the imaged tau and Aβ deposits was approximately 0.2 mm, well below the spatial resolution of PET (11), because of the large number (∼106) of voxels the effect was significant and observed in all 5 AD patients and in all brain regions. When measured with the Cohen κ (the mean difference between the 11C-PiB and 18F-THK5117 distances, divided by overall SD), the effect was nearly 200%.
Our finding of a 5-fold increased magnitude of Aβ over tau-positive voxels indicates the greater extent of Aβ pathology. These findings are also consistent with neuropathologic findings (12) and further contribute to the face validity of PET imaging in AD.
Cross-contamination between adjacent cortical and white matter voxels, each with distinct tracer uptake, is referred to as the partial-volume artifact. To investigate whether our findings can be attributed to this artifact, we generated a conservative control-group–based model that regresses the lesion distance measure on the white matter SUVR. After applying the adjustment to the AD group, the tracer pattern remained significant for all brain regions at the conservative 1.5-SD lesion cutoff.
The current method is of potential interest for subjects experiencing traumatic brain injury, for whom the laminar distribution of the tau pathology is reported to be more superficial (13). Future studies will also examine continuous measures of tracer retention, with distance being weighted by the uptake in each voxel.
CONCLUSION
PET images of AD subjects show different laminar distributions of tau and Aβ deposits. Tau pathology tends to localize in the deeper lamina of the cortical ribbon, whereas the Aβ is more uniformly distributed. This observation may lead to a new biomarker of AD progression. It may also be of use in the evaluation of other neurodegenerative disorders with different tau distributions.
DISCLOSURE
The costs of publication of this article were defrayed in part by the payment of page charges. Therefore, and solely to indicate this fact, this article is hereby marked “advertisement” in accordance with 18 USC section 1734. Work at NYU was supported by NIH/NIA grants AG035137, AG032554, AG022374, AG013616, and AG012101 and by the Steven and Alexandra Cohen Veterans Center. Work at Tohoku University was supported by Health and Labor Sciences research grants from the Ministry of Health, Labor, and Welfare of Japan, a Grant-in-Aid for Scientific Research (B) (23390297), a Grant-in-Aid for Scientific Research on Innovative Areas (26117003), a grant from the Japan Advanced Molecular Imaging Program (J-AMP) of the Ministry of Education, Culture, Sports, Science and Technology, and the research fund from GE Healthcare and Sumitomo Electric Industries, Ltd. No other potential conflict of interest relevant to this article was reported.
Acknowledgments
Yi Li is a PhD student at Shandong University. This work partially fulfills Yi Li's PhD degree requirements. Both Shandong University and New York University are primary affiliations of Yi Li.
Footnotes
↵* Contributed equally to this work.
Published online Jan. 15, 2015.
- © 2015 by the Society of Nuclear Medicine and Molecular Imaging, Inc.
REFERENCES
- Received for publication September 30, 2014.
- Accepted for publication December 11, 2014.


