


Abstract
The aim of this study was to investigate the prognostic impact of CT and 18F-FDG PET/CT on the outcome of metastatic neck node (MNN) in patients with head and neck cancer receiving definitive radiotherapy or chemoradiotherapy. Methods: This patient-based study included 91 patients diagnosed with pharyngeal cancers with MNN (N1, 15; N2, 70; N3, 6). All had pretreatment CT and PET/CT before definitive chemoradiotherapy/radiotherapy. Parameters of MNNs for each patient, including maximal diameter, nodal volume, radiologic central necrosis, maximum standardized uptake value, metabolic tumor volume, and total lesion glycolysis (TLG), were retrieved for the analysis. Nodal relapse-free survival (NRFS) and survivals were calculated using the Kaplan–Meier method. Independent predictors were identified using Cox regression analysis. Results: After a median follow-up of 18 mo, 64 patients remained nodal relapse-free, and 27 experienced neck recurrence. Multivariate analysis showed that the application of 40% of the maximal uptake of nodal TLG (N-TLG40%) 38 g or greater (P = 0.03; hazard ratio, 2.63; 95% confidence interval, 1.10–6.30) and radiologic necrosis on CT scan (P = 0.001; hazard ratio, 10.99; 95% confidence interval, 2.56–47.62) were 2 adverse features for NRFS. Patients who had an N-TLG40% 38 g or greater and central radiologic necrosis had a significantly inferior 2-y NRFS (53% vs. 77% and 45% vs. 95%, respectively). Conclusion: The outcome of MNNs in patients with head and neck cancer receiving chemoradiotherapy/radiotherapy can be predicted according to radiologic necrosis and N-TLG40% value. The 2 adverse features should be validated in future trials. In this way, patients can be treated alternatively or aggressively.
Organ preservation with definitive chemoradiotherapy has become a treatment option in patients with head and neck cancers. In the case of residual or recurrent diseases after initial therapy, salvage surgical intervention will be indicated. Although the status of neck disease is a major determinant of prognosis in head and neck cancers, the optimal management of the metastatic neck node (MNN) remains an issue of debate. A planned adjunctive neck dissection has been suggested in patients with N2 or N3 disease, which was based on some studies that demonstrated that radiotherapy combined with surgery might improve neck control rates, compared with 1 modality alone (1–3). However, several studies advocated surveillance of neck diseases because a complete remission can be achieved when assessing the response using 18F-FDG PET (4–7). In patients with regional recurrence after chemoradiotherapy/radiotherapy, salvage neck dissection would be possible but was associated with additional morbidity and worse prognosis (8,9). Therefore, there is a need to identify pretreatment predictors that can foresee the outcome earlier when a decision of organ preservation or treatment modification should be discussed.
Although CT-based tumor volume or PET/CT has been used to predict treatment outcome in patients with head or neck cancers, there is still a lack of studies implementing comprehensive knowledge of the 2 images to identify imaging features that can be used to predict treatment outcomes for patients with MNN. Knowledge of imaging features that predict poor response to nonsurgical management could assist clinicians in selecting surgical therapy or considering dose-escalation schemes for patients with such high-risk features. To address this issue, we conducted a patient-based study to examine pretreatment parameters from both images.
MATERIALS AND METHODS
Patient Population
From January 2007 through June 2012, a cohort of 91 patients with pharyngeal cancers with histologic proof of squamous cell carcinoma, who had been treated with an organ preservation scheme at China Medical University Hospital, was included in this retrospective analysis after institutional review board (IRB) approval. The IRB (or equivalent) approved this retrospective study, and the requirement to obtain informed consent was waived (certificate number of local IRB, DMR99-IRB-010-1). The origin of the tumors was the oropharynx in 49 patients and hypopharynx in 42 patients. The median age was 52 y. All patients received pretreatment CT and PET/CT for initial staging within 4 wk before treatment was initiated. Because this study also aimed to recognize the association between nodal control and survival, a patient-based rather than a node-based analysis was performed. The characteristics of the 91 patients are shown in Table 1.
Patient Characteristics (n = 91)
Definition of CT-Based Parameters
Each patient underwent a pretreatment contrast-enhanced CT scan of the neck with 3-mm-thick contiguous sections. Neck nodes were considered pathologic when their smallest-axis diameter was greater than 1 cm. The CT images from the PACS were then transferred to a commercial planning system (Eclipse, version 8.1; Varian Medical System Inc.). Radiation oncologists then delineated the pretreatment gross tumor volume of the primary tumors and the MNN (10).
Three parameters including gross tumor volume of MNN (N-GTV), maximal nodal diameter, and radiologic central necrosis were retrieved from pretreatment CT images. Nodes in groups close together were scored as multiple node conglomerates. If there were multiple nodal sites on the CT scan, we selected the largest N-GTV for this patient-based analysis. The radiologic central necrosis was confirmed by radiologists. Because of lacking consistent consensus about extranodal spread, this parameter was not analyzed in this study.
PET/CT Image Acquisition
No patient had abnormal serum glucose levels before the PET/CT images were captured. All patients were required to fast for at least 4 h before 18F-FDG PET/CT imaging. The images were captured using a PET/CT scanner (PET/CT-16 slice, Discovery STE; GE Medical System) approximately 60 min after the administration of 370 MBq of 18F-FDG. After the axial imaging range was determined, a spiral non–contrast-enhanced low-radiation dose CT scan (0.8-s rotation time, 120 kVp, variable mA with AutomA technique, 3.75-mm slice thickness, and 1.75:1 pitch) was acquired for anatomic reference and attenuation correction. PET emission images were then acquired sequentially after the CT scan at 1.5 min per field of view in 3-dimensional acquisition mode with an 11-slice overlap at the borders of the field of view. The CT images were reconstructed onto a 512 × 512 matrix with a section thickness of 3.75 mm then reconstructed onto a 128 × 128 matrix and converted into 511-keV equivalent attenuation factors for attenuation correction of the corresponding PET emission images. The PET images were reconstructed using 3-dimensional iterative algorithms (VUE Point). The PET/CT workstation provided a quantification of 18F-FDG uptake for standardized uptake value (SUV). This procedure has been described in our prior study (11). The maximum SUV of the target node was abbreviated as N-SUVmax.
Measurement of Metastatic Tumor Volume (MTV) and Total Lesion Glycolysis (TLG)
We used the autosegmentation process of PET to define the volume of interest to reduce interobserver variability in image evaluation. MTVs and TLGs were measured from attenuation-corrected 18F-FDG PET images using an SUV-based automated contouring program (Advantage Workstation Volume Share, version 2; GE Healthcare). The MTV was defined as the sum of the metabolic volumes of the primary tumors. The volume boundaries were sufficiently wide to incorporate each target lesion in the axial, coronal, and sagittal 18F-FDG PET images. To define the contouring margins around the tumor, we used SUVmax of 2.5 (MTV2.5) and 50% of SUVmax (MTV50%), as reported in our previous study (11). The TLG was calculated according to the following formula: TLG = SUVmean × MTV (12). We used threshold levels that were equivalent for the MTVs—that is, TLG40% and TLG50%. The TLG40% was labeled as pretreatment TLG defined by 40% of the maximal uptake of nodal TLG and the TLG50% by 50% of the maximal uptake. Each patient had 2 sets of TLG: T-TLG for the primary tumor and N-TLG for the MNN. Similarly, the largest one was selected for the analysis in the case of multiple MNNs.
Treatment
Radiotherapy was performed using a sequential intensity-modulated radiotherapy technique (10). All patients received doses of 1.8 Gy daily, up to a total dose of between 68.4 and 73.8 Gy (median, 70.2 Gy). Two clinical target volumes (CTVs) were considered for various risks: CTV1 encompassed the primary tumor, MNNs, and the regions adjacent to the gross tumor, and CTV2 consisted of the ipsilateral or contralateral N0 regions at risk of harboring microscopic tumors. The dose delivered to CTV1/CTV2 during the first course was 50.4–54 Gy, with a further boost of 16.2–21.6 Gy to the CTV1 during the second course. Thus, the median cumulative doses of CTV1 and CTV2 were 70.2 and 54.0 Gy, respectively. The median radiotherapy duration was 53 d. Seventy patients received concurrent chemotherapy; their regimen consisted of cisplatin (80–100 mg/m2 on days 1, 22, and 43). Fourteen patients received combined cetuximab (400 mg/m2 loading dose and 250 mg/m2) weekly. Seven received radiotherapy alone.
Follow-up
According to the guidelines of the Response Evaluation Criteria in Solid Tumors (13), the initial treatment response was assessed by the CT scan done 1–2 mo after the completion of therapy. Patients were followed every 2–3 mo thereafter. A physical examination and laryngoscopy were performed during each follow-up examination, and a CT scan was obtained every 3–6 mo over 2 y. The definition of neck failure was based on the PET/CT, or progression of tumor on the CT scan. If patients had persistent tumors or recurrence after initial complete remission, salvage surgery was suggested if technically feasible and allowable by the condition of the patient.
Statistical Analysis
This study used the median values of the N-SUVmax, N-GTV, N-MTVs, and N-TLGs as cutoff points. The results of the statistical analysis are presented as the mean ± SD. To examine the correlations between the parameters and recurrence, receiver-operating-characteristic curves were created to evaluate the optimal predictive performance among the MTVs and TLGs. The primary endpoints were the predictors for initial treatment response and nodal relapse-free survival (NRFS). The secondary endpoints were overall survival (OS) and disease-free survival (DFS). These rates were calculated using the Kaplan–Meier method. Logistic regression analysis was used to identify predictors for initial responders. Cox regression was performed to examine the effects of explanatory variables on OS, DFS, and NRFS. Although this study was to examine the impact of images on treatment outcome for MNN, PET/CT parameters describing primary and nodal tumors, as well as clinical parameters, were all included in the analysis when survivals were analyzed. Two-tailed tests were used, and P values of less than 0.05 were considered statistically significant. All calculations were performed using SPSS 13.0 for Windows (SPSS Inc.).
RESULTS
Parameter Measurement
Four methods of calculating nodal MTV (N-MTV) and nodal TLG (N-TLG) values were retrieved for all patients. The mean N-GTV was 18.1 ± 27.8 mL, and the mean N-SUVmax was 6.5 ± 4.4. The distributions of N-SUVmax, N-GTV, and various N-MTV and N-TLG with respect to N classification are shown in Table 2. A trend of increasing values of PET/CT- or CT-related parameters was observed at an advanced N stage.
Distribution of CT- and PET/CT-Related Parameters with Respect to N Classification
Treatment Outcome
According to the first CT scan after the treatment, 56 of the 91 MNNs (62%) obtained a complete response, whereas 35 (38%) had a partial response. After a median follow-up duration of 18 mo (range, 6–69 mo), 37 patients were alive without known recurrent disease, and 16 patients had locoregional recurrence; however, they were alive after salvage or palliative treatment. Thirty-one patients died of tumor recurrence. Seven died of intercurrent diseases or other malignancies. Table 3 shows the detailed failure patterns of the cohort. In summary, 64 patients remained nodal relapse-free, whereas 27 patients experienced neck recurrence. Overall, the 2-y OS, DFS, and NRFS were 51% (95% confidence interval [CI], 42%–60%), 42% (95% CI, 33%–51%), and 66% (95% CI, 57%–75%), respectively.
Patient Outcome (n = 91)
Comparison of Predictive Ability for Nodal Failure Among Different Threshold Methods
The receiver-operating-characteristic curves were analyzed to compare the efficacy of various PET/CT-related parameters and threshold methods for determining the optimal approach for autosegmentation contouring. The results showed that N-MTV2.5 (pretreatment nodal metabolic tumor volume defined by SUV = 2.5) and N-TLG40% (40% of the maximal uptake of nodal TLG) predicted the residual or recurrent nodes most accurately among the corresponding threshold methods (Supplemental Appendix 1; available at http://jnm.snmjournals.org). On the basis of the results, biologic tumor volumes using N-MTV2.5 and N-TLG40% methods combined with N-SUVmax and CT-related parameters were selected for the analysis.
Factors Associated with Initial Nodal Response
According to the first follow-up CT scan, patients were classified into complete and partial responders. The logistic analysis showed N-GTV ≥ 8.9 mL (P = 0.025; odds ratio, 3.32; 95% CI, 1.16–9.48) and radiologic central necrosis (P < 0.001; odds ratio, 10.10; 95% CI, 3.03–34.48) were 2 factors associated with partial remission of the MNNs (Supplemental Appendix 2).
Prognostic Factors for Nodal Relapse and Survival
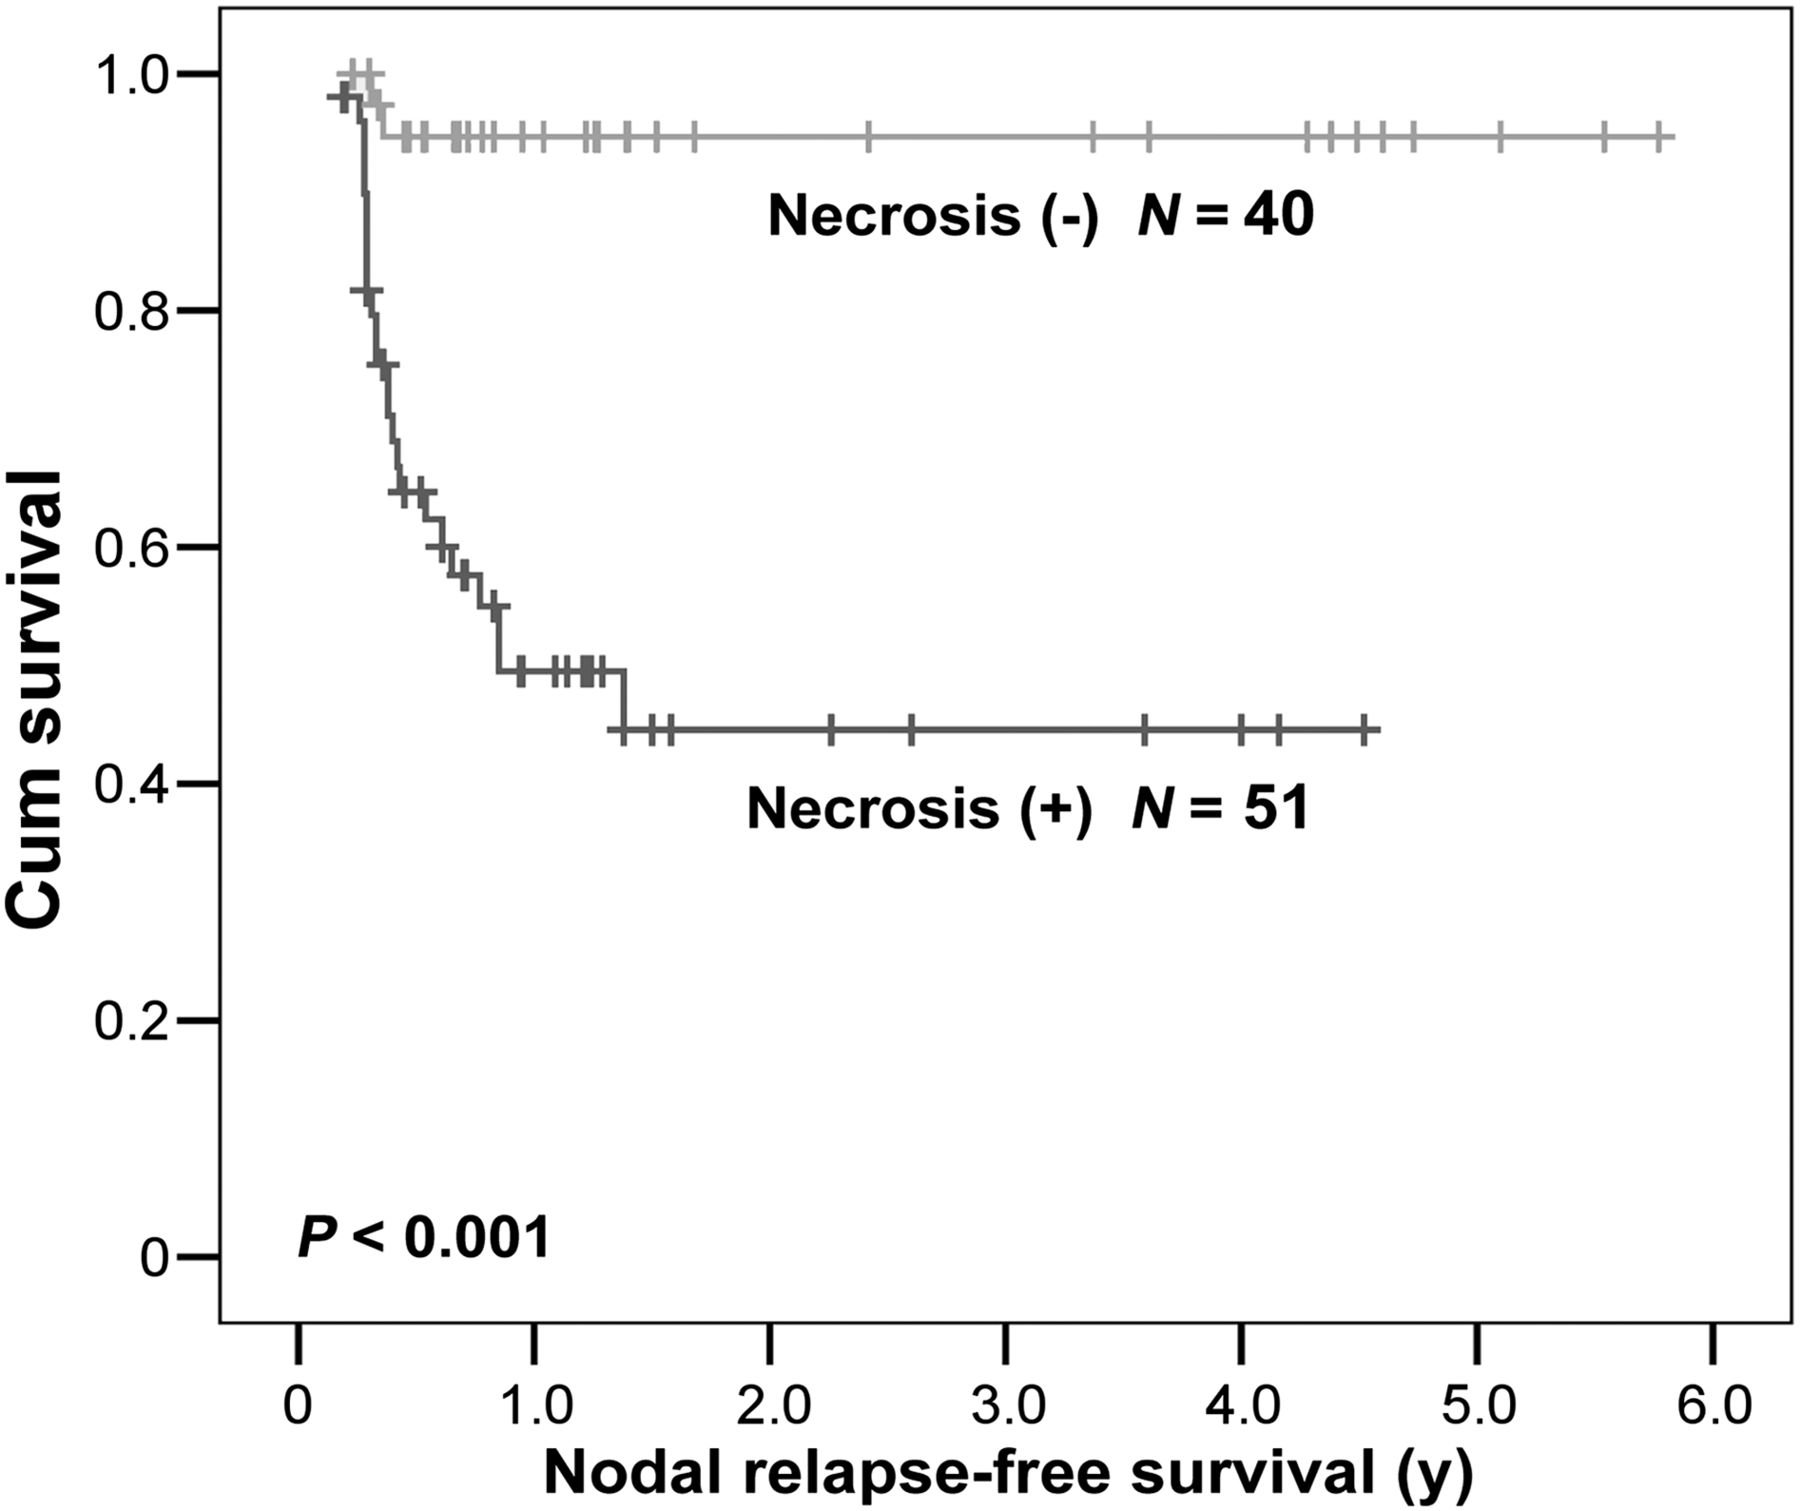
The Cox regression analysis showed that N-TLG40% ≥ 38 g (P = 0.03; hazard ratio [HR], 2.63; 95% CI, 1.10–6.30) and radiologic central necrosis (P = 0.001; HR, 10.99; 95% CI, 2.56–47.62) were 2 predictors for neck recurrence (Table 4). The 2-y NRFS for patients who had tumors with N-TLG40% ≥ 38 g and < 38 g was 53% and 77%, respectively (Fig. 1). Patients with radiologic central necrosis had a lower 2-y NRFS than those without this feature (45% vs. 95%; Fig. 2). Although a large N-GTV, or a higher N-SUVmax, was also associated with higher risk of recurrence, there was no statistical significance in the multivariate analyses. In addition, no difference of NRFS curves was found between the origin of the primary tumors (Supplemental Appendix 3). When N-TLG40% ≥ 38 g was used as a cutoff to predict nodal failure, the sensitivity, specificity, and accuracy were 44%, 85%, and 65%, respectively. When the central necrosis was applied to forecast recurrence, the sensitivity, specificity, and accuracy were 47%, 93%, and 67%.
Association Between PET/CT- and CT-Based Tumor Parameters and Survivals Using Cox Regression Model

NRFS according to central necrosis on CT scan (P < 0.001).
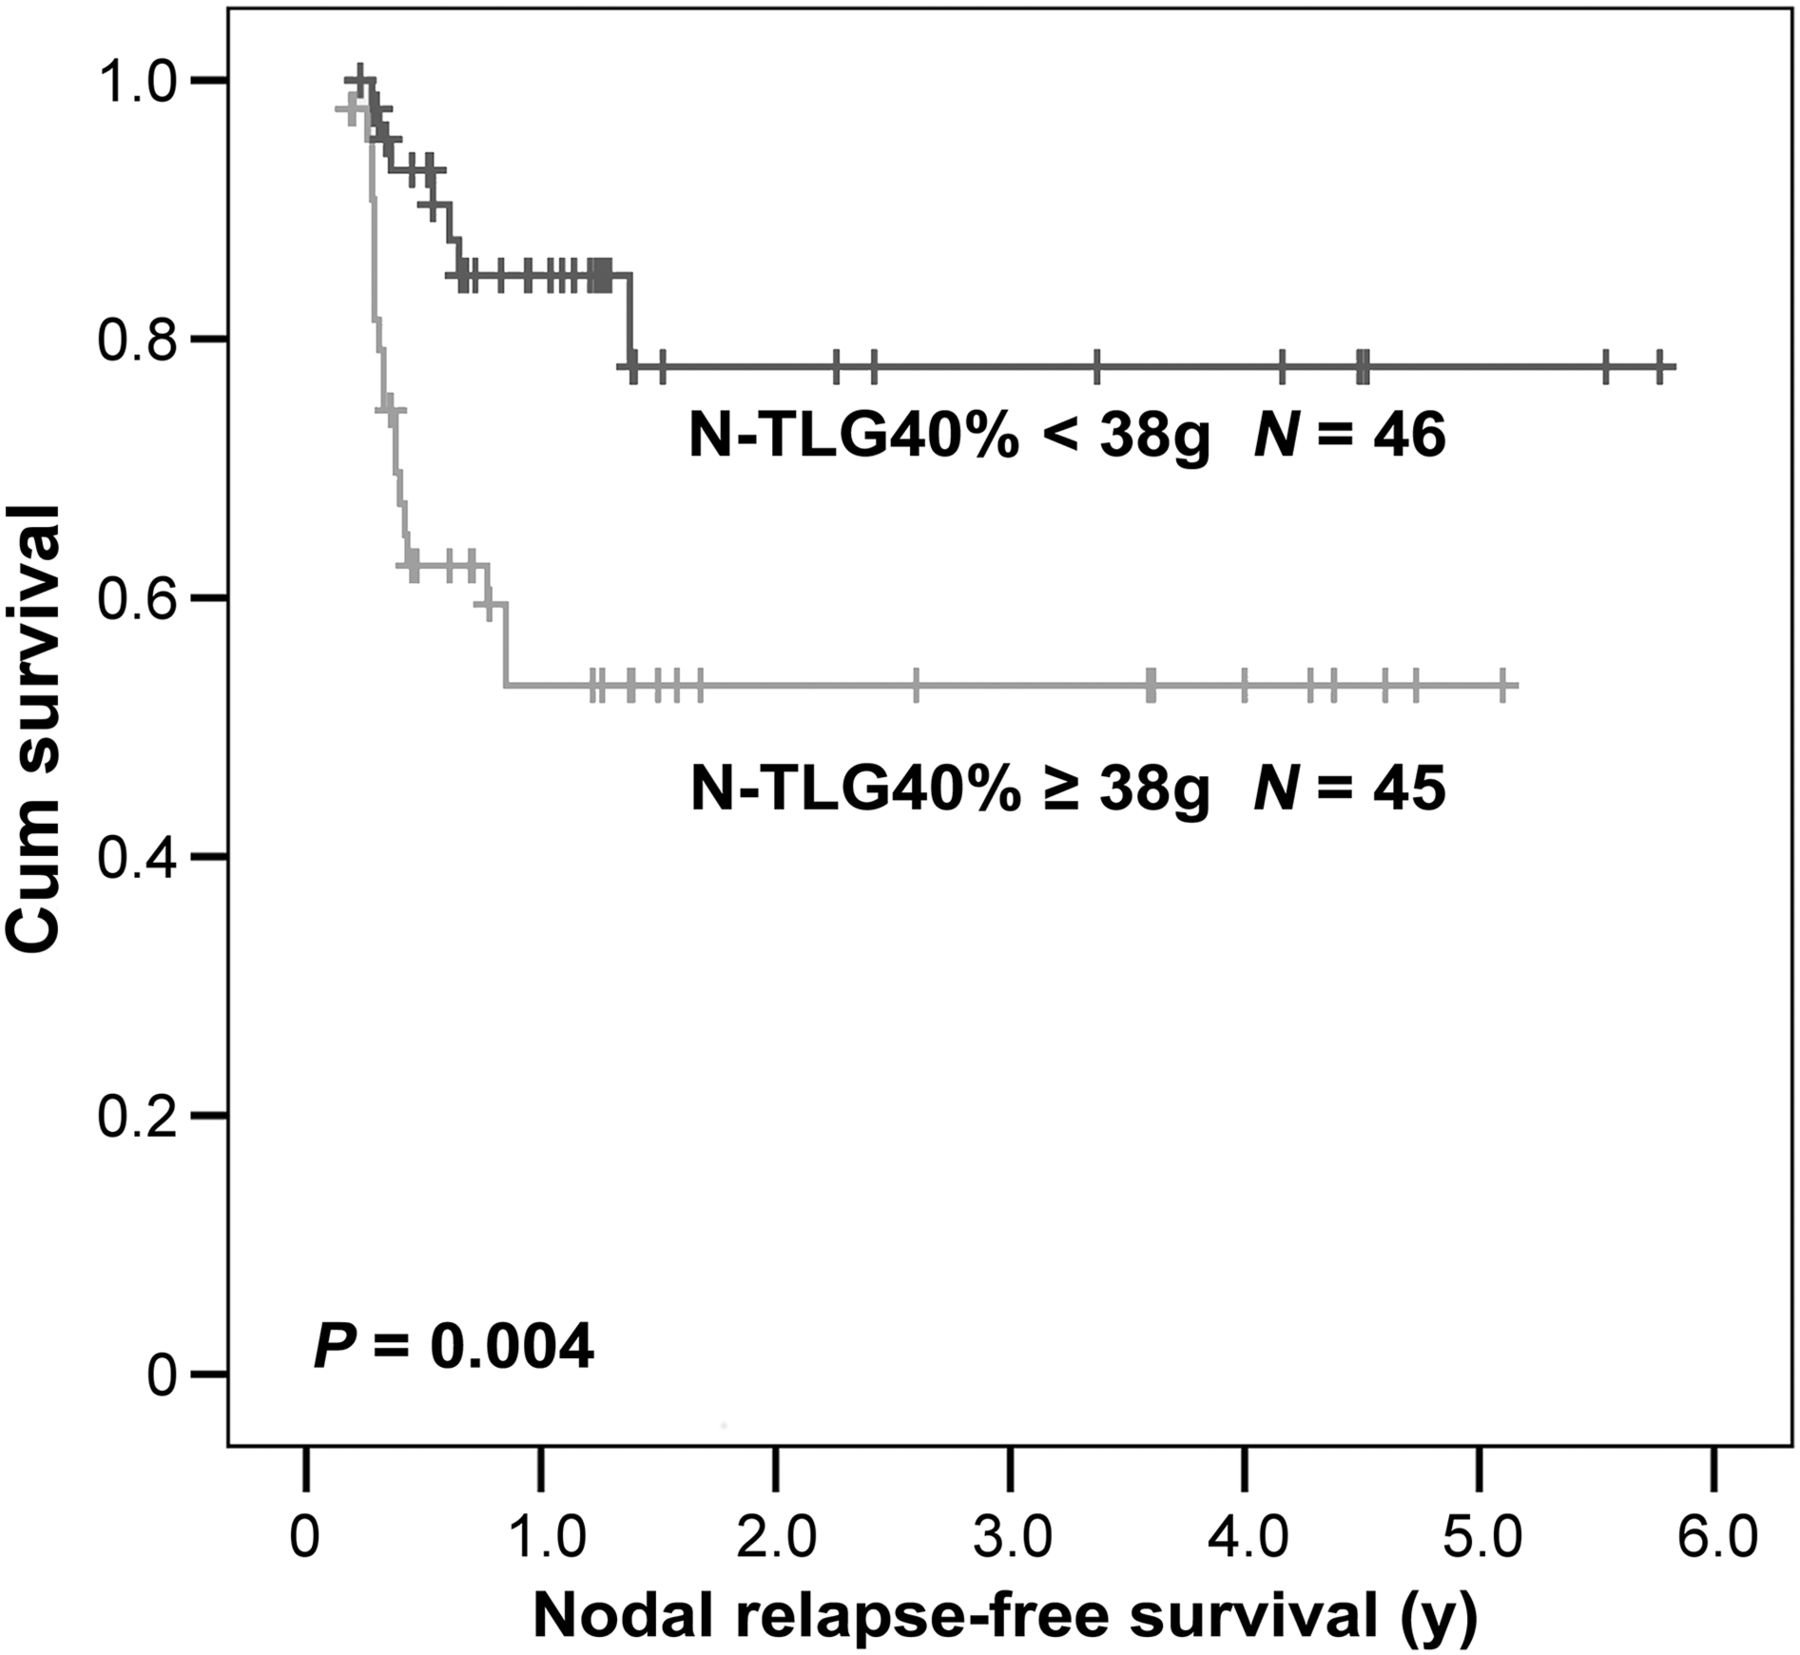
NRFS according to nodal TLG40% ≧ 38 g and < 38 g (P = 0.004).
As also shown in Table 4, 2 predictors for inferior OS were T3–T4 (P = 0.01; HR, 2.68; 95% CI, 1.27–5.64) and central necrosis (P = 0.02; HR, 2.59; 95% CI, 1.13–5.26). T-MTV2.5 (metabolic tumor volume of primary tumor defined by SUV = 2.5) showed a marginal impact on OS. The prognosticators of DFS were T3–T4 (P = 0.001; HR, 3.63; 95% CI, 1.75–7.50), central necrosis (P < 0.001; HR, 3.62; 95% CI, 1.79–7.35), and N-TLG40% ≥ 38 g (P = 0.02; HR, 2.12; 95% CI, 1.13–4.00).
Subgroup Analysis in Patients with N2–N3 Neck Disease
Because some studies advocated a planned neck dissection for patients with N2–N3 disease, we performed a subgroup analysis for these patients (n = 76) to examine the performance of the parameters mentioned above. The Cox regression analysis showed a similar finding that N-TLG40% ≥ 38 g (P = 0.04; HR, 2.22; 95% CI, 1.04–4.79) and central necrosis (P = 0.002; HR, 4.99; 95% CI, 1.83–13.69) were 2 prognostic factors for nodal relapse.
Risk Stratification of Nodal Relapse According to Major Adverse Factors
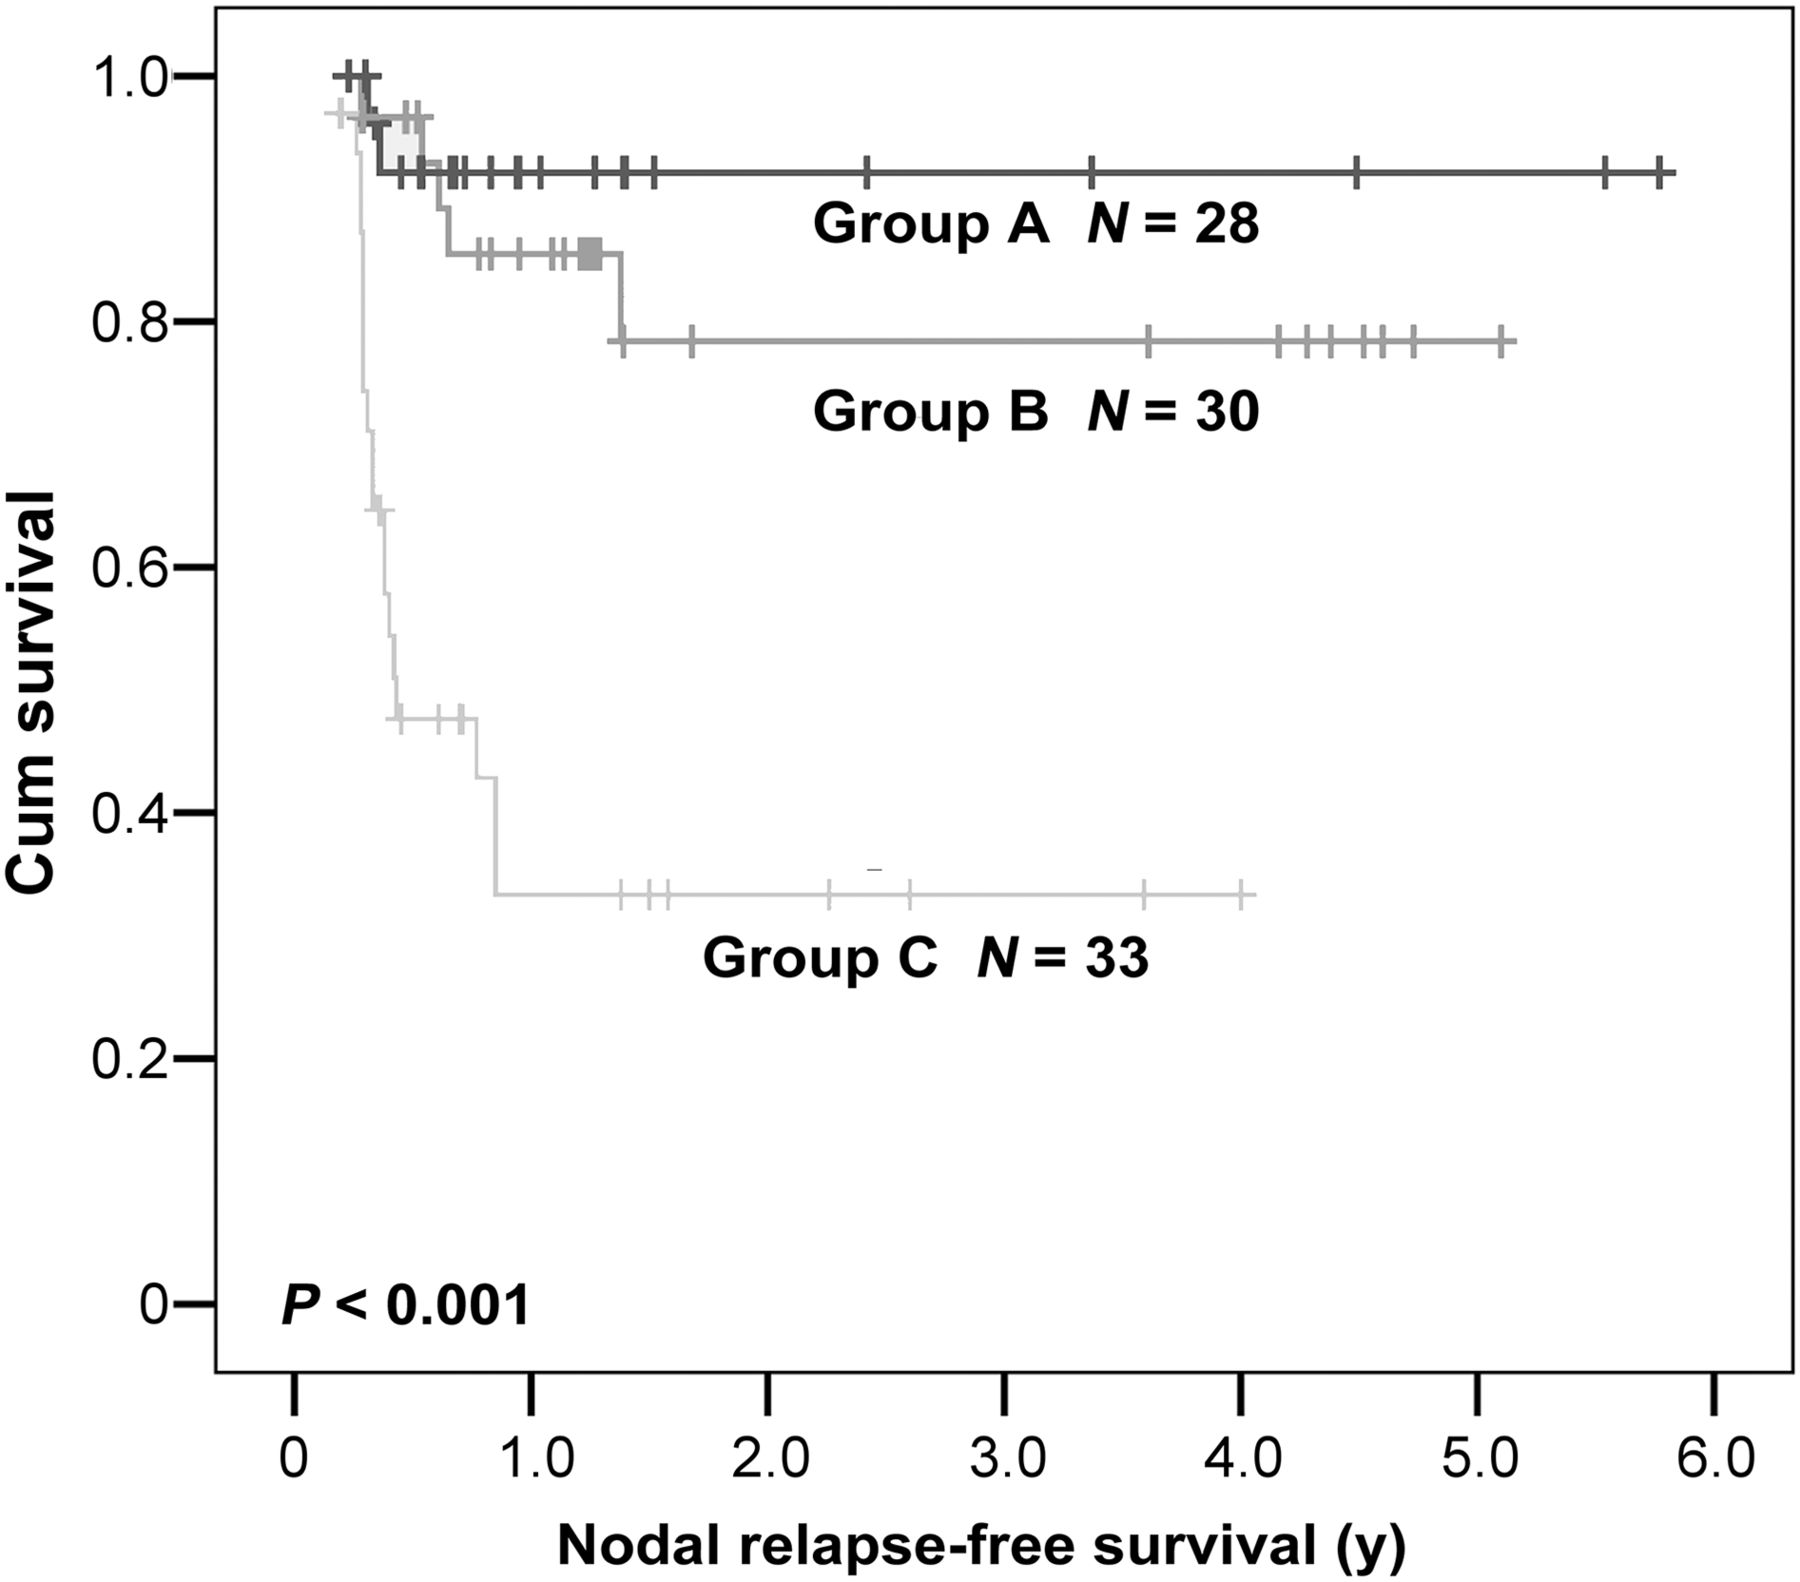
When nodal diseases were stratified with the 2 prognostic factors, patients could be evenly stratified with 3 groups. Group A comprised 28 patients without any adverse features. Group C included 33 patients having both risk factors, and group B consisted of 30 patients having 1 of the 2. The estimated 2-y NRFS was 92% for group A, 78% for group B, and 33% for group C (Fig. 3).

NRFS according to nodal groups (P < 0.001).
DISCUSSION
An advanced nodal stage in patients with head and neck cancers is a well-known adverse factor for survival (14). When investigating the prognostic role of the image-related factors, it would be appropriate to examine all the parameters derived from the primary tumors and MNNs. Because of the insufficiency of using T or N classification alone in assessing the final outcome, we previously reported the clinical implication of CT- and PET/CT-based findings on the control of primary tumor (11). This study further disclosed the efficacy of implementing image-related factors on neck control. Before the evolution of organ preservation, neck nodes could be usually dissected at the same time as excision of primary tumors. To date, neck dissection is commonly reserved for those with residual or recurrent disease after the initial therapy. Therefore, the evaluation of nodal response became crucial to the adequate performance of salvage neck dissection. Although posttreatment CT or PET had a high accuracy in determining the regional control (4–7,15), early recognition of patients at risk for nodal failure after curative nonsurgical treatment can optimize the individual treatment schemes by reducing the number of patients undergoing unsuitable treatment.
The role of several prognostic factors for nodal recurrence after radiotherapy has been investigated. Previous studies showed that nodal size, radiologic signs of extranodal spread, and central necrosis are prognostic factors for regional control (8,9,16–18). Through comprehensive CT- and PET/CT-related parameters with various threshold methods, we first showed that the risk of residual or recurrent neck diseases can be stratified by combining N-TLG40% with radiologic central necrosis. Particularly for patients with any MNNs categorized as group C, alternative modalities can be considered before a decision of definitive chemoradiotherapy/radiotherapy. In addition, for patients having chosen an organ-preservation scheme, a planned neck dissection for the high-risk patients can be discussed earlier. Certainly, further studies are warranted to test our results because of the low sensitivity presented in this study.
A unique advantage of 18F-FDG PET/CT is its ability to automatically create a tumor contour using quantitative information on glucose uptake within the tumor. In patients with head and neck cancers receiving definitive chemoradiotherapy/radiotherapy, the use of pretreatment biologic tumor volume as a predictive factor is not novel. However, few studies have compared comprehensive volumetric and threshold methods to define the optimal approach for MNN. Using receiver-operating characteristic analysis, we first examined the efficacy of various threshold methods for determining the best approach. Then, the predictive abilities of these methods were compared with those derived from CT-related and clinical parameters. To identify the optimal cutoff values for which the sum of sensitivity and specificity was the greatest, undoubtedly, it is essential to enroll more participants prospectively and to use standardized protocols for 18F-FDG PET acquisition and processing. Nonetheless, this is a pilot study to clarify that the N-TLG40% method was better than nodal volume or MTV approaches in predicting NRFS or DFS for these patients. Although other threshold approaches for N-TLG or N-MTV failed to show a superior predictive power in NRFS, compared with the N-TLG40%, all tested threshold methods exhibited a biologic phenotype trend for nodal recurrence. In the era of considering dose escalation for 18F-FDG–avid tumors, Jeong et al. (19) reported a novel outcome-equivalent dose-analysis method to estimate the dose–response modifying effect of 18F-FDG uptake variation. The results of their study provided a rational starting point for the selection of intensity-modulated radiotherapy to be used for 18F-FDG–avid tumors. Their study indicated 18F-FDG–avid tumors are likely to require 10%–30% more dose than 18F-FDG–nonavid tumors to reach equal response rates. Our study presented a clinical basis when considering dose-escalating scheme to the nodes.
A previous study showed that the presence of central hypodense zones on CT correlated well with a high incidence of nodal necrosis (20). On the basis of the same radiologic definition, we demonstrated that nodal control and survivals were significantly associated with central necrosis, as described in previous studies (8,18). Interestingly, our data also showed that radiologic central necrosis was positively associated with several CT and PET/CT parameters including N-GTV, SUVmax, and N-TLG. Theoretically, the hypodense necrotic zones on CT contrast images imply areas of hypovascularity and might harbor hypoxic cells, which could lead to the negative impact on nodal control as hypoxic cells are less radiosensitive (18). Nakajima et al. (21) analyzed tumor cells grown as xenograft in nude mice after the identification of the metabolic response to hypoxia and found 2-deoxyglucose uptake in hypoxic regions of the tumors was approximately 2 times higher than in the whole tumor. They concluded that hypoxia is associated with increased intratumoral metabolic heterogeneities on 18F-FDG PET. Given that the metabolic heterogeneity within the tumors might be an indicator of tumor hypoxia, it is warranted to correlate the heterogeneities with clinical outcome in the future. In addition, the radiologic necrosis needs to be scored, and the association between the score and extent of heterogeneities of 18F-FDG uptake should be investigated further.
This study was subject to numerous limitations, such as a lack of MR image information. The ability of diffusion-weighted MR imaging in improving target volume delineation, early tumor response assessment, and differentiation between normal posttreatment changes suggests an important clinical role in radiotherapy (22). It would be interesting to compare the impact of diffusion-weighted MR imaging on the treatment outcome. In addition, posttreatment PET/CT was not routinely performed for relevant prognostic information. Thus, the changes of PET/CT-related parameters before and after therapy could not be assessed accordingly. Finally, the impact of human papillomavirus (HPV)–related oropharyngeal cancer on prognosis has gained great interest. The effect on prognosis might be stronger than many other factors investigated before, including stage or 18F-FDG uptake. Despite the lower prevalence of human HPV–related oropharyngeal cancer in Asia (22,23), the results would be more robust if information about the HPV status could be included in this analysis. Future studies must use more imaging studies and information of HPV status and adjust for potential confounders in the analysis. In addition, 18F-FDG uptake variability in human tumors may be an indicator of tumor hypoxia, and prognosis, and therefore could be validated in prospective clinical trials. On the basis of our finding, we recommend that treatment modification or an alternative treatment can be considered for patients with a pretreatment N-TLG40% ≥ 38 g or radiologic central necrosis. Such treatment modification may include dose escalation, novel cytotoxic drugs, or the use of adjunctive neck dissection. In this manner, patients for individual treatment schemes can be selected more appropriately.
CONCLUSION
This pilot study shows that the control rate of MNN in patients with head and neck cancer receiving radiotherapy/chemoradiotherapy for organ preservation can be predicted according to radiologic central necrosis on CT scan and N-TLG40% value on PET/CT. The result should be validated in future clinical trials. In this way, patients with the adverse features can be considered for alternative or aggressive treatment.
DISCLOSURE
The costs of publication of this article were defrayed in part by the payment of page charges. Therefore, and solely to indicate this fact, this article is hereby marked “advertisement” in accordance with 18 USC section 1734. We thank the grant support (CMU98-C-13) of the China Medical University and Taiwan Ministry of Health and Welfare Clinical Trial and Research Center of Excellence (MOHW103-TDU-B-212-113002), health and welfare surcharge of tobacco products, and China Medical University Hospital Cancer Research Center of Excellence (MOHW103-TD-B-111-03, Taiwan). No other potential conflict of interest relevant to this article was reported.
Footnotes
↵* Contributed equally to this work.
Published online Jan. 22, 2015.
- © 2015 by the Society of Nuclear Medicine and Molecular Imaging, Inc.
REFERENCES
- Received for publication August 31, 2014.
- Accepted for publication December 26, 2014.


Jump to section
Related Articles
Cited By...
- No citing articles found.