


Abstract
With the introduction of combined PET/MR spectroscopic (MRS) imaging, it is now possible to directly and indirectly image the Warburg effect with hyperpolarized 13C-pyruvate and 18F-FDG PET imaging, respectively, via a technique we have named hyperPET. The main purpose of this present study was to establish a practical workflow for performing 18F-FDG PET and hyperpolarized 13C-pyruvate MRS imaging simultaneously for tumor tissue characterization and on a larger scale test its feasibility. In addition, we evaluated the correlation between 18F-FDG uptake and 13C-lactate production. Methods: Ten dogs with biopsy-verified spontaneous malignant tumors were included for imaging. All dogs underwent a protocol of simultaneous 18F-FDG PET, anatomic MR, and hyperpolarized dynamic nuclear polarization with 13C-pyruvate imaging. The data were acquired using a combined clinical PET/MR imaging scanner. Results: We found that combined 18F-FDG PET and 13C-pyruvate MRS imaging was possible in a single session of approximately 2 h. A continuous workflow was obtained with the injection of 18F-FDG when the dogs was placed in the PET/MR scanner. 13C-MRS dynamic acquisition demonstrated in an axial slab increased 13C-lactate production in 9 of 10 dogs. For the 9 dogs, the 13C-lactate was detected after a mean of 25 s (range, 17–33 s), with a mean to peak of 13C-lactate at 49 s (range, 40–62 s). 13C-pyruvate could be detected on average after 13 s (range, 5–26 s) and peaked on average after 25 s (range, 13–42 s). We noticed concordance of 18F-FDG uptake and production of 13C-lactate in most, but not all, axial slices. Conclusion: In this study, we have shown in a series of dogs with cancer that hyperPET can easily be performed within 2 h. We showed mostly correspondence between 13C-lactate production and 18F-FDG uptake and expect the combined modalities to reveal additional metabolic information to improve prognostic value and improve response monitoring.
As established almost a century ago, cancer cell metabolism differs from normal cells. A central metabolic characteristic in malignant cancer cells is the shift to glycolysis with production of lactate even in the presence of sufficient oxygen (aerobic glucolysis) (1–4), a phenomenon first described by Heinrich Otto Warburg in 1924 (5,6) and later named the Warburg effect. In normal nonhypoxic cells, glucose utilization by oxidative phosphorylation is considerably more efficient in ATP (adenosine triphosphate) production. Therefore, even when cancer cells do not have a higher energy need, 10- to 20-fold-higher amounts of glucose are consumed in these cells than in normal cells (7). This leads to excessive uptake of glucose, which is the foundation for visualization of malignant tumors using the glucose analog 18F-FDG (8,9) with PET (1,3).
Anatomic imaging with CT often in combination with 18F-FDG PET is currently the method of choice in the response evaluation of cancer therapy in patients, although the value of CT is limited because of great variation in anatomic response to treatment (10). A more sensitive and reliable method for noninvasive in vivo imaging of early treatment response and thereby also in drug development is therefore warranted. MR spectroscopy (MRS) is a potent technique for noninvasive in vivo investigation of tissue chemistry and cellular metabolism (11). Dynamic nuclear polarization is capable of creating solutions of molecules with polarized nuclear spins in different nuclei, and it is now possible to do real-time investigation of in vivo metabolism. The development of this technique has increased the nuclear polarization more than 10,000-fold, thus significantly increasing the sensitivity of MRS (12,13). Additionally, the technique allows measurement of the kinetics of the conversion of metabolites and can be combined with proton MR imaging. Various nuclei have been hyperpolarized using the dynamic nuclear polarization technique (14,15). Currently, the most widely used nucleus is 13C because of the possibility of incorporating 13C into relevant compounds. Depending on the tissue, disease, and metabolic state investigated, intravenous injection of hyperpolarized 13C-pyruvate results in an increase of 13C-lactate, 13C-alanine, and 13CO2 resonance peaks (12,16). In particular, direct imaging of the Warburg effect in tumors is possible based on 13C-pyruvate to 13C-lactate conversion (16–19).
With the introduction of combined PET/MR imaging, it is now possible to directly and indirectly image the Warburg effect with hyperpolarized 13C-pyruvate and 18F-FDG PET in a single imaging session as recently shown by us in 1 dog. We named this combined technique hyperPET (20).
With the present study, we aimed at moving from proof of concept in a single dog to establishing a practical workflow and demonstrating the feasibility of hyperPET on a larger scale using a series of 10 dogs with cancer. In addition, we evaluated the correlation between 18F-FDG uptake and 13C-lactate production.
MATERIALS AND METHODS
Study Population
Ten dogs with biopsy-verified spontaneous malignant tumors were included for imaging as part of staging of their tumor. The dog characteristics are given in Table 1. Before hyperPET, the dogs underwent routine staging procedures for their particular tumor except evaluation for distant disease, which was performed as part of the hyperPET protocol.
Characteristics of the Dogs
All dogs underwent a protocol of simultaneous 18F-FDG PET, anatomic MR, and hyperpolarized dynamic nuclear polarization 13C-pyruvate spectroscopic imaging. The data were acquired using a combined clinical PET/MR imaging scanner (mMR Biograph; Siemens). In all cases, hyperpolarized 13C-pyruvate MRS was performed on the primary tumor. Depending on tumor size, 1–3 slabs were studied (Table 2).
Characteristic for All CSI Slices Obtained with Corresponding Standardized Uptake Values, Tumor Size, and CSI Voxel Size
The dogs were premedicated with methadone (0.2 mg/kg intramuscularly), anesthetized using a bolus injection of propofol, and maintained by a continuous intravenous infusion of propofol (15–25 mg/kg/h) or by administration of an air/oxygen-enriched gas mixture with sevoflurane. Heart rate, oxygen saturation, and blood pressure were measured throughout the scanning procedure. MR imaging was performed using a 1H/13C dual tuned flex coil (RAPID Biomedical). For MR flip angle calibration and frequency centering, a 5.5-mL vial of 4.0 M 13C-urea mixed with gadolinium (Dotarem; Guerbet) was placed at the back of the coil. The coil was placed as close as possible to the tumor and centered on the lesion.
The Ethics and Administrative Committee, Department of Veterinary Clinical and Animal Sciences, Faculty of Health and Medical Sciences, University of Copenhagen, approved the study.
Hyperpolarized 13C-Pyruvate Preparation
Hyperpolarized 13C-pyruvate was obtained with a SpinLab (GE Healthcare) using the dynamic nuclear polarization technique. [1-13C]pyruvic acid was mixed with an electron paramagnetic agent (PN AH111501; Syncom). The electron paramagnetic agent concentration in the sample was 15 mM. The dissolution medium consisted of ethylenediaminetetraacetic acid disodium salt dehydrate (0.1 g/L) (PN E4994; Sigma) in water. Before injection, the hyperpolarized 13C-pyruvate was neutralized with 0.72 M NaOH, 0.4 M Tris, and ethylenediaminetetraacetic acid disodium salt (0.1 g/L) in water. The amount injected was 0.68 mL/kg of body weight.
1H MR Imaging
Localizer images and manual 13C flip angle calibration were followed by anatomic 1H MR imaging, including T2 turbo spin-echo (TSE) (repetition time [TR], 4,000 ms; echo time [TE], 89 ms; voxel size, 0.6 × 0.5 mm2; 19 slices of 3-mm thickness) in 3 planes and transverse T1 TSE (TR, 550 ms; TE, 6.5 ms; voxel size, 0.7 × 0.6 mm2; 27 slices of 3-mm thickness). Finally, after acquisition of chemical shift imaging (CSI) and 18F-FDG PET, a transverse fat-saturated T1 TSE with the same parameters as the first T1 TSE was performed after gadolinium injection (0.1 mL/kg [Gadovist]) in most dogs.
18F-FDG PET Imaging
PET was performed as a single-bed, 4- to 10-min acquisition, with intravenous injection of 8 MBq/kg of 18F-FDG. The duration for PET imaging was determined by the maximal approved time of anesthesia of 2 h as stated by the Ethical and Administrative committee, University of Copenhagen. Images were reconstructed using 3-dimensional ordinary Poisson ordered-subset expectation maximization (3D-OP-OSEM), with 4 iterations, 21 subsets, a matrix size of 344 × 344, 4-mm gaussian postprocessing filter, and vendor-supplied attenuation-correction algorithms. The pixel size for PET imaging datasets was 2.1 × 2.1 mm with a 2.03-mm slice thickness.
Dynamic 13C-MRS
In an axially/oblique-oriented 40-mm-thick slab including the tumor region, dynamic 13C-MRS was performed (TR, 1,000 ms; TE, 0.757 ms; flip angle, 5°; bandwidth, 4,000 Hz). The acquisition was repeated for a total duration of 3 min starting at the injection of the hyperpolarized 13C-pyruvate.
13C CSI
For 13C metabolic imaging, 2-dimenisonal CSI was used. 13C CSI was acquired just after 18F-FDG PET and 30–50 s after injection of hyperpolarized 13C-pyruvate (TR, 80 ms; flip angle, 10°; bandwidth, 10,000 Hz; field of view, 80–120 mm; slice thickness, 13–23 mm; matrix, 16 × 16 [circular truncation]; and total imaging time, 11 s). The field of view was adjusted according to the organ of interest. The 30- to 50-s delay was chosen to obtain maximum 13C-lactate signal during CSI based on the previous dynamic 13C-MRS acquisition. When possible within the maximal approved total anesthesia time of 2 h, the CSI was repeated in different parts of the tumor or in metastatic regions. The number of slabs for each tumor is given in Table 2. Peak heights of [1-13C]-pyruvate, [1-13C]-lactate, [1-13C]-alanine, and [1-13C]-pyruvate hydrate were quantified using a general linear model implemented in Matlab (The MathWorks) and applied in the time domain. We reported the magnitude of peak heights resulting from the modeling. When reporting a metabolite ratio, the normalization was performed to the sum of all modeled peak heights.
Postprocessing of 13C CSI and 18F-FDG PET
All 13C CSI datasets were converted to DICOM format. The 18F-FDG PET, 1H MR imaging, and 13C MRS datasets were visualized and analyzed using the open source OsiriX imaging software (version 5.9; PIXMEO). All datasets were automatically fused. CSI voxels with a modeled 13C-lactate and 13C-pyruvate peak height above a threshold of 4 times the SD of noise in a silent region of the spectrum were used in the correlation matrix for each individual dog. The regions of interest derived were hence superimposed and applied to the CSI datasets of 13C-lactate, 13C-pyruvate, and 18F-FDG PET. 18F-FDG uptake was calculated and reported as standardized uptake values according to the following formula: (measured activity concentration [MBq/mL] × body weight [g]/injected activity [MBq]) × 1,000 (g/kg). Mean, minimum, and maximum uptake values of 18F-FDG were determined. Values obtained from the 13C MR metabolite images were expressed in arbitrary units.
A voxel-per-voxel correlation analysis was performed comparing the 18F-FDG PET and 13C CSI datasets. Each slice consisted of 16 × 16 voxels of 5.0 × 5.0 to 10.0 × 10.0 mm. All statistical analyses were performed in SPSS Statistics (version 22; IBM). A P value of less than 0.05 was considered significant. For time analysis, dynamic 13C-MRS curves were noise-filtered with a gaussian having a full width at half maximum of 1.5 s.
RESULTS
HyperPET Workflow
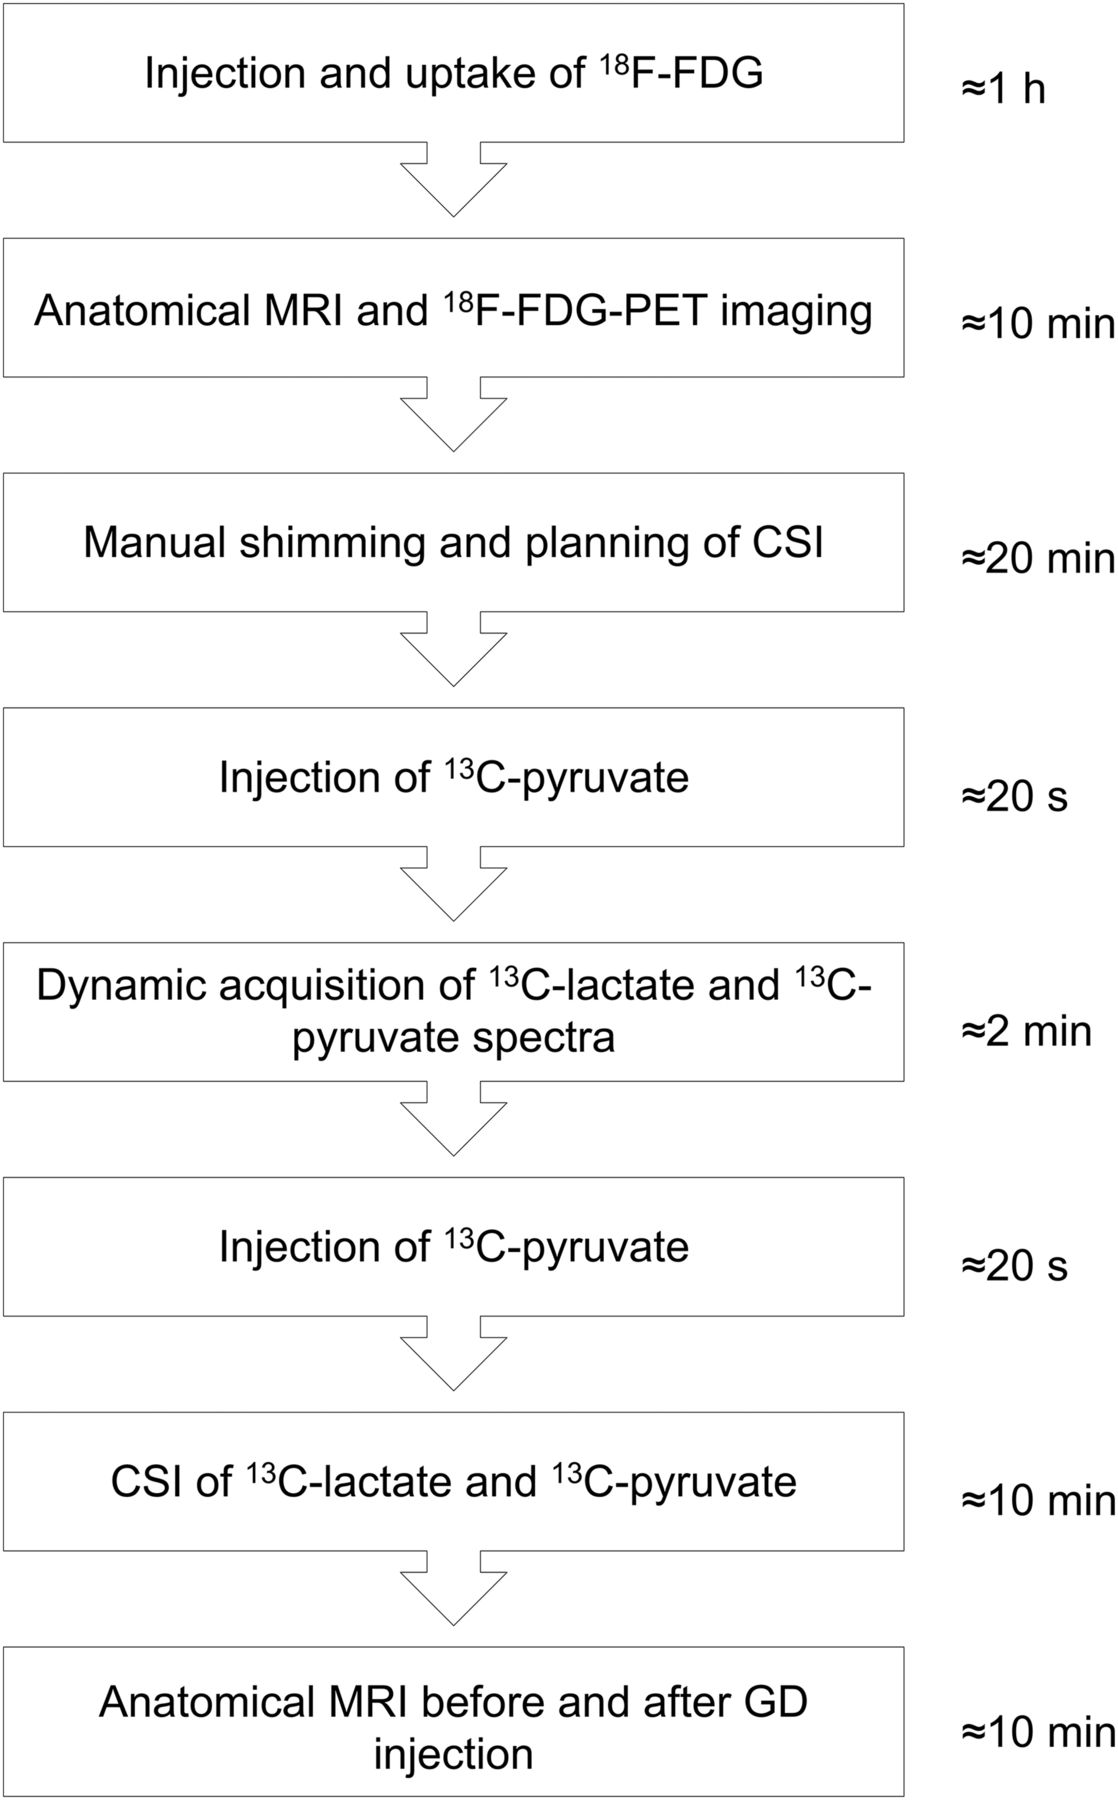
We found that combined 18F-FDG PET and 13C-pyruvate MRS imaging was possible in a single session of approximately 2 h. A continuous workflow was obtained with injection of 18F-FDG after the dog was placed in the PET/MR scanner. An outline of the workflow is shown in Figure 1.

Workflow of hyperPET acquisition. GD = gadolinium.
Positioning of the coil, induction of anesthesia, positioning of the dog, and PET/MR imaging planning were achieved initially and lasted approximately 1 h. After approximately 60 min, an 18F-FDG PET/MR scan lasting 4–10 min was acquired. 1H MR imaging and 18F-FDG PET acquisition were performed simultaneously. Manual shimming and planning of the CSI took approximately 20 min and was immediately followed by dissolution and injection of 13C-pyruvate that took less than 30 s in our setup. Acquisition of dynamic 13C-lactate and 13C-pyruvate spectra lasted less than 10 min. 13C-lactate and 13C-pyruvate CSI was repeated 2–3 times and lasted approximately 10 min. Finally a T1 TSE sequence before and after gadolinium injection was performed that lasted less than 10 min.
13C MRS Dynamic Acquisition
13C MRS dynamic acquisition demonstrated in the axial slab an increased 13C-lactate production in 9 of 10 dogs. For dog 6, no 13C signal was observed in the dynamic spectra because of an erroneous calibration of the flip angle.
The dynamic acquisition provided spectra from the axial slab (with a time resolution of 1 s) that covered the tumor region and surrounding tissues. These dynamic data showed reproducible uptake of hyperpolarized 13C-pyruvate in the tumor and the conversion to hyperpolarized 13C-lactate as demonstrated in Figure 2 (dog 8). In this dog, during dynamic acquisition 13C-pyruvate was seen 20 s after the injection of the 13C-pyruvate bolus, with a peak at 24 s. 13C-lactate appeared after 25 s and reached a maximum about 40 s after injection of the 13C-pyruvate bolus.
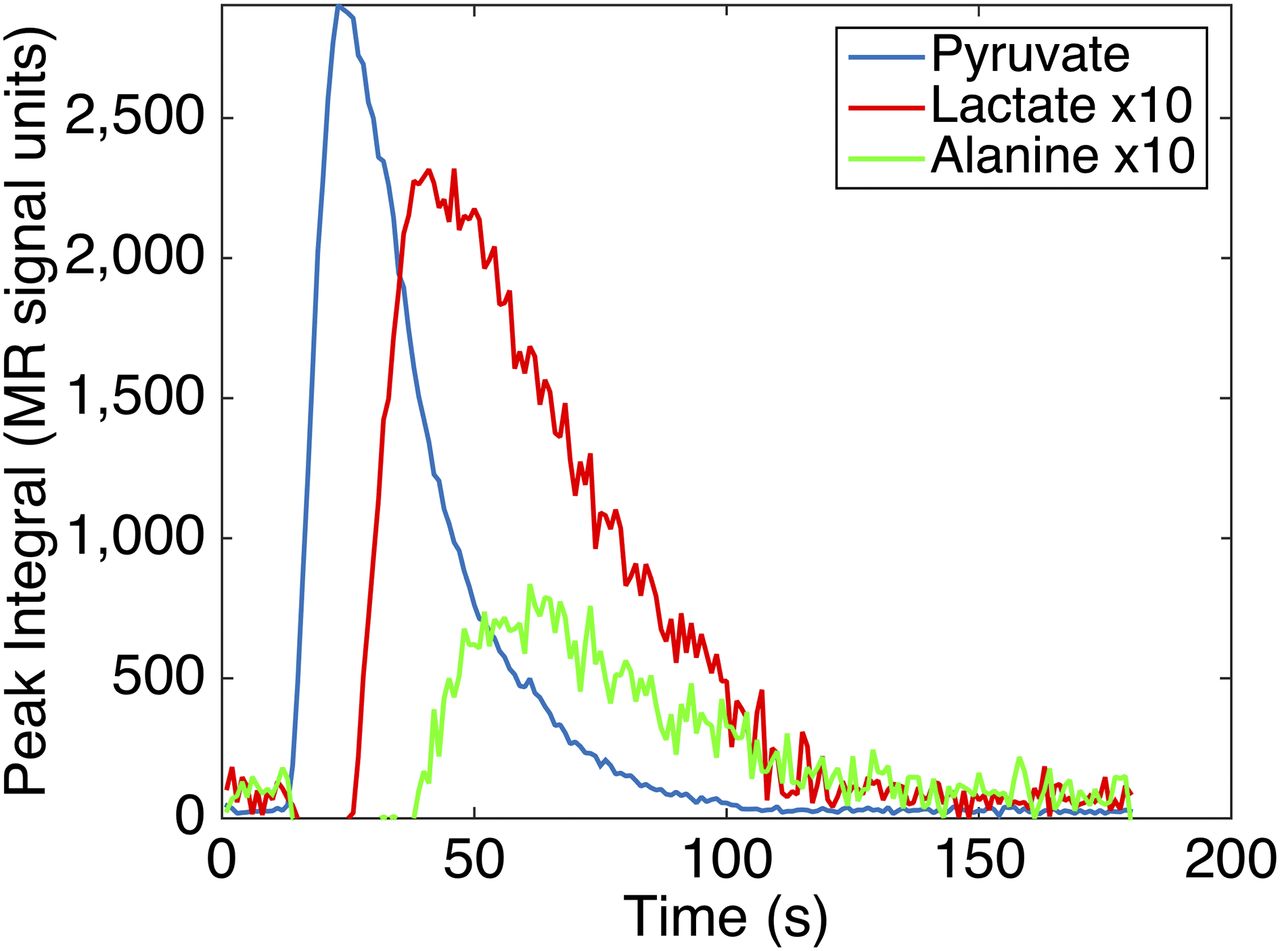
Typical graph of dynamic acquisition from axial slab through sarcoma in tonsil (dog 8). Graphs are generated from a slab through single lesion biopsy–verified tumor and of nonmalignant tissue. 13C-pyruvate was seen 20 s after injection of 13C-pyruvate bolus and peaked at 24 s. 13C-lactate appeared after 25 s and reached maximum about 40 s after injection of 13C-pyruvate bolus.
For the 9 dogs, the 13C-lactate was seen initially after a mean of 25 s (range, 17–33 s), with a mean peak of 13C-lactate after 49 s (range, 40–62 s), whereas the 13C-pyruvate initially was seen after a mean of 13 s (range, 5–26 s), with peak after a mean of 25 s (range, 13–42 s) (Table 3).
Time to Peak, Time to Initiate, and Ratio Peak Values of 13C-Lactate and 13C-Pyruvate for All Dogs
13C MRS Imaging and 18F-FDG PET
The metabolite images (Figs. 3 and 4; Supplemental Fig. 1; supplemental materials are available at http://jnm.snmjournals.org) are a result of an interpolation of the 16 × 16 voxels. In the 13C-lactate/13C-pyruvate image, voxels with a ratio based on signal in the level of pure noise have been removed from the interpolated overlays.

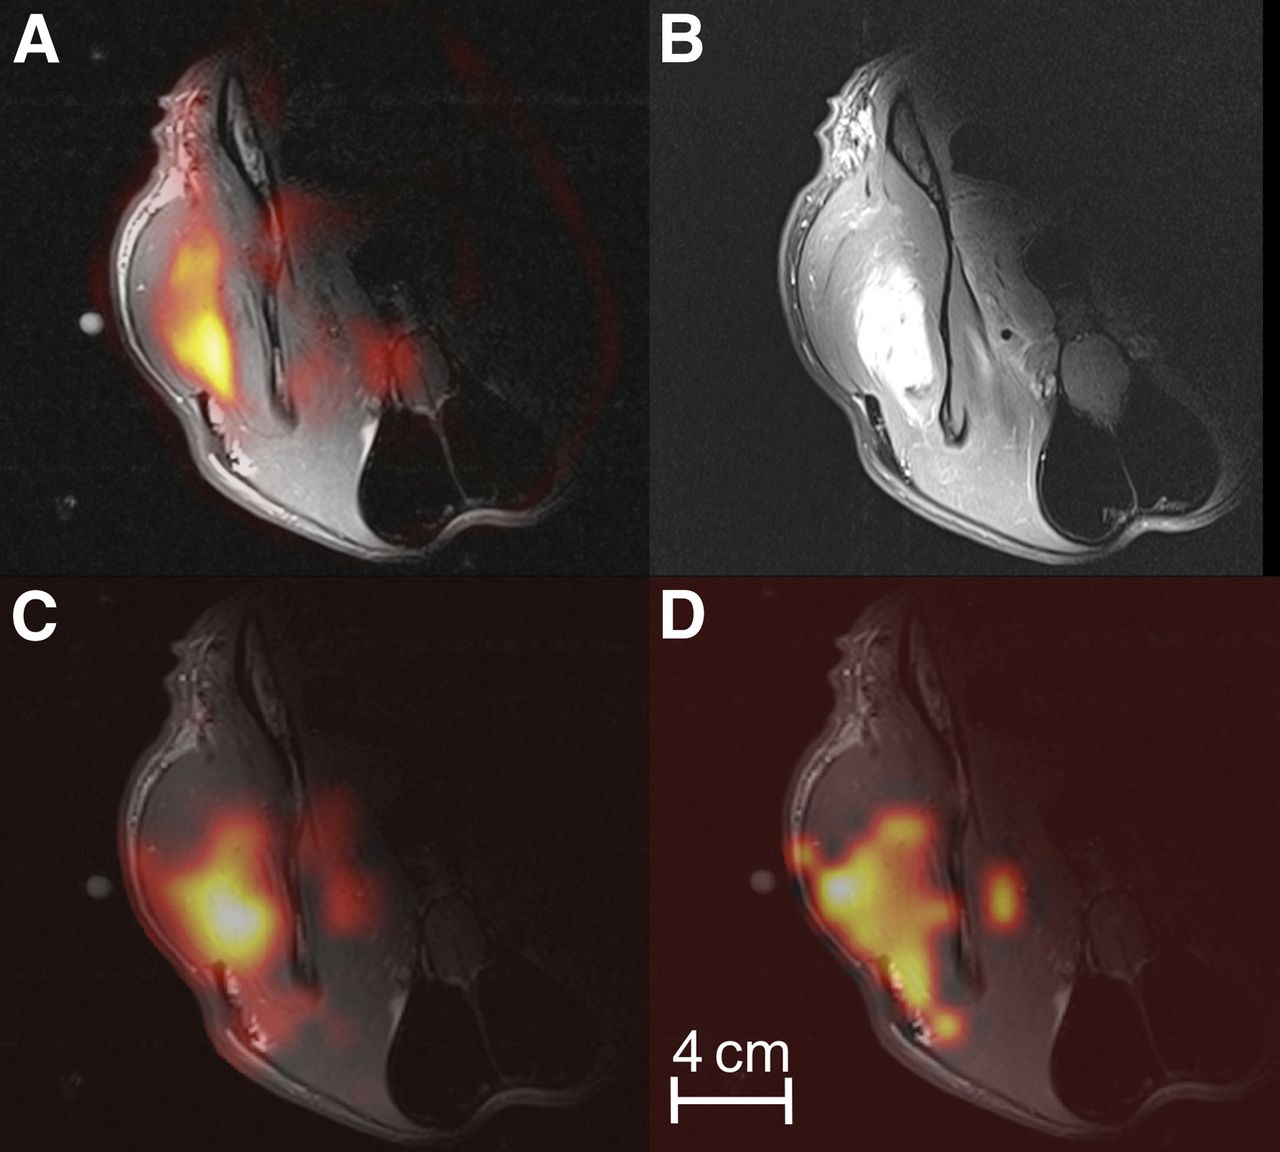
Axial slab of sarcoma located on hind leg (dog 4, slice 1). Imaging of 18F-FDG PET/MR (A), CSI of 13C-lactate (B), 13C-pyruvate (C), and ratio of 13C-lactate to 13C-pyruvate (D) demonstrate heterogeneous uptake of 18F-FDG, which partly corresponds to 13C-lactacte production. CSI and 18F-FDG PET pixel sizes are 7.5 × 7.5 and 2.1 × 2.1 mm, respectively.
Axial slice of dog 7 (slice 1), demonstrating relatively homogeneous uptake of 18F-FDG (A: 18F-FDG PET/MR) in intramuscular fibrosarcoma located in neck. Corresponding gadolinium uptake in tumor as demonstrated in T1 (TSE) image can be seen in B. Also 13C-lactate (C) and ratio of 13C-lactate to 13C-pyruvate (D) were relatively homogeneously distributed. CSI and 18F-FDG PET pixel sizes are 7.5 × 7.5 and 2.1 × 2.1 mm, respectively.
We noticed voxel-by-voxel concordance of 18F-FDG uptake and production of 13C-lactate in most axial slabs. This is illustrated in dog 4 (Fig. 3), in whom a heterogeneous uptake of 18F-FDG PET in a sarcoma located on the hind limb partly corresponded to 13C-lactacte production (Fig. 3). Additionally, we found a voxel-by-voxel association between maximum uptake of 18F-FDG and the ratio of 13C-lactate to 13C-pyruvate (r = 0.62, P < 0.0001) in the same axial slab as illustrated in Figure 5.
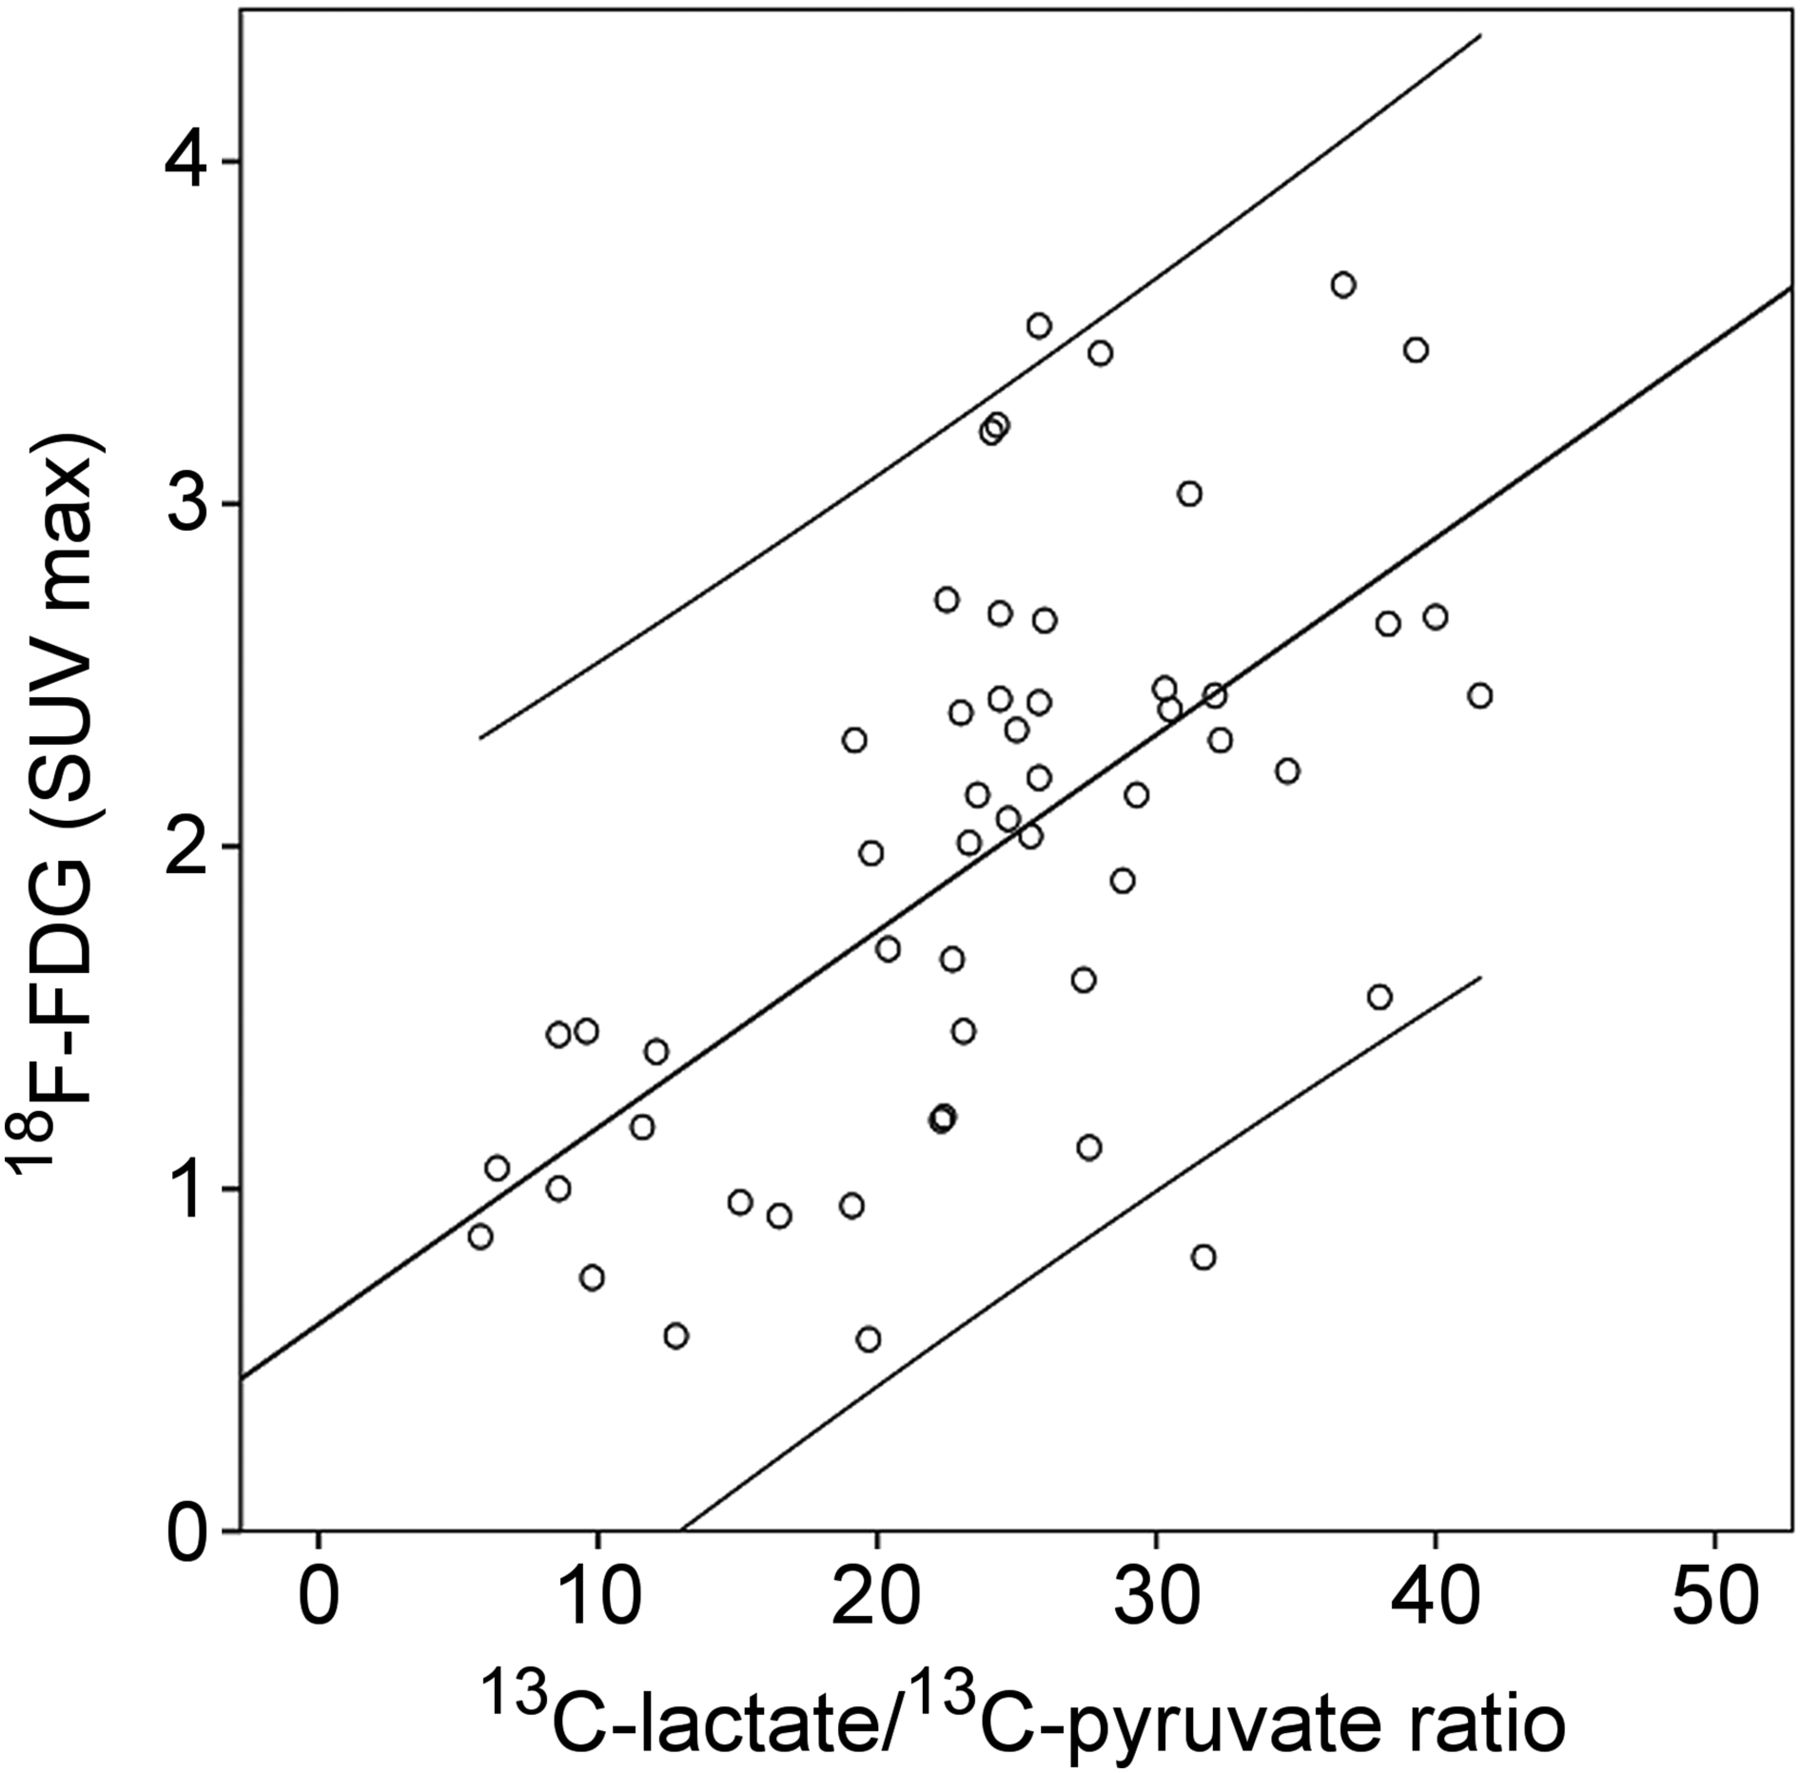
Scatterplot showing significant correlation of maximum uptake of 18F-FDG and ratio of 13C-lactate to 13C-pyruvate in 16 × 16 voxels (size, 7.5 × 7.5 mm) in single slice of sarcoma (dog 4, axial slice 1). Lines are 95% individual prediction intervals. r = 0.62; P < 0.0001. SUV = standardized uptake value.
In dog 7, we were able to demonstrate a more homogeneous uptake of 18F-FDG in a fibrosarcoma located intramuscularly in the neck (Supplemental Fig. 1). This uptake strongly correlated with the production of 13C-lactate as illustrated in the scatterplot in Supplemental Figure 2 (r = 0.78; P < 0.0001). In dog 8 with tonsil cancer and a lymph node metastasis, we demonstrated an increased 13C-lactate production in the metastasized lymph node. We found that the 13C-lactate production and the CSI 13C-lactate–to–13C-pyruvate ratio matched the uptake of 18F-FDG, and it was possible to visualize the central necrotic core of the lymph node as also demonstrated in the anatomic MR imaging sequence. There was loss of 13C signal in the profound part of the neck and tumor due to the profile of the dual tuned surface coil.
DISCUSSION
To our knowledge, this is the first study acquiring both 13C-lactate/13C-pyruvate CSI and 18F-FDG PET imaging in consecutive spontaneous malignant tumors using a combined clinical PET/MR scanner. We were able, with a workflow of approximately 2 h, to visualize in real time the in vivo metabolism of 13C-pyruvate and its conversion into 13C-lactate in 9 consecutive dogs. This study therefore demonstrates that tumor imaging with hyperPET is feasible for dogs with biopsy-verified spontaneous tumors.
Rather than using mice with human xenograph tumors, we used naturally developing malignant cancers in dogs as a model for human disease. Cancer-bearing dogs represent a unique clinical cancer model with a direct potential for accelerating translation into human patients (21). This is because companion dogs with spontaneous cancer resemble the heterogeneity in human cancers, with similarity of metastasis, local invasion, tumor stromal interaction, and resistance to therapy. Therefore, the current study also indicates that our new workflow will be feasible in human cancer patients. As an added benefit, the information gained by PET/MR supported dog management including prognostication and therapy planning for each of the dogs.
We have in this study demonstrated that 18F-FDG uptake and 13C-lactate production were somewhat concordant in most of the assessed cancers. However, we also showed that 18F-FDG uptake and 13C-lactate differ in some cases, which underlines the different processes visualized by the 2 modalities and the potential added value of combining the methods. Whereas increased glucose uptake (18F-FDG) is a compound measure of several hallmarks of cancer (22), for example, cell proliferation, hypoxia, and metabolic changes, measured 13C-pyruvate to 13C-lactate conversion probably demonstrates the Warburg effect per se. Prostate, neuroendocrine, and cerebral tumors are potential cancer forms that might benefit from hyperPET using PET tracers other than 18F-FDG, thereby obtaining a more detailed characterization of cancer in a 1-stop-shop scan. The better characterization can be used for personalizing therapy and evaluation of treatment response.
The relatively large voxel size of CSI compared with 18F-FDG PET allowed only for rough correlation analyses.
From a practical viewpoint, hyperPET may seem unrealistic to perform as a clinical routine. However, we were able to perform hyperPET within a 2-h time slot. This workflow even included a 13C-pyruvate injection and dynamic acquisition to establish the time point for the following high-resolution CSI. Variations in time–concentration curves are probably due to differences in cardiovascular status, size of animal, perfusion of tumor, and malignancy grade of the tumor. The acquisitions can currently not be performed in a single session. Accordingly, in our study we evaluated the variation in the peak of 13C-lactate to see whether a fixed time point would be possible to use. The peak was observed between 40 and 62 s (average, 49 s) after 13C-pyruvate injection, possibly indicating that a fixed time point of approximately 50 s could be used, which could remove the necessity of performing an individual dynamic scan. If 50 s had been used, 7 of 9 dogs had a 13C-lactate level above 90% of peak (Table 3). This is a minor deviation, and therefore we suggest that use of a fixed time point is feasible. Using a fixed time point will save both time and 1 production of hyperpolarized 13C-pyruvate per dog, simplifying the workflow even more.
Ideally, more advanced MR imaging sequences will allow for faster, volumetric and repeated spectroscopic imaging (23,24). Such MR imaging sequences consequently permit for larger spatial resolution and additional detailed characterization of the tumor metabolism. However, newer sequences, which are able to demonstrate the dynamics of the metabolism, are aimed to be developed and to be used in future studies. Until then we support a fixed time point based on pilot studies.
Another challenge of CSI is loss of signal. In an approximately 5-cm depth, 50% of the signal is lost due to the coil profile of the surface coil used in this study. However, most of the tumors investigated were located at or close to the surface of the animal, and therefore we were able to gain sufficient signal. However, other coils, for example, body coils, need to be applied if larger and more profound tumors are to be evaluated.
Recently, a first-in-human 31-patient study was conducted with the primary objective to assess the safety of hyperpolarized 13C-pyruvate in healthy subjects and prostate cancer patients. The study showed an elevated 13C-lactate–to–13C-pyruvate ratio in regions of biopsy-proven prostate cancer (19). However, so far the technique has never been combined with PET in humans.
Only preclinical comparisons have been performed and that being on separate PET and MR systems (25,26), with potential errors arising from the time difference between the examinations and the repositioning of the animal. Admittedly, it may not be with 18F-FDG that the time difference is the largest challenge but with other potential PET tracers to be combined with CSI. The introduction of integrated clinical PET/MR systems allows for single-session, simultaneous MR imaging and PET.
HyperPET first described by us and now performed in a series of 10 dogs with cancer may soon be translated into human patients. Whether the combined modalities are better than CSI or PET alone remains to be proven. However, the different processes visualized indicate that better prognostic value and early response monitoring may be obtained. An outline of the concept of hyperPET imaging is presented in Figure 6.

Concept of hyperPET and characterization of Warburg effect. Whereas increased 18F-FDG uptake is compound measure of several hallmarks of cancer, for example, cell proliferation, hypoxia, and metabolic changes, measured 13C-pyruvate to 13C-lactate conversion probably demonstrates the Warburg effect per se. GLUT = glucose transporters; LDH = lactate dehydrogenase; MCT = monocarboxylate transporters. Modified from Gutte et al. (20).
CONCLUSION
In this study, we have shown in a series of dogs with cancer that hyperPET can easily be performed within 2 h. We showed some but not total correspondence between 13C-lactate production and 18F-FDG uptake, indicating that the compound measure may carry additional information for better prognostication, tumor characterization, and response monitoring in cancer.
DISCLOSURE
The costs of publication of this article were defrayed in part by the payment of page charges. Therefore, and solely to indicate this fact, this article is hereby marked “advertisement” in accordance with 18 USC section 1734. Financial support was provided by the John and Birthe Meyer Foundation, the Capital Region of Denmark, Research Council of Rigshospitalet, the Novo Nordisk Foundation, the Lundbeck Foundation, the Svend Andersen Foundation, the Arvid Nilsson Foundation, the Danish Cancer Society, the Danish Council for Independent Research, and the Innovation Foundation. No other potential conflict of interest relevant to this article was reported.
Acknowledgments
We acknowledge Karin Stahr, Marianne Federspiel, Jakup Poulsen, Pernille Holst and Betina Senius Pedersen for invaluable technical assistance.
Footnotes
Published online Sep. 3, 2015.
- © 2015 by the Society of Nuclear Medicine and Molecular Imaging, Inc.
REFERENCES
- Received for publication March 23, 2015.
- Accepted for publication August 13, 2015.


