


Abstract
Radiopharmaceutical pharmacokinetics are usually approximated by sums of discrete first-order rates, using 3 or more parameters. We hypothesized that pharmacokinetic processes can be modeled even better by continuous probability distributions (CPD) of rates, using only 1–2 parameters. Methods: To test this hypothesis, we used biodistribution data for 188Re-labeled melanin-specific antibody in blood, kidneys, liver, bone marrow, and lungs of melanoma xenograft–bearing mice. We used 3 discrete-rate models (monoexponential, monoexponential with constant, and biexponential) and 4 CPD models (stretched-exponential, modified stretched-exponential, simplified versions of stretched-exponential, and modified stretched-exponential). They were compared by sample-size-corrected Akaike information criterion. Total time integrals of radioactivity were computed for each model and averaged across all models. Results: The ratio of weights of evidence for CPD versus discrete-rate models was high for blood (12.2) and lungs (2.7), almost unity (0.99) for bone marrow, and slightly lower for kidneys (0.81) and liver (0.73). In all organs or tissues except lungs, model-averaged time integrals were 12.7%–54.0% higher than biexponential model estimates. Conclusion: Simple CPD models often outperform more complex discrete-rate models on pharmacokinetic data. Radioactivity time integrals are more robustly estimated by multimodel inference than using any single model.
Pharmacokinetics of radiopharmaceuticals (e.g., radioimmunotherapy agents) are assumed to follow first-order kinetics and are, therefore, approximated by the sum of discrete rates (1–3). However, the existence of first-order kinetics does not necessarily imply the existence of only a few discrete rates. Instead, complex decay patterns may result from a continuous probability distribution (CPD) of first-order rates (4,5). “Depending on the level of precision, a decay can be fitted with a sum of 2 or 3 exponentials with satisfactory χ2 values and weighted residuals despite the existence of an underlying distribution” (5).
We hypothesized that pharmacokinetic processes can be modeled even better by CPDs of rates using only 1–2 parameters than by sums of discrete rates using 3 or more parameters. To test this hypothesis, we used data on biodistribution of 188Re-labeled antibody to melanin in athymic melanoma xenograft–bearing mice (6,7).
We used 7 models to fit the data. Three of them assumed discrete pharmacokinetic rates, and 4 assumed CPDs. We compared the performances of these models, and their predictions for the total time integral of radioactivity (which is needed for radiopharmaceutical dosimetry), using information theoretic methods. Our results provide new insight into modeling of radiopharmaceutical pharmacokinetics.
MATERIALS AND METHODS
Datasets
The biodistribution studies analyzed here were published (6) and are described in the supplemental data (supplemental materials are available at http://jnm.snmjournals.org). Briefly, athymic mice (maintained in accordance with regulations of the Albert Einstein College of Medicine Institute for Animal Studies) bearing human A2058 cell–derived melanomas were given 188Re-labeled melanin-specific antibodies. Pharmacokinetic data for the blood and other organs/tissues were obtained by counting the γ activity in each organ/tissue. The radioactivity concentrations were expressed as percentage injected dose per gram, calculated by dividing the radioactivity counts in the whole organ/tissue by the counts in the total administered dose, and by the weight of the organ/tissue. The resulting datasets (one set for each organ/tissue) were sufficiently large (23–106 data points, collected over 5 min to 48 h after radioactivity administration) to support a statistical analysis using mathematical models.
Data Analysis
Radioactivity pharmacokinetics can be approximated by 2 phases. The first is distribution, during which the radioactive material spreads throughout various organs/tissues, reaching organ-specific concentrations. The second is elimination, during which the material is eliminated by biochemical processes and by physical radioisotope decay. Ideally, both phases should be described by suitable mathematical models. However, the main focus of the current paper was on the second (elimination) phase—namely to investigate whether this phase can be reasonably described by formalisms that assume CPDs of first-order rates and to compare the performance of such formalisms to that of the commonly used sum of 2 discrete rates. Consequently, the distribution phase was left beyond the scope of the paper. We intend to include it in future research.
To focus on the elimination phase, we selected 5 organs/tissues (blood, kidneys, liver, bone marrow, lungs) with clinical relevance regarding radiation-induced toxicity, in which the distribution phase is rapid and maximum radioactivity concentrations are reached within 5 min after radioactivity administration. To avoid modeling these organ-specific concentrations, we normalized the data as follows: Eq. 1Here, Ci(j,T) is the radioactivity concentration, in the i-th organ/tissue of the j-th mouse, measured T minutes after radioactivity administration. t is the decay time defined as t = T – 5 min; and Fi(j,t) are the normalized (unitless) radioactivity data, which were fitted by the mathematical formalisms described below. The variability of radioactivity concentrations at 5 min after administration Ci(j, 5) was substantial but not dramatic (supplemental data).
The normalized data Fi(j, t) were not corrected for physical decay of 188Re, and instead this decay was incorporated explicitly into each model as the function g(t) = exp[–(ln(2)/τ0)t], where τ0 is the known 188Re half-life (τ0 = 1,014 min). This approach was previously shown to produce more accurate results (8).
The data normalization allows 1 adjustable parameter (organ-specific maximal radioactivity concentration) to be removed from all models. We believe that this is a reasonable and useful simplification, appropriate for organs/tissues in which the radioactivity distribution phase is rapid. For completeness, we also performed data analysis without normalization, using Ci(j, T) instead of Fi(j, t) and adding an extra parameter representing the organ-specific maximal radioactivity concentration to all models. This extra parameter was inserted into model equations as a multiplicative factor, and the time variable t was replaced by T.
Mathematical Models
Because the organs/tissues differ from each other by size, blood perfusion, and other factors, the data from each organ/tissue were fitted separately, producing organ-specific model parameter values. We used the following 7 mechanistically plausible pharmacokinetic models, described in detail in the supplemental data and summarized in Table 1. The first 3 are monoexponential (ME) and monoexponential with added constant (MEC), both with a single first-order rate, and biexponential (BE), with 2 first-order rates.
Summary of Mathematical Models
The fourth formalism is the stretched exponential (SE), which assumes a CPD of pharmacokinetic rates. The first use of this model is credited to Rudolph Kohlrausch in the 19th century (9), and it is used in physics and chemistry to describe complex decay patterns (4,5). This model predicts that pharmacokinetics have faster-than-exponential behavior at short times but slower-than-exponential behavior at long times. The CPD shape is determined by an exponent parameter γ1 (5).
The fifth model is modified SE, which we call MSE, in which nearly exponential behavior replaces faster-than-exponential behavior at short times (5). The last 2 models are the simplified SE and MSE (called SSE and SMSE, respectively), in which the exponent parameters in SE and MSE models equal 1/2, thereby reducing the number of adjustable parameters. The situation when the exponent parameter equals 1/2 is a special case for which the rate distribution can be expressed using elementary functions (supplemental data) (5).
Model-Fitting Procedure
The mathematical models were fitted to normalized data Fi(j, t) for each organ/tissue separately by maximizing the log likelihood using Maple 17 software (Maplesoft). Details of the procedure are described in the supplemental data.
Information Theoretic Model Selection
Support for each model from the data was assessed using the sample-size-corrected Akaike information criterion (AICc) (10,11). For comparing nonlinear models, AICc is preferable to reduced χ2 or R2 (12–15). AICc is rooted in information theory and assesses how much Kullback–Leibler information is lost when each model is used to approximate the data. The model that loses the least amount of information, relative to other compared models, has the lowest AICc and is considered the best. AICc values can also be converted to Akaike weights, which quantify the weight of evidence supporting each model within the set of tested models. Larger Akaike weights correspond to lower AICc scores and represent more parsimonious fits; the weights sum to 1 across models. Details about the calculation and application of AICc and Akaike weights are provided in the supplemental data.
Multimodel Inference for Time Integral of Radioactivity
The time integral for radioactivity over all decay times is needed to calculate the cumulative radiation dose to each organ/tissue (1,2). This calculation is usually done by choosing a model (e.g., BE formalism), fitting it to data, and integrating over time from zero to infinity (1,2). Here we focused on investigating whether alternative models can describe the data as well as (or better than) the BE model. We expected substantial model selection uncertainty, such that several models have substantial support from the data, with none of them favored overwhelmingly. This expected pattern was indeed found, as described below. In such situations, multimodel inference, which involves averaging predictions from all models weighted by the Akaike weight for each model, is a useful extension of information theoretic model selection (2,11). Here, we used multimodel inference (described in more detail in the supplemental data) to produce model-averaged time integrals.
RESULTS
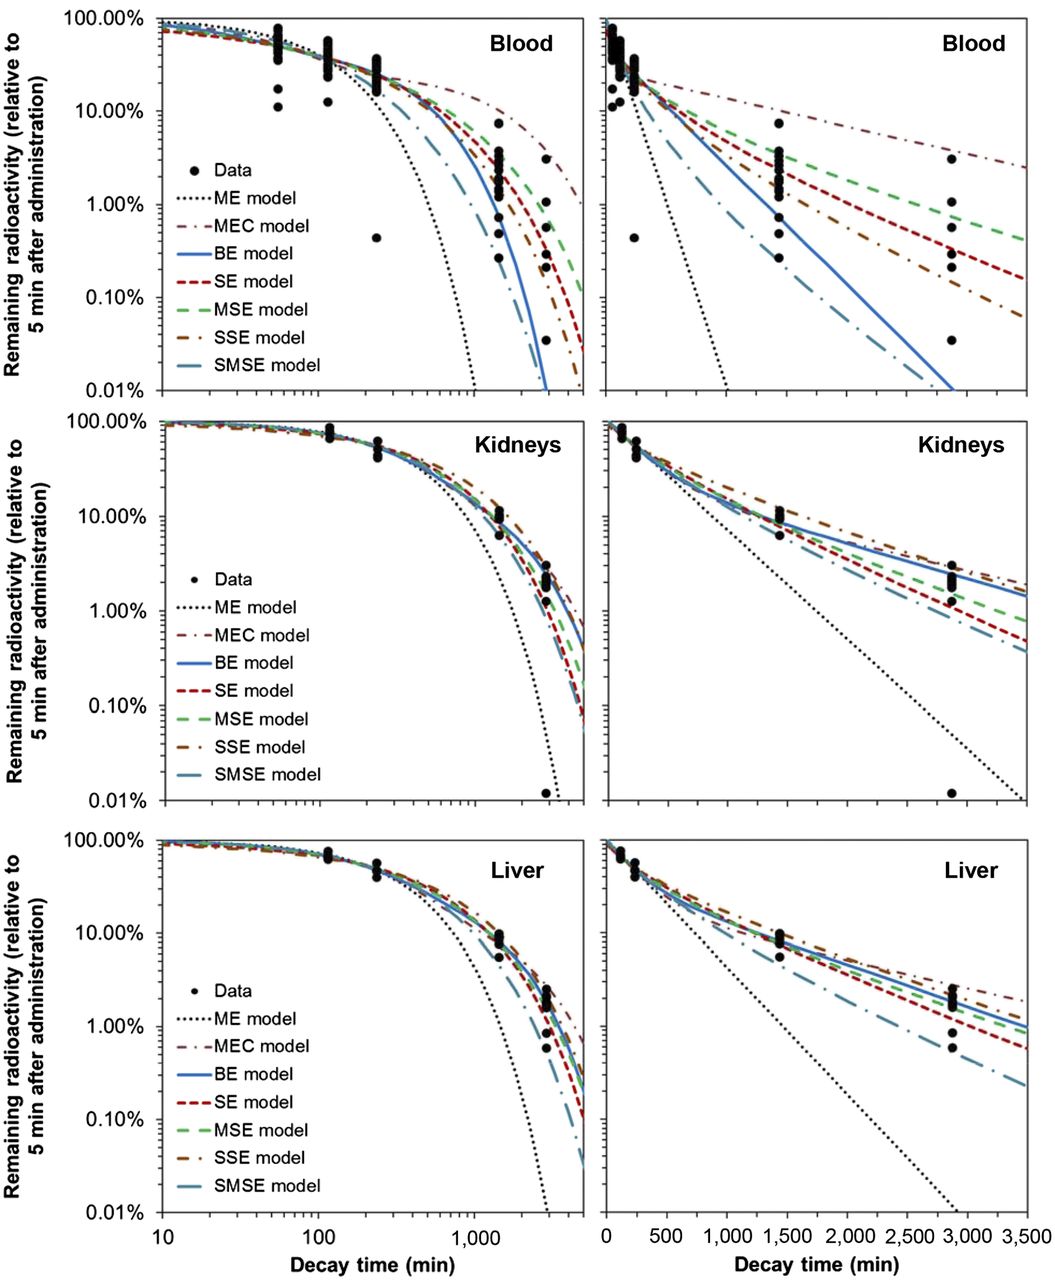
Visual inspection of model fits to blood data (Fig. 1) suggests that the SE and SSE models described the pharmacokinetics better than other tested formalisms. Information theoretic analysis supported this conclusion (Table 2): the SSE model had the highest Akaike weight, followed by the SE model, indicating that these models had the strongest support from the data. The worst-fitting formalisms were the ME, SMSE, and MEC models, which had virtually zero support from the data (Fig. 1; Table 2). These model selection results were not affected by excluding the low-outlier data point at 2,880 min. The combined weight of evidence for CPD models (the sum of Akaike weights for SE, MSE, SSE, and SMSE formalisms) was 12.2-fold higher than the combined weight of evidence for discrete-rate models (ME, MEC, and BE).

Data and best-fit model predictions for pharmacokinetics of 188Re-labeled antibody to melanin in mouse blood, kidneys, and liver. Model abbreviations are described in Table 1 and in main text. Data and curves in left and right panels are same, and panels differ only by linear or logarithmic scaling of t-axis.
Comparisons of Model Performance
The commonly used BE model described the blood data reasonably at short decay times but underestimated them at long times (Fig. 1). This behavior resulted in reduced fit quality for the BE model relative to the SSE model (ΔAICc of 3.5, Table 2). Because the BE model assumes 2 discrete rates (fast and slow), its predictions at long times are dominated by the slow rate. In contrast, the SSE model assumes a CPD. Consequently, its predictions at long times are more flexible, even though the SSE model has only 1 adjustable parameter, whereas the BE model has 3 (Table 1).
A visual comparison of the best-fit rate distributions from the SSE and BE models for blood data is shown in Figure 2. The rate distribution underlying the SSE model in this case resembles the lognormal distribution, with a somewhat enlarged tail toward larger rates. The distribution underlying the BE model in this case is almost a 50:50 combination of 2 discrete peaks, which represent rates roughly an order of magnitude apart (Fig. 2; Table 2).

Distributions of pharmacokinetic rates predicted for blood data by BE and SSE models, using best-fit parameter values (Table 2). For BE model, heights of both peaks sum to 1. For SSE model, probability density function was normalized (divided by its maximum value) to facilitate visual comparison with BE model on same scale.
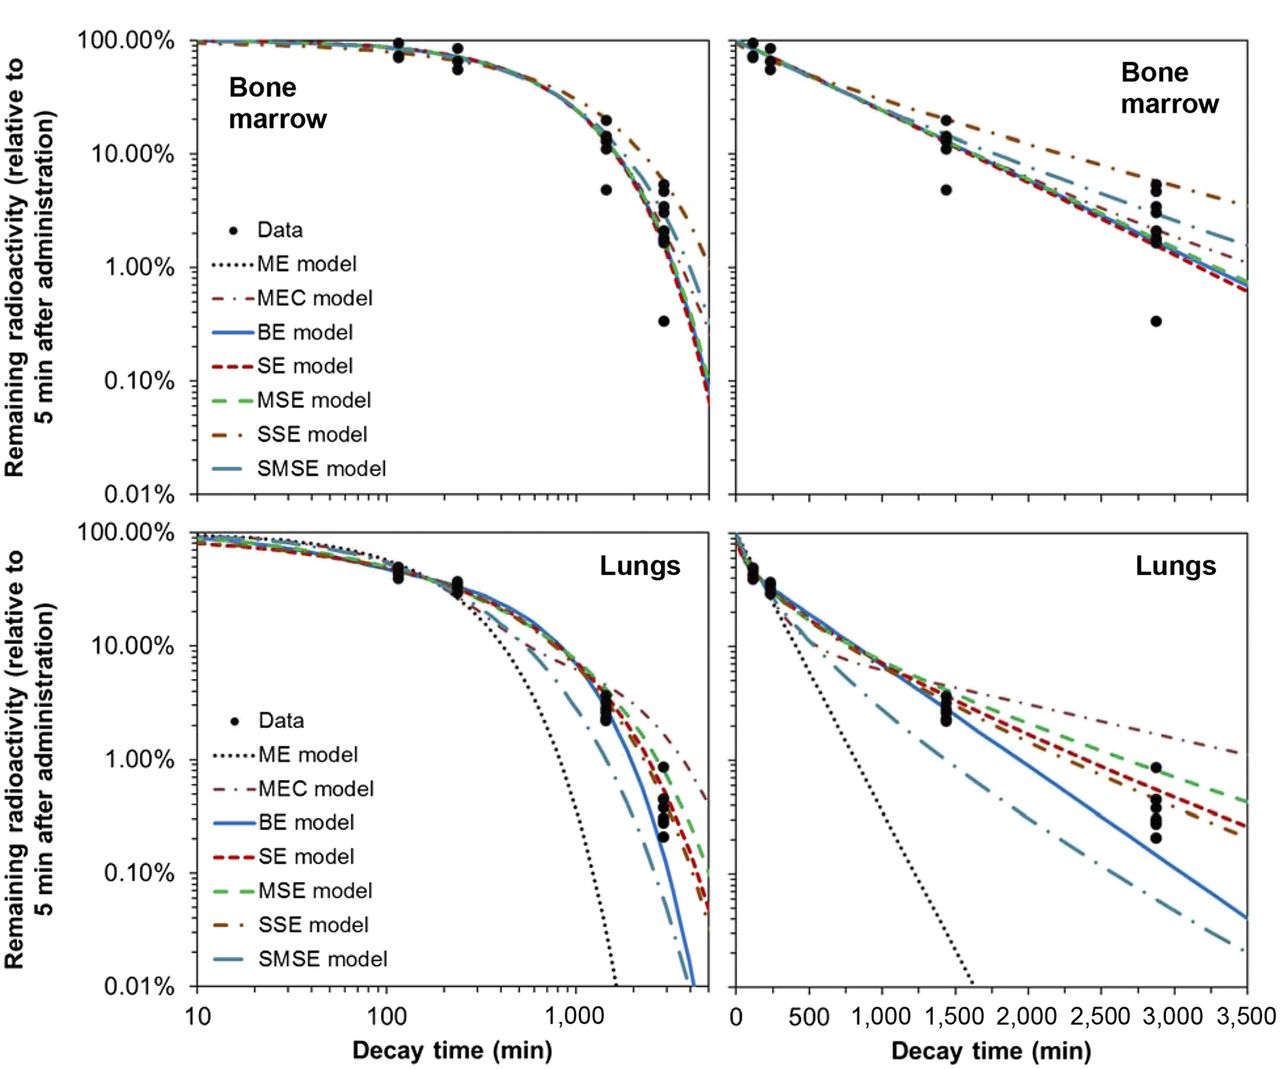
For kidney, liver, bone marrow, and lung data, the ratios of combined weight of evidence for CPD versus discrete-rate models were 0.81, 0.73, 0.99, and 2.7, respectively. Visual inspection of the model fits and the data (Figs. 1 and 3) supported these findings. This pattern may imply that for some organs/tissues (e.g., kidneys, liver, bone marrow) pharmacokinetics were simple and hence well described by ME or MEC models, whereas for others (e.g., blood, lungs) pharmacokinetics were complex and well described by only CPD models.

Data and best-fit model predictions for pharmacokinetics of 188Re-labeled antibody to melanin in mouse bone marrow and lungs.
The commonly used BE model did not have the best AICc ranking in any of the 5 analyzed organs/tissues (Table 2) and sometimes clearly underestimated the data at long decay times (for blood and lung data, Figs. 1 and 3). Nevertheless, the BE model never had a ΔAICc greater than 6, so it always remained among the set of reasonably fitting models.
R2 values (Table 2) were not informative for determining the best-supported model and often changed only in the third digit from model to model, merely suggesting that several models described the data without gross inaccuracy. This result confirms previous investigations, which suggested that R2 (or its adjusted form) is not useful for selecting among nonlinear (13), or even linear, models (15).
Alternative models often predicted substantially larger (by ≥30%) time integrals than the BE model (Table 3). If only the best-ranking model (with the smallest AICc score) was used for each organ/tissue, then the time integral for blood from the best-ranking SSE model was 2.2% higher than estimated by the BE model. For the kidneys and liver, the best-ranking models predicted 1.9% and 38.5% higher time integrals than the BE model (Table 3). For the lungs, the best-ranking model produced a 1.2% smaller time integral than the BE model. For the bone marrow, the best-ranking model was the ME formalism (a simplified form of the BE model), so the time integrals for the BE model and for the best-ranking model were naturally identical.
Comparison of the Total Time Integrals
These results showed that variations in predicted time integrals were considerable even among models, with substantial support from the data. This model-dependent variability implies that estimates from any single model should be treated with caution, particularly because model selection uncertainty was large and no clear-cut decision could be made via AICc. Consequently, one is compelled to use multimodel inference to obtain a conservative estimation of the time integral.
Multimodel averaged time integral values were substantially higher than those estimated by the BE model for most analyzed organs/tissues: by 12.7% for blood, 16.2% for kidneys, 32.8% for liver, and 54.0% for bone marrow (Table 3). For lungs, the time integrals estimated from all models or just from the BE model were essentially the same. These findings suggest that because CPD models can predict slower pharmacokinetics at long times than the BE model, they tend to predict larger time integrals. Consequently, accounting for the data support for these models by multimodel averaging often increases the time integral estimates, compared with using the BE model alone.
DISCUSSION
To the best of our knowledge, this is the first study in which radiopharmaceutical pharmacokinetics were analyzed using models with CPDs of first-order rates, and the performances of these models were rigorously compared with the performances of discrete-rate models. The study strengths include relatively large datasets, with 23–106 data points for each of 5 clinically relevant organs/tissues (blood, kidneys, liver, bone marrow, lungs), and information theoretic methods (10,11), which allow weights of evidence for each model to be quantified and inferences to be drawn from all models simultaneously, rather than from a best-supported model alone.
The main weakness involves the lack of explicit modeling for the initial distribution phase for the radioactivity shortly after administration. For the organs/tissues analyzed here, in which the radioactivity concentration peaked at the shortest investigated time of 5 min after administration, the distribution phase was effectively instantaneous compared with subsequent decay processes. However, for some other organs the distribution phase is likely to be slower and would need to be modeled explicitly, as we intend to do in subsequent research.
Importantly, the commonly used BE formalism was never the best-supported model by AICc for the data at hand (Table 2). The MEC model was the best-supported formalism for kidney and liver data but performed poorly for blood and lung data. The ME model did well for only bone marrow data. CPD models (SE, MSE, SSE, or SMSE) outperformed the discrete-rate formalisms (ME, MEC, and BE) for blood and lung data and remained close competitors for all other organs/tissues: at least one of these models always maintained an ΔAICc less than 1, and all except SMSE always had an ΔAICc less than 6. Consequently, CPD models could never be classified as poorly supported even when they were not the highest-ranked models.
This pattern suggests that a single biochemical decay rate (possibly with a small trapped component) may dominate in bone marrow, kidneys, and liver, whereas multiple biochemical processes acting simultaneously determine radioactivity pharmacokinetics in blood and lungs. These processes can be better approximated by a CPD of first-order rates summarized by 1–2 parameters, rather than by the 3-parameter discrete-rate BE model.
These conclusions remained unchanged regardless of whether the data were normalized using the radioactivity concentrations at 5 min after administration or left unnormalized, adding an extra parameter to all models to represent the radioactivity concentration at time zero. For example, in the analysis of unnormalized blood data, the Akaike weights for the ME, MEC, BE, SE, MSE, SSE, and SMSE models were 0.000, 0.000, 0.116, 0.350, 0.338, 0.193, and 0.003, respectively. Although these values differed somewhat from the results of the analysis using normalized data (Table 2), they were within the model selection uncertainty range. Notably, the cumulated Akaike weight for the last 4 models (0.88) was not very different from the value (0.92) found with normalized blood data.
When the best-fit pharmacokinetic curves for each model were integrated over time (to infinity), the results differed substantially (by > 1.5-fold) between models. Therefore, using the time integral from any single model to estimate the cumulative radiation dose can be prone to large fluctuations. Instead, more robust estimates, which account for model selection uncertainty, can be constructed by multimodel inference (2).
CONCLUSION
Pharmacokinetic data are essential for translating pharmaceutical agents from the bench to the clinic. For radiopharmaceuticals, pharmacokinetic data are also essential for dosimetry calculations to predict radiation doses to tumors and healthy tissues. In this study, we applied simple mechanistically plausible models, which assume CPDs of pharmacokinetic rates to data on biodistribution of 188Re-labeled melanin-specific antibodies in melanoma-bearing mice, and observed that these models described the data better than the more complex biexponential model. Therefore, such models should be taken into consideration for describing radiopharmaceutical pharmacokinetics.
DISCLOSURE
The costs of publication of this article were defrayed in part by the payment of page charges. Therefore, and solely to indicate this fact, this article is hereby marked “advertisement” in accordance with 18 USC section 1734. This study was supported by the NIAID grant U19-AI67773. No other potential conflict of interest relevant to this article was reported.
Acknowledgments
We are very grateful to Dr. Halim E. Lehtihet for instructive comments and feedback on the manuscript. We are also grateful to anonymous reviewers and the editor for suggesting to test the MEC model and for helping to improve the readability of the paper.
Footnotes
Published online Jul. 23, 2015.
- © 2015 by the Society of Nuclear Medicine and Molecular Imaging, Inc.
REFERENCES
- Received for publication May 6, 2015.
- Accepted for publication July 15, 2015.


Jump to section
Related Articles
Cited By...
- No citing articles found.