


Abstract
The quantification and variability of skeletal muscle glucose utilization (SMGU) in healthy subjects under basal (low insulin) conditions are poorly known. This information is essential early in clinical drug development to effectively interrogate novel pharmacologic interventions that modulate glucose uptake. The aim of this study was to determine test–retest characteristics and variability of SMGU within and between healthy subjects under basal conditions. Furthermore, different kinetic modeling strategies were evaluated to find the best-fitting model to assess SMGU studied by 18F-FDG. Methods: Six healthy male volunteers underwent 2 dynamic 18F-FDG PET/CT scans with an interval of 24 h. Subjects were admitted to the clinical unit to minimize variability in daily activities and food intake and restrict physical activity. 18F-FDG PET/CT scans of gluteal and quadriceps muscle area were obtained with arterial input. Regions of interest were drawn over the muscle area to obtain time–activity curves and standardized uptake values (SUVs) between 60 and 90 min. Spectral analysis of the data and kinetic modeling was performed using 2-tissue-irreversible (2T3K), 2-tissue-reversible, and 3-tissue-sequential-irreversible (3T5KS) models. Reproducibility was assessed by intraclass correlation coefficients (ICCs) and within-subject coefficient of variation (WSCV). Results: SUVs in gluteal and quadriceps areas were 0.56 ± 0.09 and 0.64 ± 0.07. ICCs (with 90% confidence intervals in parentheses) were 0.88 (0.64–0.96) and 0.96 (0.82–0.99), respectively, for gluteal and quadriceps muscles, and WSCV for gluteal and quadriceps muscles was 2.2% and 3.6%, respectively. The rate of glucose uptake into muscle was 0.0016 ± 0.0004 mL/mL⋅min, with an ICC of 0.94 (0.93–0.95) and WSCV of 6.6% for the 3T5KS model, whereas an ICC of 0.98 (0.92–1.00) and WSCV of 2.8% was obtained for the 2T3K model. 3T5KS demonstrated the best fit to the measured experimental points. Conclusion: Minimal variability in skeletal muscle glucose uptake was observed under basal conditions in healthy subjects. SUV measurements and rate of glucose uptake values were reproducible, with an average WSCV of less than 5%. Compared with SUV, the 3-tissue model adds information about kinetics between blood, intra- and intercellular compartments, and phosphorylation that may highlight the exact mechanisms of metabolic changes after pharmacologic intervention.
Insulin resistance, especially impaired skeletal muscle glucose uptake, plays a critical role in the development of type 2 diabetes mellitus (1,2). The pathogenesis of insulin resistance is a complex interplay among several factors including reduced peripheral perfusion, altered intramyocellular fatty acid metabolism, and defects in muscle glycogen synthesis (3–5). Three potentially rate-controlling proximal steps of glucose metabolism have been identified as determinants of skeletal muscle insulin resistance, namely glucose transport (via the major insulin-stimulated glucose transporter GLUT 4), phosphorylation through hexokinase, and glycogen synthase (6).
PET is a powerful tool to noninvasively assess tissue metabolism and blood flow. PET with 18F-FDG has been extensively used to analyze and quantify glucose uptake in several metabolically active tissues in a variety of disease conditions. Quantitative information on the rate-controlling steps in glucose metabolism can be discerned by dynamic PET acquisition. Thus, 18F-FDG PET has the ability to quantitatively and noninvasively assess glucose metabolism simultaneously in various tissues (e.g., skeletal muscle, heart, and liver), thereby providing insight into tissue glucose dynamics that can be monitored over time in a given individual, especially during disease progression or in response to therapeutic interventions.
Several studies have evaluated the effect of exercise, insulin infusion, or pharmacologic agents on skeletal muscle glucose utilization (SMGU) in type 2 diabetes mellitus patients (7–9). However, little to no information is known about within-subject (test–retest) and intersubject variability of glucose utilization in these metabolically active tissues under basal conditions in healthy humans. The latter information is critical not only to derive an important benchmark for the accurate interpretation of glucose uptake data in subjects with type 2 diabetes mellitus, but also to appropriately design and power exploratory clinical studies to evaluate the pharmacodynamic effects of novel chemical entities on glucose utilization early in a clinical program (e.g., phase I), which are often conducted in normal healthy volunteers.
18F-FDG pharmacokinetics are usually assessed with a 2-tissue-irreversible model provided the blood input curve is available (10,11). A Patlak plot can be used for voxelwise modeling of spatial distribution of the influx rate in 3 dimensions (12). The semiquantitative standardized uptake value (SUV) is a typical approach in daily clinical practice because no arterial blood extraction is required. Therefore, another purpose of this study was to examine the validity of different pharmacokinetic models to obtain PET-derived kinetic parameters on skeletal muscle glucose metabolism in comparison with SUVs.
In this study, test–retest characteristics of glucose consumption in skeletal muscle under basal conditions in healthy subjects and variability within and between subjects were studied. Furthermore, different kinetic modeling strategies were compared to find the best-fitting model to evaluate skeletal muscle glucose metabolism as assessed by 18F-FDG PET.
MATERIALS AND METHODS
Subjects
Six healthy male volunteers (mean age ± SD, 32 ± 10 y; body mass index, 23.6 ± 1.4 kg/m2) were enrolled in the study. All subjects were considered healthy based on medical history and physical examination and did not take any medication. One to 4 wk before 18F-FDG PET/CT, a screening visit was scheduled to explain the outline of the study. The study protocol was performed according to Good Clinical Practice and approved by the Ethics Committee of the University Hospitals Leuven, Belgium. All subjects signed a written informed consent form before study inclusion.
Study Design and Experimental Protocol
Subjects were admitted to the clinical pharmacology unit 1 d before the first 18F-FDG PET/CT scan to minimize variability of daily activities within and between subjects. Two scans were obtained with an interval of 24 h and at the same time of the day for each individual to rule out diurnal variations. On admission, subjects were instructed to minimize physical activity, consume standardized meals, and fast for 8 h before 18F-FDG injection. Subjects were transferred to the nuclear medicine department in a wheelchair to avoid any physical exercise immediately before 18F-FDG PET/CT scanning. On the first scanning day, a venous catheter was placed in the antecubital vein for 18F-FDG administration, and an arterial catheter was inserted in the radial artery for blood sample collection. Plasma glucose and insulin measurements were performed at baseline and 75 and 135 min after tracer administration.
18F-FDG PET/CT Scanning
Scans were obtained on a HiRez Biograph 16 PET/CT scanner (Siemens). A low-dose CT scan of the thigh and gluteal muscle compartment was obtained immediately before a dynamic 90-min list-mode PET scan after administration of 100 MBq of 18F-FDG (test, 104 ± 4 MBq; retest, 102 ± 5 MBq). PET was corrected for dead time, randoms, scatter, and attenuation. After this dynamic scan, a break for 10–15 min was allowed for voiding, but subjects were restricted from any exercise. Then, a mini whole-body low-dose CT scan covering the heart and liver was acquired, followed by a PET emission (2 bed positions, 10 min per bed position). Images were reconstructed using ordered-subset expectation maximization (2-mm isotropic voxels, gaussian filter of 3 mm in full width at half maximum, 5 iterations and 8 subsets). Arterial blood samples (n = 28) were collected with an increasing time interval up to 90 min after injection, and radioactivity in whole blood and plasma were measured in the calibrated well-counter.
Image Processing and Data Analysis
PMOD (version 3.4; PMOD Technologies) was used to draw regions of interest based on CT images and for further kinetic modeling. Muscle regions of interest integrated a maximum possible number of voxels while excluding major blood vessels. In the case of strong spill-in, the border avoided the area with the strong signal by stepping out from the true organ border based on visual assessment. Time–activity curves were generated, and SUVs were obtained between 60 and 90 min after injection. For the determination of myocardial and liver SUV, 3 spheres of 5-mm diameter were positioned in the left ventricular wall and 1 larger sphere of 5-cm diameter was placed in the geometric center of the right liver lobe, respectively (Fig. 1).
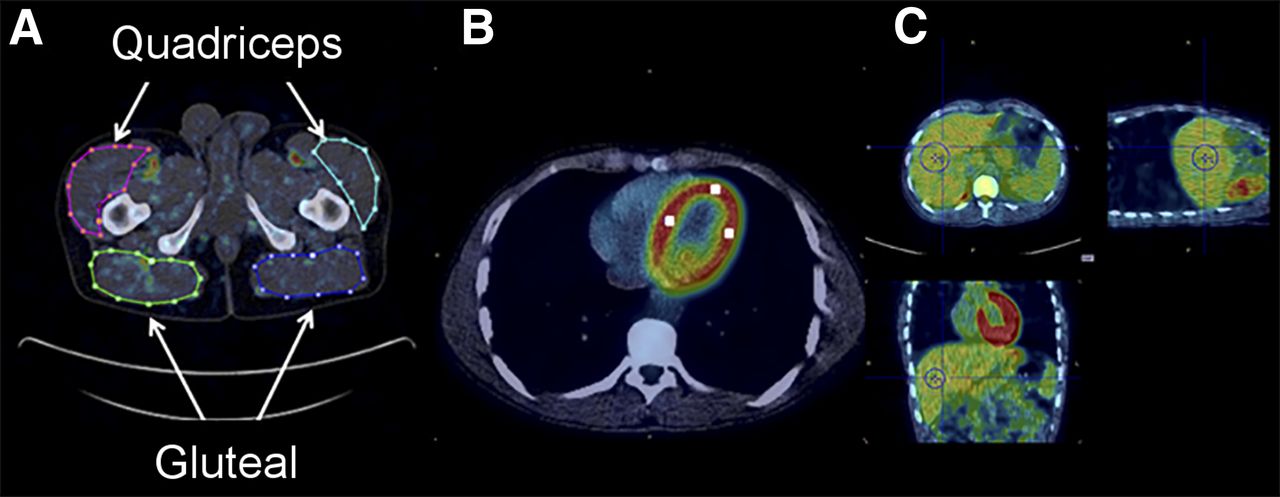
Region-of-interest delineation. All images are semitransparent superimposed PET/CT combinations. (A) Gluteal muscle and quadriceps (dynamic scan). (B) Myocardium: 3 cubic volumes of interest (white on image) of 5 × 5 × 5 mm. (C) Liver: sphere, 5 cm in diameter (static scan).
Before the compartmental modeling, spectral analysis of the data was performed to define the optimal number of compartments that best fitted the experimental data (13,14). Dynamic scans were modeled with 2-tissue-reversible (2T4K) (K1, k2, k3, k4) and -irreversible (2T3K) (K1, k2, k3) models as well as with the 3-tissue-sequential-irreversible 3T5KS (K1, k2, k3, k4, k5) model (Fig. 2) (15). Blood volume was fitted as an additional parameter.

3T5KS model. For 18F-FDG tracer, C1 compartment can be interpreted as extracellular space; C2, intracellular space; and C3, 18F-FDG phosphorylation (irreversibly trapped). Cp = tracer concentration in plasma.
In the case irreversible models were used, Ki (influx rate constant [mL/ml⋅min]), which is proportional to 18F-FDG glucose consumption, can be defined as Eq. 1
Eq. 1 Eq. 2For the input function, both arterial whole-blood and plasma measurements were used whereas whole-blood input was used to fit the blood volume compartment. In addition, Logan graphic analysis was also applied to the data.
Finally, SMGU was calculated as Ki × GLp/LC, in which Ki is taken from the 3T5KS model; GLp is plasma glucose level during PET; and LC is lumped constant, which is assumed to be 1.0 in skeletal muscle (16).
Statistics
Reproducibility was assessed from the repeated scans and measured by intraclass correlation coefficients (ICCs). The ICC is the ratio of between-subject variance to total variance, which is the sum of between-subject variance and within-subject variance—that is, it is the proportion of total variance represented by the between component.
The within-subject coefficient of variation (WSCV) is the ratio of the within-subject SD to the overall mean. Mean and between-subject SD were estimated and reported for all parameters.
The variance components required for the estimation of these statistics were obtained from a linear mixed-effect model with day as a fixed effect and subject as a random effect. Day was included in the model as a repeated measure. An unstructured covariance matrix was assumed.
A P value of less than 0.05 was considered statistically significant.
RESULTS
All individuals were successfully scanned twice according to the protocol. Plasma glucose and insulin levels did not change significantly during the imaging procedure (Table 1).
Biomarker Summary at Baseline and During PET Acquisition
The arterial input function and blood activity curve of whole blood and plasma exhibited a small decline for all subjects, and the mean plasma–to–whole-blood ratio slowly decreased from 1.12 to 1.07 within 90 min after tracer administration. Both blood and plasma activity curves were used for modeling.
The quality of the fit with, respectively, 3T5KS, 2T4K, and 2T3K models and the relative contribution of the intra- and extracellular compartments are illustrated in Figure 3. Visual analysis of the fits with different kinetic models revealed that the 3T5KS model was the most appropriate to describe the underlying physiologic process. It was also preferred based on Akaike information criterion in 19 of 24 fits (79%). In 5 other cases (21%), the 2T4K model had a lower Akaike information criterion score. In addition to visual evaluation, spectral analysis also indicated that a model with more than 2 compartments should be used in most cases.

Accuracy of fit of 18F-FDG uptake in muscles with 3T5KS model (A), 2T4K (B), and 2T3K (C). Time–activity curve (TAC) points are experimentally measured data. Solid line is model fit, which is sum of compartmental fit (dashed lines). C1 = extracellular compartment; C2 = intracellular compartment; C3 = phosphorylated 18F-FDG compartment in 3T5KS model.
All parameters for the kinetic models used in this study and SUV for gluteal and quadriceps muscles (average SUV of left and right muscle between 60 and 90 min) along with test–retest ratio and test–retest variability (TRT = [V1 − V2] × 2/[V1 + V2]) are provided in Supplemental Table 1 (supplemental materials are available at http://jnm.snmjournals.org). SUVs for test–retest scans showed good reproducibility and remained within 10% for any subject. Average change in gluteal muscle uptake for all subjects was 5% whereas no difference was observed for quadriceps muscle. The high reproducibility for SUV measurements for both gluteal and quadriceps muscle is also reflected by a WSCV of 2.2% and 3.6% and an ICC (with 90% confidence intervals in parentheses) of 0.88 (0.64–0.96) and 0.96 (0.82–0.99), respectively.
Averaged values of kinetic parameters for gluteal and quadriceps muscle from the 3T5KS model for all healthy volunteers are summarized in Table 2. Similar to SUVs, good reproducibility was observed for the Ki of the 3T5KS model and distribution volume (Vt) from 2T4K, with a maximum difference of 25% within 1 subject. Average values of Ki and Vt for test–retest did not significantly differ and remained within 5% for both gluteal and quadriceps muscle. Similar to SUV measurements, high reproducibility for Ki and Vt is demonstrated by a WSCV of 6.6% and 2.8% and an ICC of 0.94 (0.93–0.95) and 0.98 (0.92–1.00), respectively.
Kinetic Parameters for 3-Tissue 5K Model
SMGU values were 8.5 ± 2.5 μmol/min/kg for test and 8.4 ± 1.9 μmol/min/kg for retest studies.
Variability or individual changes of kinetic parameters in test–retest modeling with a 3T5KS model are shown in Figure 4. Ki was a reproducible parameter for all subjects, and a good reproducibility was observed for most of the other kinetic parameters as well. Ki and Vt values were successfully calculated by 3T5KS and 2T4K models, respectively, and a significant correlation was found between Vt of the 2T4K model and Ki of the 3T5KS model (Fig. 5A) whereas a worse correlation was demonstrated for both Vt and Ki with SUVs (Figs. 5B and 5C). In addition, a significant negative correlation was observed between 18F-FDG activity in blood/plasma and SUVs between 60 and 90 min (Fig. 5D).

Individual variations of kinetic parameters in test–retest study. Black squares refer to first scan, white squares to second scan. In subjects 2 and 5, there is near-complete overlap between test and retest.
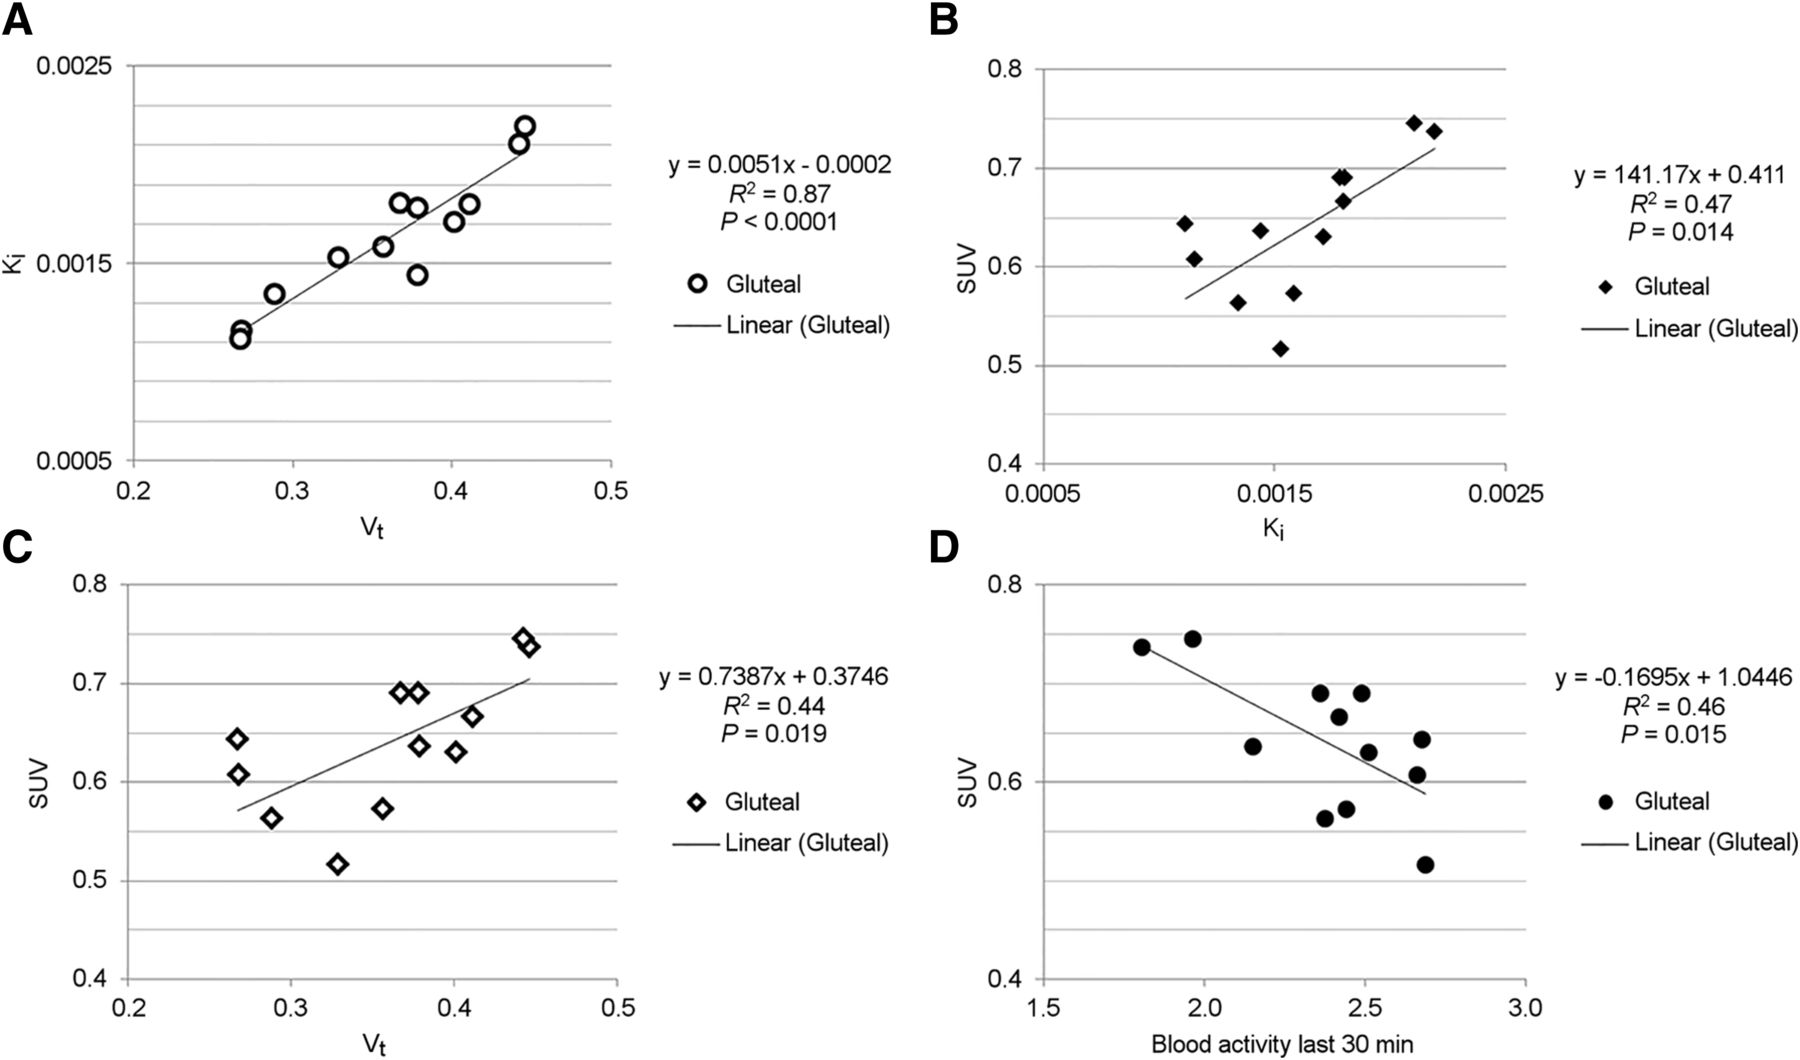
Gluteal muscle (averaged left and right) correlation between Ki of 3T5KS and Vt of 2T4K model (A), between Ki and SUVs measured between 60 and 90 min of scan (B), between Vt and SUV (C), and between 18F-FDG concentration in blood in last 30 min and corresponding SUVs in tissue (D).
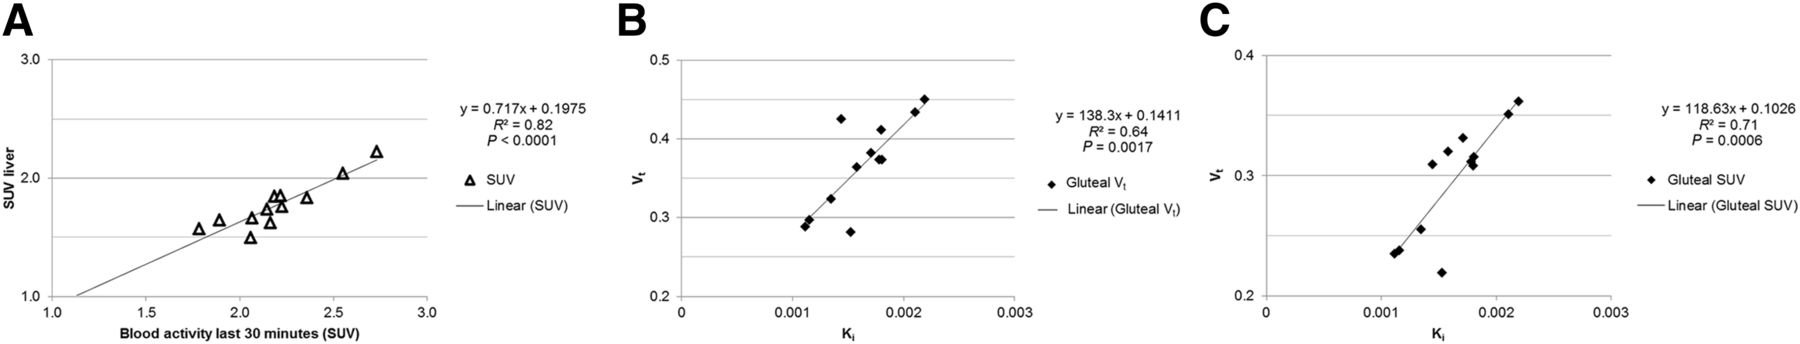
Conversely, SUV of liver was proportional to whole-blood activity measured from arterial samples (Fig. 6A). The latter observation was used for assessing Vts without full arterial blood sampling. Vts obtained from the ratio of activity in tissue to blood at later time points (averaged between 60 and 90 min) correlated well with Ki calculations from the 3T5KS model (Fig. 6B), and Vts derived from liver activity as blood input also showed a good correlation with influx rate constants (Fig. 6C).

(A) Correlation between 18F-FDG in liver and 18F-FDG concentration in blood. Correlation between Ki (3T5KS model) and Vt calculated as activity in muscle averaged between 60 and 90 min divided by measured blood activity (B) and divided by blood activity in liver (C).
SUVs for liver and myocardium are presented in Table 3. Myocardial SUV showed a high intersubject variation ranging from 1.6 (subject AN05 retest) to 9.2 (subject AN01 retest), but also large intrasubject differences between both studies were observed (e.g., >2-fold difference in subject AN06). The latter is shown by a relatively high WSCV of 20.7% and ICC of 0.93 (0.73–0.98). Differences in liver SUV remained within 10%, and liver SUV was proportional to blood activity at the time of measurement. In contrast to myocardial SUV measurements, liver uptake was more reproducible, with a WSCV of 3.5% and ICC of 0.91 (0.67–0.98), similar to the variation in muscle SUV measurements.
SUVs (Test–Retest) of Liver and Myocardium for Each Individual During Test and Retest
DISCUSSION
The main goal of this study was to assess test–retest characteristics of SMGU under basal conditions and variability within and between subjects. Furthermore, the validity of a simplified approach without blood input function (i.e., SUV) was compared with advanced kinetic modeling strategies.
SUV measurements are widely used because of the method’s simplicity, but many well-known factors might affect the accuracy of SUV measurements, including patient weight, glucose and insulin levels, and uptake period. Image-derived input function with venous blood sampling requires recalibration of venous samples into arterial input (for 18F-FDG, venous and arterial concentrations become similar after 20 min) and blood region of interest, which is free from spill-in and spill-out (17,18). This method is successful when the descending aorta is used as a source of image-derived input function though it is complicated in the case of gluteal/quadriceps muscle glucose utilization because only small vessels are within the field of view (19). In the case of arterial plasma image-derived input function, kinetic modeling with the 2T3K model is usually used. However, the more complex 3T5K model, which is more physiologic (it does not assume an instant cell membrane transport), can also be applied.
Previous investigations of SMGU reported a TRT of 17% for SUVs, but subjects were scanned with a time interval of about 9 mo (20). Therefore, it was difficult to attribute this difference to either the accuracy of the measurement itself or the change in glucose metabolism over time or to both factors. In our study, interval between both scans was only 24 h, and metabolic conditions (diet, physical activity, etc.) were controlled as much as possible to rule out interference resulting in a TRT of less than 10%. On average, test–retest SUV measurements of liver and skeletal muscle were reproducible and remained within 5%, whereas difference for any given subject remained within 10%. These results are concordant with reports in the literature underscoring that SUV can serve as an indicative physiologic parameter in those tissues. Such a tight coefficient of variation allows a study with smaller sample size to be performed, a key consideration especially in early clinical studies to evaluate relatively small changes in treatment effect. As an example, a 7% (or 9%) increase in glucose uptake in skeletal muscle could be detected with 80% power, 1-side α = 0.05, with 8 (or 6, respectively) subjects in a placebo-controlled crossover design. In contrast, myocardial SUV measurements under standardized conditions showed both a high intersubject and a high intrasubject variability.
The advantage of using the more complex 3-tissue model is based on a more reliable separation of 3 compartments, which enables studying physiologic processes that occur between individual compartments. In the case of interventions (e.g., pharmacologic agents, exercise), 18F-FDG uptake might change and the 3-tissue model may provide insight into the underlying mechanism. For example, increased 18F-FDG uptake may be due to increased cellular permeability (k3), higher rate of metabolization of 18F-FDG inside the cell (k5), or higher blood flow (K1). All these changes relate to Ki, and the driver of the effect cannot be deducted from SUVs only.
This complex 3T5K model has been evaluated to assess SMGU in patients with obesity or type 2 diabetes mellitus (21,22). Regardless of the high number of fit parameters, a 3T5K model provided good fits and glucose uptake rates (Ki) that were significantly different between patient groups. In addition, the effect of weight-loss on Ki was assessed and compared between groups (23). Our data are in agreement with previously reported kinetic parameters for healthy volunteers; however, TRT was unknown (21).
The 3T5K model was preferred based on spectral analysis as well as by Akaike information criterion in our and previous studies in most but not all subjects (15). In the study by Bertoldo et al., the 3-tissue model lost its superiority with insulin intervention, which affected mainly k3 (cell-membrane influx) as expected but also k5 (15). In the case of a significantly lower or negligible k5 than k3, an extra complication of the model is not justified. However, under normal conditions with comparable values for k3 and k5 (though k3 is still bigger than k5) a 3-tissue model is preferred over more simplified kinetic models.
Nevertheless, the lack of standardization in patient preparation of previous reported studies led to increased variability in modeling results (15,21–23). For example, Williams et al. and Bertoldo et al. reported a variation of K1 in healthy volunteers from 0.043 ± 0.013 to 0.019 ± 0.002 mL/min, respectively, using the same 3T5KS model (21). In our study, average K1 values for gluteal and quadriceps muscle were 0.050 ± 0.018 and 0.052 ± 0.015, respectively, similar to the values reported by Williams et al. (15,21).
Test–retest measurements for individual modeling parameters (Fig. 4) demonstrated that not only is Ki highly reproducible but also all compartments and other kinetic parameters for subjects 2, 3, 5, and 6. We observed more discrepancy in kinetic parameters for subjects 1 and 4 even though only small changes in SUVs were measured. For subjects 1 and 4, a 25% increase and 12% decrease in Ki, respectively, were observed for test–retest values for gluteal muscles whereas K1/k2 ratios did not change much, indicating that changes are mainly occurring in intracellular and bound compartments. For subject 1, a decreased concentration of 18F-FDG within cells was compensated by increased phosphorylation and the opposite is true for subject 4. These findings can be attributed either to a change in muscle metabolism between two scans or to a modeling bias, but distinguishing between both is difficult because fits used have the best Akaike information criterion scores. The fact that final glucose uptake did not change much is an argument in favor of modeling bias, but on the other hand deviation of some kinetic parameters could be compensated by the other mechanism to maintain glucose consumption in muscle tissue.
The 2T4K model had fewer parameters to fit than a 3-tissue model and therefore may become useful in the case the quality of the scan does not allow a reliable fit to the 3T5K model (e.g., noisy data). Our results showed a good correlation between Vt values from the 2T4K model and Ki (Fig. 6A). So this model can be used for glucose uptake estimations though interpretation of kinetic parameters remains uncertain.
A classic 18F-FDG 2-tissue-irreversible model provided a poor fit for the measured time–activity curves. Regardless of good test–retest reproducibility, Ki values were overestimated compared with the 3-tissue model (Supplemental Table 1). From these results, we concluded that a 2T3K model is less recommended for quantifying SMGU.
We also evaluated the correlation between SUVs, remaining 18F-FDG in blood, and different kinetic parameters. As mentioned before, SUV is a semiquantitative parameter that ignores the actual concentration of tracer in blood and assumes that tracer delivery to a target organ is similar for a particular injected activity. However, that muscle uptake itself can affect tracer concentration in blood is one of the key elements in washout. Figure 5D showed a negative correlation between 18F-FDG in blood and SUV of gluteal muscle meaning that SUVs are smoothed, high glucose metabolism clears blood faster, and SUVs are underestimated. The latter is also illustrated by the dynamic range of measured SUVs (0.52–0.75) versus Ki from the 3T5KS model (0.0011–0.0022). As a result, muscle uptake regulates 18F-FDG levels in blood and therefore it is not unexpected that a correlation between Ki and SUV is not pronounced (Fig. 5B).
We questioned whether it was possible to improve the quantification of glucose uptake without arterial blood sampling and to find a parameter that is more adequate than SUV. On the basis of our data, we suggest the use of Vts of almost true equilibrium, which is observed 60 min after tracer administration. A good correlation between Ki and the measured volume-of-interest activity (which is almost stable between 60 and 90 min) divided by blood activity was demonstrated (Fig. 6B), and this approach requires only 1 blood sample. In practice, this blood sample can be venous because at that time (60 min after injection) tracer concentration in the artery and vein is almost the same. This approach is less invasive and can be recommended for clinical use.
Another possibility, which does not require blood sampling but an additional static PET scan, is based on the observation that tracer activity in the liver is linearly correlated to blood activity (Fig. 6A).
Both approaches provide Vt values that correlate better to Ki (R2 = 0.64 and 0.71, respectively, vs. R2 = 0.47 for SUV) and are therefore preferred over SUV measurements, with the minor complication of taking at most 1 additional venous blood sample.
Finally, SMGU values are similar to the published results in a healthy population; however, we cannot directly compare our values, which are about 5–10 times lower, to those reported under hyperinsulinemic euglycemic clamp (7,24,25).
CONCLUSION
This study demonstrated that under standardized conditions, minimal variability in SMGU was observed, enabling a similar design for future clinical trials to assess changes after intervention. SUV measurements of skeletal muscle glucose uptake were highly reproducible, with average within-subject variability under 5% in healthy subjects. A 3T5KS model can be reliably applied, highlighting kinetics between blood, extra- and intracellular space, and phosphorylation. In addition, a 2T4K model and Logan graphic analysis provide Vts, which also reflect glucose consumption with high reproducibility. 3T5KS and 2T4K kinetic models can be used to assess changes in SMGU after pharmacologic interventions or exercise, but a 3T5KS model might be preferred to provide insight into the underlying physiologic mechanism.
DISCLOSURE
The costs of publication of this article were defrayed in part by the payment of page charges. Therefore, and solely to indicate this fact, this article is hereby marked “advertisement” in accordance with 18 USC section 1734. The Leuven University Hospitals groups obtained financial sponsoring from Merck & Co, Inc., for carrying out this study. Ruben Declercq, Justin Dennie, Lori Mixson, Inge De Lepeleire, Michael Klimas, and Manu V. Chakravarthy are employees of Merck Sharp & Dohme Corp., a subsidiary of Merck & Co., Inc., Kenilworth, New Jersey, and may own stock/stock options in Merck. Koen Van Laere and Olivier Gheysens are senior clinical investigators from the Fund for Scientific Research Flanders (FWO). No other potential conflict of interest relevant to this article was reported.
Acknowledgments
We thank Kwinten Porters for his skilled contribution in performing the PET scans, the PET radiopharmacy team, and personnel of the Center for Clinical Pharmacology.
Footnotes
↵* Contributed equally to this work.
Published online Jul. 30, 2015.
- © 2015 by the Society of Nuclear Medicine and Molecular Imaging, Inc.
REFERENCES
- Received for publication May 13, 2015.
- Accepted for publication July 8, 2015.


Jump to section
Related Articles
Cited By...
- No citing articles found.