


Abstract
Dopamine D2/3 receptor (D2/3R) agonist PET tracers are better suited for the imaging of synaptic dopaminergic neurotransmission than D2/3R antagonists and may also offer the opportunity to study in vivo the high-affinity state of D2/3R (D2/3RHigh). With the aim to develop 18F-labeled D2/3R agonists suitable for widespread clinical application, we report here on the synthesis and in vitro and in vivo evaluation of a D2/3R agonist ligand from the aminomethyl chromane (AMC) class—(R)-2-[(4-18F-fluorobenzylamino)methyl]chroman-7-ol (18F-AMC20). Methods: In vitro affinities of AMC20 toward dopaminergic receptor subtypes were measured in membrane homogenates prepared from HEK293 cells expressing human dopamine receptors. Agonism of AMC20 was assessed in the arrestin recruitment assay in Chinese hamster ovary–K1 cells expressing the long isoform of D2R (D2RLong). D2/3R-specific binding of 18F-AMC20 was evaluated in brain slices of Sprague–Dawley rats by in vitro autoradiography and in living rats by in vivo small-animal PET imaging and ex vivo autoradiography. PET data were analyzed with 1- and 2-tissue compartmental models, the simplified reference tissue model, and Logan graphical analysis. Specificity of binding was tested by blocking D2/3R with raclopride (coincubation with 10 μM in vitro, administration of 1.0 mg/kg in vivo). Results: In membrane homogenates, AMC20 demonstrated picomolar affinity at D2RHigh (mean inhibition constant [Ki] = 85 pM) and excellent selectivity against the low-affinity state of D2R (D2RLow) (mean Ki = 84 nM, 988-fold selectivity) and D1-like receptors (mean Ki = 5,062 nM at D1R). The efficacy of AMC20 was 90% of that of dopamine in the arrestin recruitment assay. Up to 70% of total binding of 18F-AMC20 in the D2/3R-rich striatum in rat brain slices was D2/3R-specific; in living rats, the uptake ratio between the striatum and the D2/3R-poor cerebellum reached 2.0–2.5, depending on the measurement method. Radiometabolites of 18F-AMC20 did not enter the brain. Striatal binding potential of 18F-AMC20 varied between 0.49 and 0.59 depending on the estimation method. Pretreatment with 1 mg of raclopride per kilogram reduced the apparent specific binding of 18F-AMC20 in the striatum. Conclusion: 18F-AMC20 shows specific binding to D2/3R in the striatum of living rats. Further optimization of the chemical structure of 18F-AMC20 can lead to 18F-labeled D2/3 agonist PET tracers more suitable for in vivo clinical application.
Imaging of dopamine D2 and D3 receptors (D2/3R) by PET is a topic of particular interest, because deregulation of D2/3 signaling is implied in many neuropsychiatric disorders (1–4).
Most PET tracers currently used for D2/3R imaging are antagonists (5). Throughout the recent 2 decades, development of agonist tracers for G-protein–coupled neurotransmitter receptors has gained popularity, spurred by the consistent observations by several authors (6–8) that in vitro agonists bound to receptor–G-protein complexes with higher affinity than to free receptors, whereas antagonists bound to all receptors with equal affinity.
Preference for this subset of receptors (called the high-affinity state) makes agonists potentially better suited than antagonists for the imaging of synaptic neurotransmission, because the neurotransmitters themselves are agonists and exhibit the same preference. Indeed, 11C-labeled D2/3R agonists demonstrated greater sensitivity to amphetamine-induced dopamine release in humans than the antagonist 11C-raclopride (9,10).
Moreover, dysregulated relative abundance of the high-affinity state of D2/3R might underlie the state of dopamine supersensitivity, which is associated with psychosis, Parkinson disease, and addiction (11). Agonist tracers might provide new insights for the research into and (early) diagnosis of such disorders.
Of many candidate compounds of various classes tested as potential D2/3R agonist PET tracers (12), only 3 were eventually used in humans, namely the apomorphines (–)-N-propyl-norapomorphine (11C-(–)NPA) and (R)-2-11CH3O-N-n-propylnorapomorphine (11C-MNPA) and the naphtoxazine (+)-4-propyl-3,4,4a,5,6,10b-hexahydro-2H-naphtho[1,2-b][1,4]oxazin-9-ol (11C-(+)PHNO). The scope of use of 11C tracers is limited by the short half-life of 11C (20.4 min), whereas tracers labeled with longer-living radioisotopes such as 18F (half-life, 109.8 min) have a much greater potential. (R)-(−)-2-18F-fluoroethoxy-N-n-propylnorapomorphine (18F-MCL-524), an 18F-labeled apomorphine derivative, showed promising results in monkeys (13) but has not yet been reported to be used in humans.
We aimed to develop 18F-labeled D2/3R agonist radioligands for PET. We have based our research on the aminomethyl chromanes (AMCs), a class of D2/3 agonists first described as such by Mewshaw et al. (14). Until now, AMCs have not been used for PET tracer development.
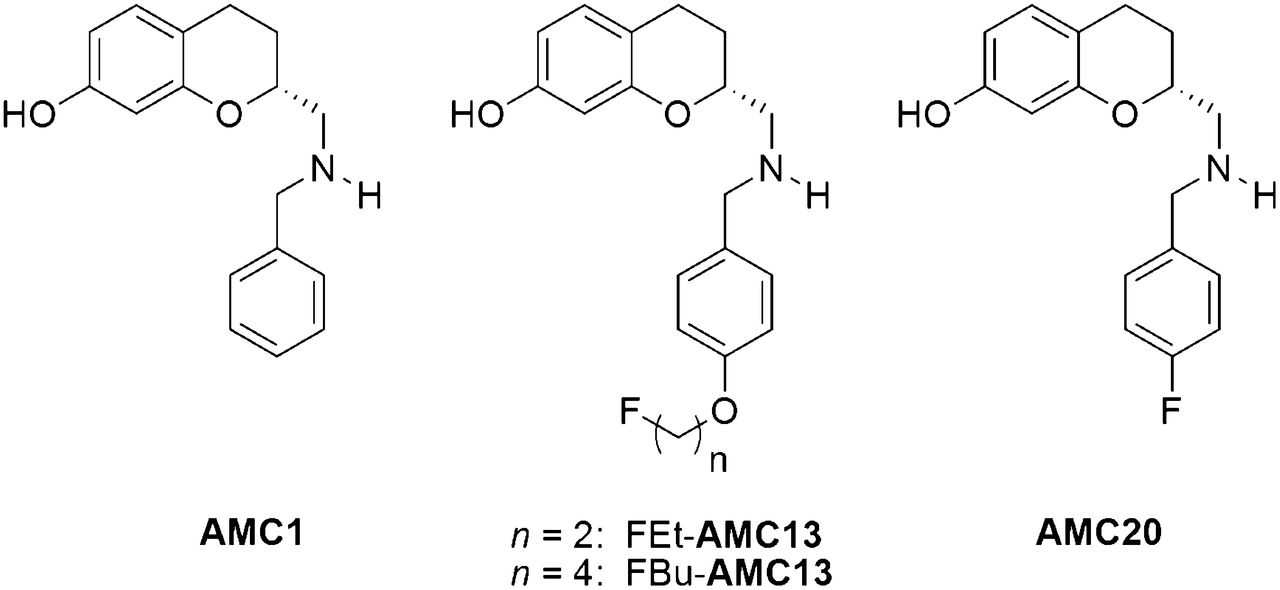
Elaborating on the molecules described by Mewshaw, in particular (R)-2-(benzylaminomethyl)chroman-7-ol (AMC1), we have recently prepared a series of fluorinated AMCs and evaluated them as potential PET tracers (15). By attaching a fluoroalkoxy moiety to the benzyl ring of AMC1 and systematically varying the length of the fluoroalkoxy group, we obtained FBu-AMC13 and FEt-AMC13 (Fig. 1). 18F-FEt-AMC13 demonstrated specific binding to striatal D2/3R in rat brain slices and in living rats, with a strong preference toward D2/3RHigh (high-affinity state of D2/3R) (16).

Structures of AMC1, FBu-AMC13, FEt-AMC13, and AMC20.
The 18F-fluorine label can also be attached directly to the benzyl ring of AMC1, minimizing the alteration of the AMC1 structure caused by the introduction of the label and providing greater potential in vivo stability than 18F-fluoroalkyl derivatives. In fact, a racemic para-fluorobenzyl derivative of AMC1 was already reported by Mewshaw to have subnanomolar affinity toward D2RHigh receptors and good selectivity against D2RLow (low-affinity state of D2R) (1). Here we report the preparation of the R enantiomer of this derivative, AMC20, and its in vitro and in vivo evaluation.
MATERIALS AND METHODS
Chemistry, Radiochemistry, and Pharmacology
The preparation and characterization of 18F-AMC20 and of its 19F reference and precursors are described in the supplemental materials (available at http://jnm.snmjournals.org).
In vitro binding experiments in HEK293 cell membrane homogenates were performed as described earlier (15). The β-arrestin recruitment assay was performed as described in the supplemental materials.
In vitro autoradiography in rat brain slices is described in detail in the supplemental materials. Briefly, sagittal slices from male Sprague–Dawley rats (Harlan) containing both striatum and cerebellum were incubated in a Tris-based buffer (pH 7.4) in the presence of varying concentrations of 18F-AMC20 (∼2–80 nM) with or without 10 μM raclopride (D2/3 antagonist) or 100 μM guanosine-5′-triphosphate sodium salt (GTP, stimulator of G-protein uncoupling from the receptors). Then the slices were washed, dried, and exposed against phosphor storage screens. On the resulting images, striatal and cerebellar regions of interest (ROIs) were manually drawn, and mean exposure per region was quantified.
Animals
Animal experiments were performed by licensed investigators in compliance with the Law on Animal Experiments of The Netherlands. The protocol was approved by the Committee on Animal Ethics of the University of Groningen. Young male (age, 10–12 wk; body weight, 300–350 g) Sprague–Dawley rats were used for all experiments. The rats were maintained on a 12-h light/12-h dark regime and were fed standard laboratory chow ad libitum.
Small-Animal PET
The distribution of 18F-AMC20 was studied in rats pretreated with physiologic saline (controls, n = 4) or the D2/3R antagonist raclopride (1 mg/kg) (as tartrate salt, n = 4). Saline and raclopride (in random order) were injected intravenously about 30 min before tracer injection. An extra group of rats (n = 4) was pretreated with saline and injected with 11C-raclopride to serve as positive controls for D2/3-specific brain uptake.
Before all manipulations, the animals were anesthetized with a mixture of isoflurane/air (inhalation anesthesia, 5% ratio during induction, 2% at maintenance). Cannulae were inserted into their left femoral arteries and veins; the operation took 45–50 min. Then the rats were positioned supine inside the camera (Focus 220 microPET; Siemens-Concorde), 2 at a time, one above the other with their heads in the camera’s field of view. A 515-s transmission scan with a 57Co point source was obtained. Tracer (18F-AMC20 or 11C-raclopride, Table 1) in 1 mL of saline was injected through the venous cannula as a 60-s-long bolus using an infusion pump. The second (upper) animal was injected 16 min after the first (lower).
Injected Doses and Pretreatment Timing
PET data were acquired using a list-mode protocol (106 min for 18F-AMC20, 76 min for 11C-raclopride). Acquisition began at the moment of the injection of radioactivity in the first rat.
In each rat, arterial blood samples of 0.10–0.15 mL were withdrawn through the arterial cannula at 10, 20, 30, 40, 50, 60, 90, 120, 180, 300, 450, 600, 900, 1,800, 3,600, and 5,400 (for 18F-AMC20) seconds after tracer injection.
After aliquots of intact blood were withdrawn, samples were centrifuged to obtain plasma. Radioactivity of plasma and intact blood aliquots was measured with a γ counter. Radiometabolite content in the deproteinated plasma was assessed by radio–thin-layer chromatography (radio-TLC). Detailed procedures of arterial blood and plasma workup are described in the supplemental materials.
After the end of the PET scans (98 ± 8 min after injection for 18F-AMC20), anesthetized animals were sacrificed by heart extirpation and dissected. Samples of brain and peripheral tissues were taken. All samples were weighed, and their radioactivity was measured with a γ counter.
Small-Animal PET Data Analysis
List-mode data from the 106-min-long and 76-min-long scans were reframed into, respectively, 90-min-long and 60-min-long dynamic sequences of 6 × 10, 4 × 30, 2 × 60, 1 × 120, 1 × 180, 4 × 300, 3 × 600, and (for 90-min-long scans) 2 × 900 s frames. The data were reconstructed per time frame using an iterative reconstruction algorithm (attenuation-weighted 2-dimensional ordered-subset expectation maximization, provided by Siemens; 4 iterations, 16 subsets; zoom factor, 2). Datasets were fully corrected for random coincidences, scatter, and attenuation. Data from the transmission scan were used for attenuation correction. The final datasets consisted of 95 slices, with a slice thickness of 0.8 mm and an in-plane image matrix size of 128 × 128 and pixel size of 0.47 × 0.47 mm.
PET data were analyzed with the Inveon 3.0 software package (Siemens Medical Solutions, USA, Inc.). ROIs were drawn manually on a T2-weighted MR imaging template of rat brain around the striatum, brain stem, cortex, hippocampus, hypothalamus, thalamus, olfactory bulbs, and cerebellum; around the whole brain; and around the pituitary gland. The MR imaging template was coregistered with the PET scan by image fusion. The time–activity curves per ROI were determined in Bq/cm3 and used in this form for kinetic analysis but converted into standardized uptake values for presentation purposes.
Kinetic analysis is described using the nomenclature proposed by Innis et al. (17). ROI time–activity curves were analyzed with 1-tissue and 2-tissue compartmental models (1TCM and 2TCM, respectively) of reversible binding and with Logan graphical analysis, using a metabolite-corrected plasma-derived arterial input function and whole blood time–activity curve. Fractional cerebral blood volume was defined as 3.6%. ROI time–activity curves were also analyzed with the simplified reference tissue model (SRTM), using the cerebellum as the reference region.
Distribution volumes (VTs) per ROI were determined from 1TCM- and 2TCM-derived rate constants and by Logan analysis.
Binding potentials (BPNDs) per ROI relative to the cerebellum were calculated from the obtained VT values as VT (target)/VT (cerebellum) – 1, or estimated directly with STRM.
Ex Vivo Autoradiography and Brain Radiometabolite Analysis
Anesthetized rats, pretreated with saline (n = 3) or raclopride (n = 3), were injected (30 ± 5 min after pretreatment) with a short bolus of 18F-AMC20 (3.8 ± 1.0 MBq, 0.75 ± 0.19 nmol/kg) into the penile vein. Rats were sacrificed by heart extirpation 35 min after injection. Brains were quickly extracted and separated into 2 halves along the sagittal symmetry plane or along the coronal plane spanning the thalamus.
One brain half was sliced on the microtome, and the slices containing the striatum were exposed against the phosphor storage screens. From the other half, radioactivity was extracted by homogenization in acetonitrile (>90% efficiency) and analyzed by radio-TLC. Detailed protocols for both procedures are presented in the supplemental materials.
Outcome Measures of D2/3R-Specific Binding
D2/3R-specific binding of 18F-AMC20 was quantified using BPND values (as described above) and specific binding ratios (SBRs), the latter calculated as target region activity/cerebellar activity – 1. Both were estimated under control conditions and under raclopride challenge conditions.
Statistics
All data are presented as mean ± SD. When a comparison of means was done, the 2-sided unpaired Welch t test was used. P values below 0.05 were considered significant. In the case of multiple comparisons, no correction of α levels was performed.
RESULTS
Pharmacology
Competition curves of 3H-spiperone displacement from the Long isoform of D2R (D2RLong) by AMC20 were significantly better fitted by the 2-site binding model (inhibition constant for the high-affinity state = 85 pM and inhibition constant for the low-affinity state = 84 nM, 988-fold difference) than by the 1-site binding model. The same was true for short isoform of D2R and D3R (Table 2). Such biphasic binding is a hallmark of an agonist, and the difference in the agonist affinities for the 2 recognized binding sites is known to correlate with the intrinsic activity (18). No second high-affinity binding component was detected for D1R. The D1R affinity of AMC20 was an order of magnitude lower than the lowest affinity at a D2-like receptor (Table 2).
In Vitro Affinity of AMC20 Toward Dopamine Receptor Subtypes
The arrestin recruitment assay showed AMC20 to be an almost full agonist (the maximum response achievable for the tested ligand [AMC20] relative to the maximum response achievable for dopamine, 90.3% ± 5.4%) with a decimal logarithm of the reciprocal of the ligand concentration (in mol/L) eliciting the response equal to the 50% of the maximum of 8.86 ± 0.05.
Radiochemistry
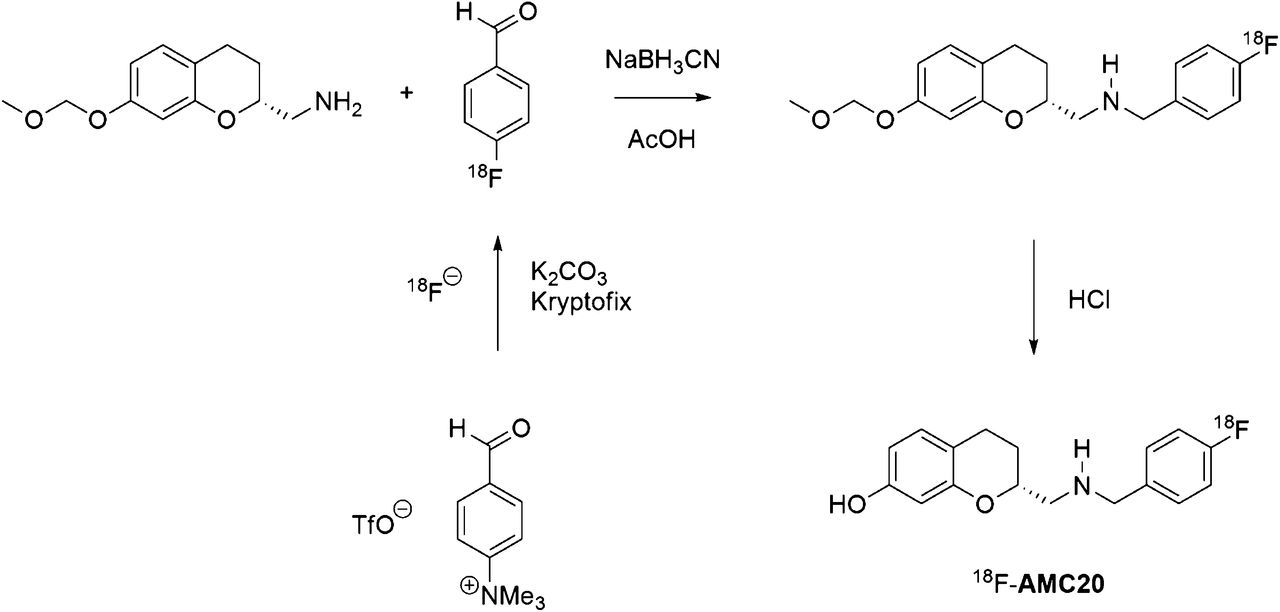
18F-AMC20 was synthesized within 150 min (including purification and quality control) using the 3-step 2-pot reductive amination procedure (Fig. 2) in a 24% ± 7% decay-corrected isolated radiochemical yield and greater than 95% radiochemical purity. The specific activity was 39 ± 23 GBq/μmol at the end of synthesis.

Radiosynthesis of 18F-AMC20.
The LogD distribution coefficient (octanol/phosphate buffer pH 7.4) of 18F-AMC20 was found to be 2.33 ± 0.03.
In Vitro Autoradiography
In rat brain slices, 18F-AMC20 showed preferential uptake in the D2/3R-rich striatum (Fig. 3A). At the lowest radioligand concentration tried (1.7 nM), striatal SBR of 18F-AMC20 was 5.27 ± 1.49 at baseline and 0.89 ± 0.29 (by 83%) in the presence of 10 μM raclopride, so 70% of the 18F-AMC20 binding in the striatum was D2/3R-specific. In the concentration range of 1.7–7.8 nM, 10 μM raclopride decreased striatal SBR values by 74%–89%, compared with control conditions, whereas 100 μM GTP decreased the SBR by 62%–78%, implying that most of the D2/3R-specific striatal binding of 18F-AMC20 was to the high-affinity subset of the receptors (Fig. 3B).

In vitro autoradiography assay results of 18F-AMC20. Representative images (A) and influence of radioligand concentration on mean (±SD) striatal SBR of 18F-AMC20 (B) in control slices and in slices coincubated with raclopride (10 μM) or GTP (100 μM). *P < 0.05 relative to control values, 2-sided Welch test.
Uptake in Living Rat Brain Under Control Conditions
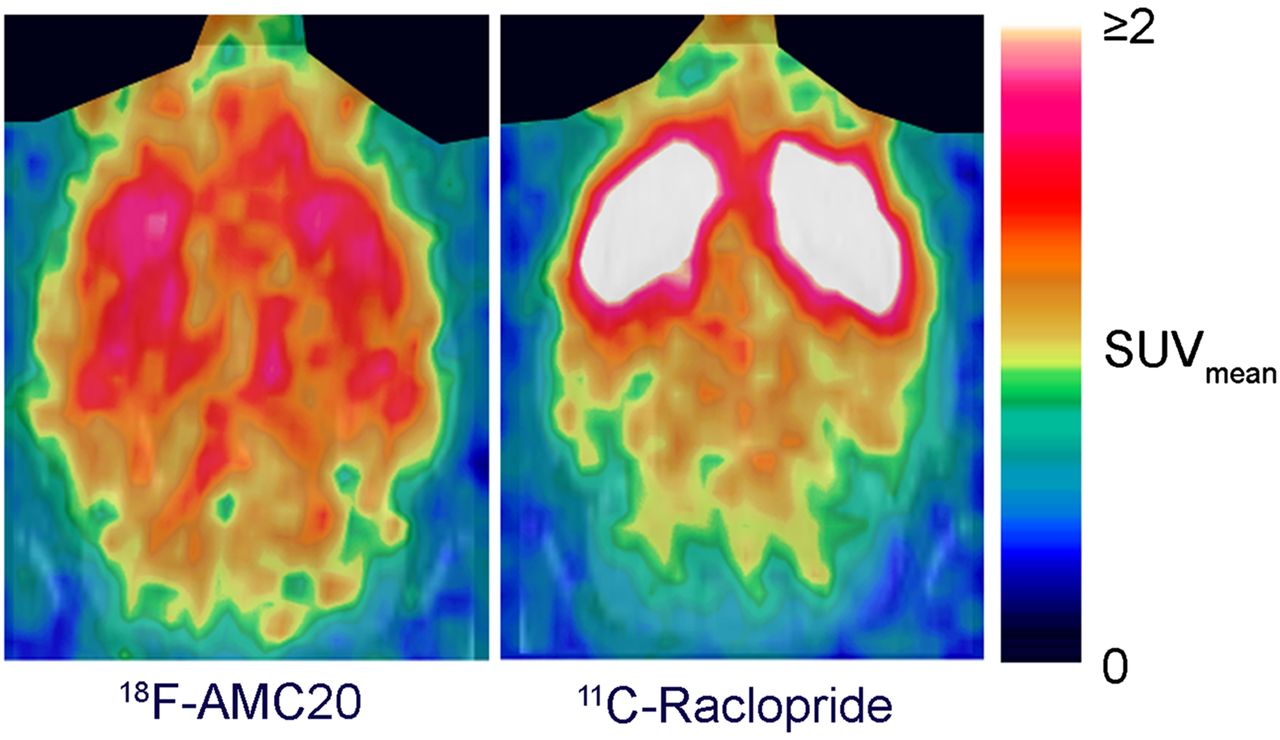
18F-AMC20 showed excellent blood–brain barrier penetration (Fig. 4): 3.5 min after injection, 1.7% injected dose (ID) accumulated in the brain.

Representative in vivo PET images of 18F-AMC20 and 11C-raclopride. Images are summed from 5 min after injection until end of scan. Harderian glands (on top) are masked. SUVmean = mean standardized uptake value.
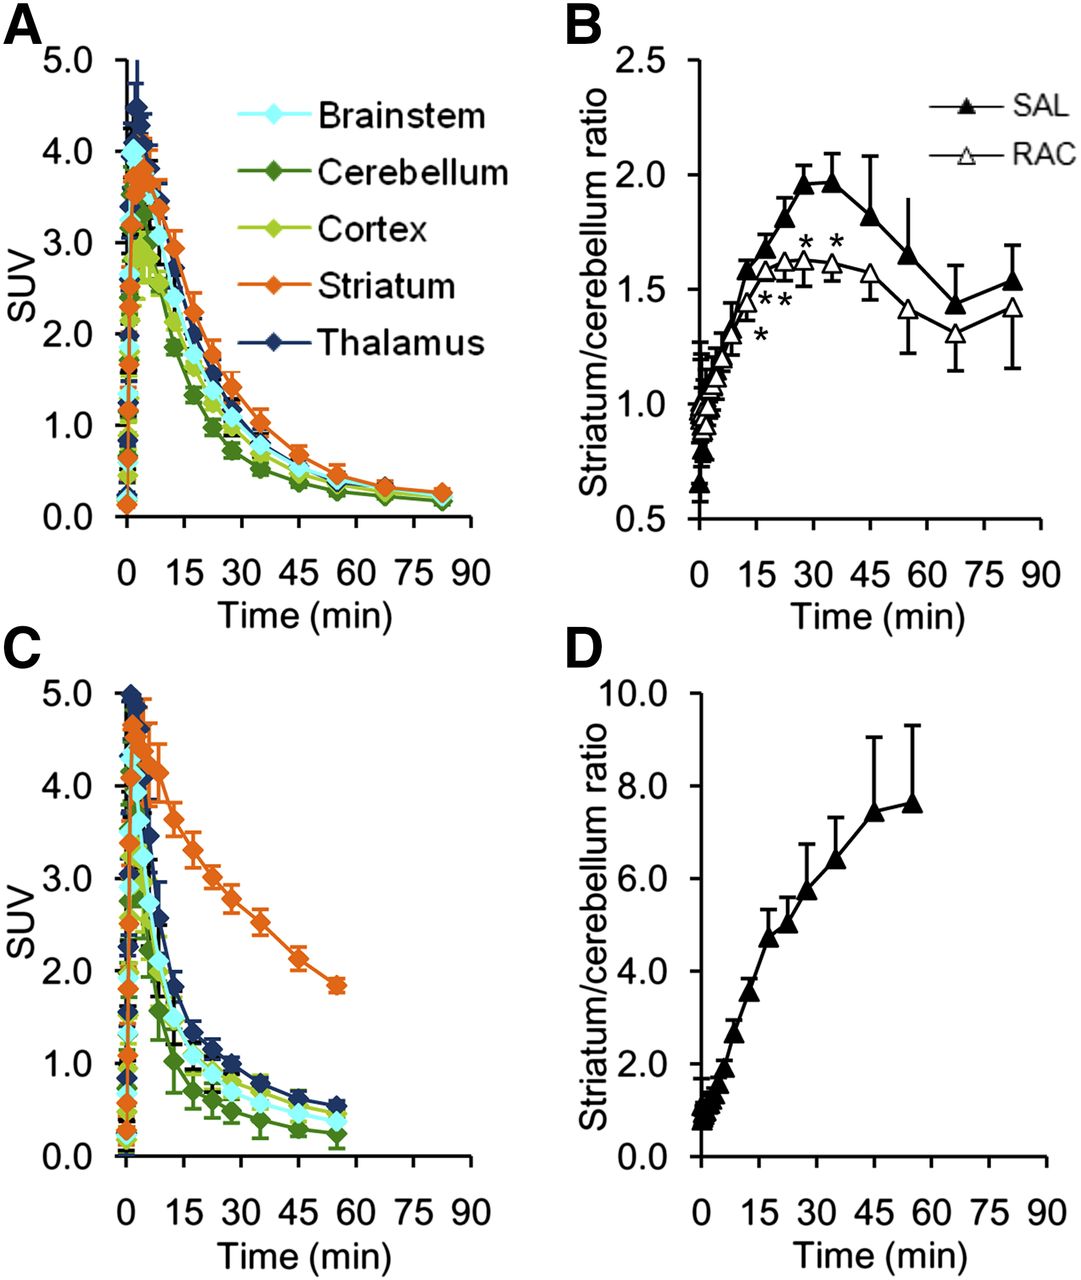
The tracer primarily accumulated in the striatum, whereas the cerebellum showed the lowest uptake (Fig. 5A). The PET-derived striatum–to–cerebellum uptake ratio of 18F-AMC20 peaked 35 min after injection at 1.97 ± 0.13 (Fig. 5B). The same ratio for 11C-raclopride 35 min after injection was 6.43 ± 0.89. The ex vivo autoradiography–derived striatum-to-cerebellum ratio of 18F-AMC20 at the same time after injection was 2.48 ± 0.34.

Uptake of 18F-AMC20 (A and B) and 11C-raclopride (C and D) in rat brain. (A and C) ROI time–activity curves of control rats. (B and D) Striatum-to-cerebellum ratios in saline (SAL) and raclopride-pretreated (RAC) rats. Points represent group means; error bars show SD. *P < 0.05 relative to control group, 2-tailed Welch t test. SUV = standardized uptake value.
Ex vivo measurements of the 18F-AMC20 uptake in the brain and peripheral tissues performed after the PET scan are given in Supplemental Table 1.
Tracer Metabolism
18F-AMC20 was quickly metabolized and excreted from the plasma (Fig. 6). Plasma elimination half-life was 3.9 min. Radiometabolites found in the plasma and in the radioactivity extracted from the brain 35 min after injection showed Rf values of 0 in the radio-TLC analysis, compared with an Rf of 0.65 for 18F-AMC20. Intact 18F-AMC20 constituted 95% of radioactivity from the above-mentioned brain tissue extract (Supplemental Fig. 2), suggesting that radiometabolites of 18F-AMC20 were hydrophilic and did not penetrate the blood–brain barrier.
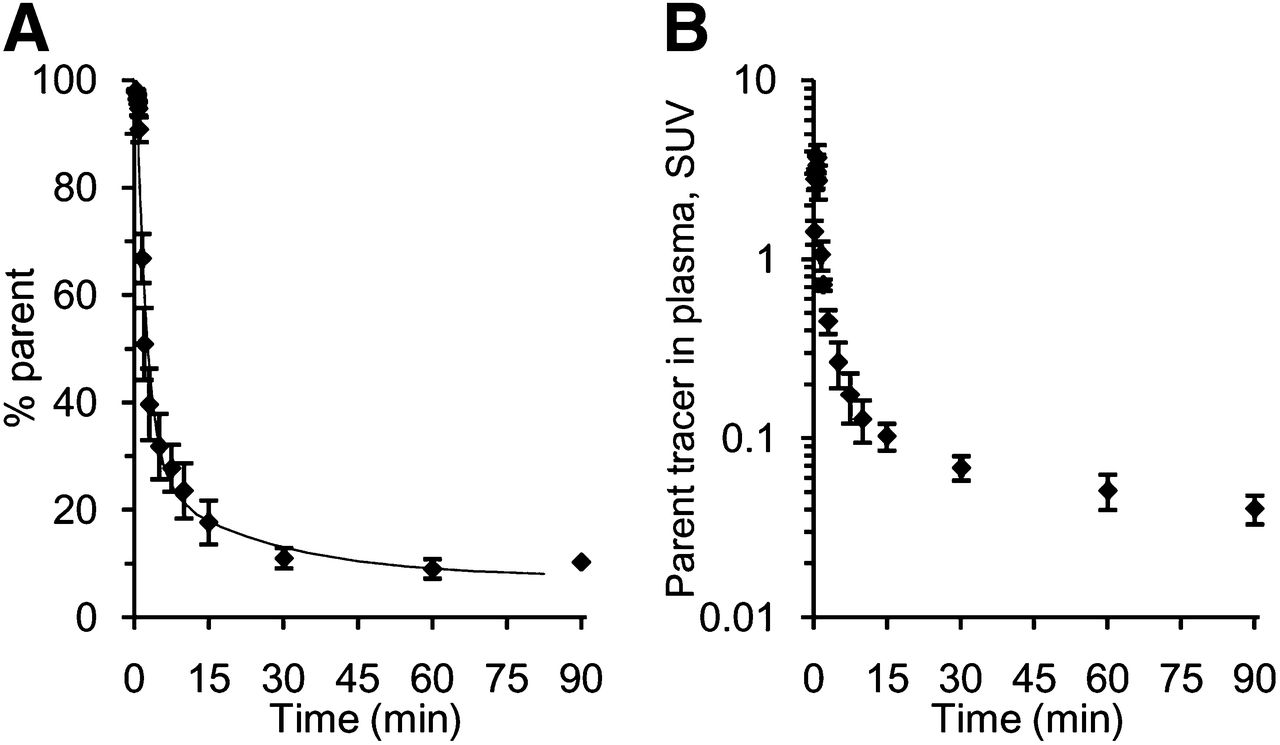
Metabolism and pharmacokinetics of 18F-AMC20 in plasma of living rats. (A) Percentage of parent in plasma radioactivity. (B) Intact 18F-AMC20 concentration in plasma. Points represent group means; error bars show SD. Horizontal axes show time after tracer injection. SUV = standardized uptake value.
In vivo defluorination was also low, as follows from the much lower tracer uptake in the parietal bone, compared with the brain tissue (Supplemental Table 1).
Kinetic Analysis
ROI time–activity curves of control rats were consistently better approximated by 2TCM and SRTM than by 1TCM (Supplemental Fig. 3), as assessed by the Akaike information criterion. However, no consistent estimates of individual rate constants could be obtained from 2TCM fits (Supplemental Table 2).
Logan graphical analysis produced the most robust ROI VT estimates (Supplemental Table 3). 2TCM-derived VT values correlated better with Logan VT values (r = 0.98) than did 1TCM VT values (r = 0.95; Supplemental Fig. 4). The 2TCM rate constant ratios k3/k4 did not provide robust BPND estimates (data not shown), but VT-based 2TCM BPNDs were robust and correlated better with Logan BPND values (r = 0.99) than did 1TCM BPND values (r = 0.93).
SRTM BPND values correlated best with Logan BPNDs (r = 0.95), somewhat less well with 2TCM BPNDs (r = 0.92), and still less well with 1TCM BPNDs (r = 0.88; Supplemental Fig. 5).
The highest BPND values in saline-pretreated rats, 0.49–0.59 depending on the estimation method, were found in the striatum (Table 3; Supplemental Table 4).
Logan- and SRTM-Derived BPND Values for 18F-AMC20
Raclopride Challenge
Raclopride pretreatment resulted in a 35% decrease of peak PET-derived striatal SBRs of 18F-AMC20 relative to controls (0.63 ± 0.12 vs. 0.97 ± 0.13, P < 0.01). Blockade of D2/3R-specific signal in the striatum was clearly seen on the ex vivo autoradiography images (Supplemental Fig. 6), and autoradiography-based SBR fell by 41% (0.88 ± 0.21 vs. 1.48 ± 0.34, P < 0.01).
Depending on the model used for kinetic analysis, striatal BPNDs fell by 21%–29% (P < 0.05 for SRTM; P < 0.07 for Logan and 1TCM; P = 0.09 for 2TCM; Table 3; Supplemental Table 4).
The occupancy of D2/3R by raclopride estimated from ROI VT values with modified Lassen plot analysis (19) was found to be 34%–37% (P < 0.05 for 1TCM, 2TCM, and Logan). Comparison of the actual ROI VT values with the estimated nondisplaceable volume of distribution implied that 39%–48% of striatal VT and 5%–22% of cerebellar VT were potentially displaceable (Supplemental Fig. 5).
DISCUSSION
This study is a continuation of our work on the development of D2/3R agonist PET tracers based on the AMC scaffold (15,16). Here we evaluated in vitro and in vivo a new candidate tracer, AMC20.
AMC20 was confirmed to be a potent D2R agonist by the arrestin recruitment assay and demonstrated the highest D2RHigh affinity (85 pM) and D2RHigh/D2RLow selectivity (988-fold) of all AMCs so far evaluated by us (Table 2). Likewise, in rat brain slices 18F-AMC20 exhibited high striatal SBRs and was as highly sensitive to the high-affinity state of D2/3R-eliminating GTP as to the D2/3R-blocker raclopride.
In living rats, 18F-AMC20 penetrated the blood–brain barrier well and preferentially accumulated in the striatum. The 2TCM model approximated the time–activity curves of 18F-AMC20 generally better than the 1TCM model, but there was no consistency in the estimates of individual rate constants of 2TCM. It may be that the data (i.e., PET counts and input curves) were not of sufficiently high quality to precisely estimate these constants. Still, the VT values derived from the 2TCM rate constants, as well as VT-based BPND values, were robust and consistent, so these outcome measures were used for the evaluation of 18F-AMC20. Interestingly, both VT and BPND obtained from 2TCM correlated better than VT and BPND obtained from 1TCM with the corresponding measures obtained by Logan analysis, which does not assume any particular number of kinetic compartments.
Changes of striatal BPND and SBR induced by 1 mg of raclopride per kilogram were generally consistent with the estimates of D2/3R occupancy by raclopride but disagreed with the literature data for 11C-labeled D2/3R agonists: as little as 0.2 mg/kg displaced over 80% of apparent D2/3R-specific 11C-(+)PHNO uptake (20), whereas 1–2 mg of raclopride per kilogram displaced more than 90% specific striatal uptake of 11C-MNPA and 11C-PHNO in Sprague–Dawley rats (20–22).
Crude estimation of the D2/3R occupancy by 18F-AMC20 in our experiments, assuming the equality of non–D2/3R-specific binding in the striatum and cerebellum and using the approach described by Skinbjerg et al. (23), produced values ranging from 2% to 15% (7% on average). These values mean our injected tracer doses could have been high enough to cause a mass effect, distorting our measurements. However, baseline SBRs and BPNDs of 18F-AMC20 in control rats did not tend to decrease with the injected dose (Supplemental Fig. 6), so we do not consider the violation of tracer conditions likely.
Imprecise estimation of the specific portion of total tracer binding, resulting from high nonspecific binding, may have led to the underestimation of the degree of specific binding blockade by raclopride. Low apparent displacement of D2/3R-specific striatal binding may also suggest that in the brain 18F-AMC20 specifically binds to sites other than D2/3R, which have comparatively high density in the striatum. Binding to D1 has been ruled out in this study, whereas racemic AMC20 was shown to be selective for D2R against the serotonin-1A (5-hydroxytryptamine subtype 1A)and α1 receptors (14), but selectivity against other nondopaminergic receptors has yet to be tested.
Compared with the earlier evaluated 18F-FEt-AMC13 (16), 18F-AMC20 showed greater decrease of striatal SBRs and BPND in response to raclopride treatment in living rats (Supplemental Table 5). However, 18F-AMC20 is inferior to existing 11C-labeled D2/3 agonists (13,21,22) in terms of baseline striatal BPND (0.49–0.59 vs. >0.8) and, apparently, also in terms of sensitivity to raclopride treatment.
The higher nonspecific binding of 18F-AMC20, resulting from its considerably higher lipophilicity (LogD, 2.33 ± 0.03) relative to 18F-FEt-AMC13 (LogD, 1.67 ± 0.07), seems to have prevented 18F-AMC20 from attaining a high signal-to-noise ratio despite its high affinity toward D2/3RHigh.
18F-AMC20 and 18F-FEt-AMC13, both based on the AMC1 structure, have, therefore, 2 common problems. One is the low signal-to-noise ratio, dependent on the association and dissociation rates of tracer binding to the receptors. Signal-to-noise ratio may be limited by the nonspecific binding of the tracer in the tissue, which leaves less free tracer available for specific binding, or by the quick release of specifically bound agonist tracer from the receptors due to the receptor’s relaxation into the low-affinity state after G-protein activation by an agonist—a known potential issue for agonist tracers of G-protein–coupled receptors (11).
Another problem is the suspected lack of pharmacologic selectivity of 18F-AMC20 and 18F-FEt-AMC13 toward D2/3R.
Screening of the AMC20 and FEt-AMC13 against nondopaminergic receptors and more thorough studies of their binding kinetics in a more controlled environment (in vitro) are necessary to find out which factors limit the signal-to-noise ratio of these compounds as D2/3R imaging agents and to produce and evaluate new optimized AMC derivatives.
CONCLUSION
We have evaluated a novel aminomethyl chromane–derived D2/3R agonist radiopharmaceutical. The agonist, AMC20, demonstrated high affinity toward the high-affinity state of human D2/3RLong in cell membrane homogenates. 18F-AMC20 showed specific binding to the striatal D2/3R in rat brain slices in vitro as well as in living rat brain. The signal-to-noise ratio of 18F-AMC20 was on a par with that of the structurally related tracer 18F-FEt-AMC13 evaluated by us earlier (16). Further investigations of the structure–activity relationships of 18F-AMC20 and related compounds can lead to a radioligand suitable for D2/3R imaging in vivo.
DISCLOSURE
The costs of publication of this article were defrayed in part by the payment of page charges. Therefore, and solely to indicate this fact, this article is hereby marked “advertisement” in accordance with 18 USC section 1734. This work was supported by a grant from the Dutch Technology Foundation STW (grant 10127). No other potential conflict of interest relevant to this article was reported.
Acknowledgments
We thank J.A.J.M. (Jef) Vekemans, Eindhoven University of Technology, (TU/e), for his advice on synthetic design; J.L.J. (Joost) van Dongen and R.A.A. (Ralf) Bovee (both TU/e) for their expertise on and execution of the HRMS measurements and the elemental analyses, respectively; E.W. (Bert) Meijer (TU/e and ICMS Eindhoven) for enabling the execution of the synthetic part of the presented research; and Aren van Waarde, Antoon Willemsen, Janine Doorduin, Jurgen Sijbesma, and Mohammed Khayum (all Department of Nuclear Medicine and Molecular Imaging, University Medical Center Groningen, University of Groningen) for their advice on the design and help with the execution of the small-animal PET study.
Footnotes
Published online Dec. 4, 2014.
- © 2015 by the Society of Nuclear Medicine and Molecular Imaging, Inc.
REFERENCES
- Received for publication July 10, 2014.
- Accepted for publication November 6, 2014.


Jump to section
Related Articles
Cited By...
- No citing articles found.