


Abstract
Deregulated cellular metabolism is a hallmark of many cancers. In addition to increased glycolytic flux, exploited for cancer imaging with 18F-FDG, tumor cells display aberrant lipid metabolism. Pivalic acid is a short-chain, branched carboxylic acid used to increase oral bioavailability of prodrugs. After prodrug hydrolysis, pivalic acid undergoes intracellular metabolism via the fatty acid oxidation pathway. We have designed a new probe, 3-18F-fluoro-2,2-dimethylpropionic acid, also called 18F-fluoro-pivalic acid (18F-FPIA), for the imaging of aberrant lipid metabolism and cancer detection. Methods: Cell intrinsic uptake of 18F-FPIA was measured in murine EMT6 breast adenocarcinoma cells. In vivo dynamic imaging, time course biodistribution, and radiotracer stability testing were performed. 18F-FPIA tumor retention was further compared in vivo to 18F-FDG uptake in several xenograft models and inflammatory tissue. Results: 18F-FPIA rapidly accumulated in EMT6 breast cancer cells, with retention of intracellular radioactivity predicted to occur via a putative 18F-FPIA carnitine-ester. The radiotracer was metabolically stable to degradation in mice. In vivo imaging of implanted EMT6 murine and BT474 human breast adenocarcinoma cells by 18F-FPIA PET showed rapid and extensive tumor localization, reaching 9.1% ± 0.5% and 7.6% ± 1.2% injected dose/g, respectively, at 60 min after injection. Substantial uptake in the cortex of the kidney was seen, with clearance primarily via urinary excretion. Regarding diagnostic utility, uptake of 18F-FPIA was comparable to that of 18F-FDG in EMT6 tumors but superior in the DU145 human prostate cancer model (54% higher uptake; P = 0.002). Furthermore, compared with 18F-FDG, 18F-FPIA had lower normal-brain uptake resulting in a superior tumor-to-brain ratio (2.5 vs. 1.3 in subcutaneously implanted U87 human glioma tumors; P = 0.001), predicting higher contrast for brain cancer imaging. Both radiotracers showed increased localization in inflammatory tissue. Conclusion: 18F-FPIA shows promise as an imaging agent for cancer detection and warrants further investigation.
Tumors reprogram their energy metabolism to support synthesis of proteins, lipids, and nucleotides required for growth, invasion, and metastasis (1). The significantly increased glucose utilization of tumors in comparison to normal tissue (the Warburg effect), for instance, has been exploited clinically to detect tumors and their response to treatment by 18F-FDG PET.
In addition to increased glycolytic flux, elevated de novo fatty acid synthesis and upregulated plasma membrane turnover in tumors, required for membrane synthesis during proliferation (2), have been traced with 11C- and 18F-labeled acetate and choline analogs (3–5). Although rates of glycogenesis, glutaminolysis, and fatty acid synthesis during the metabolic reprogramming of cancer cells have been comprehensively described, only recently has the role of fatty acid oxidation for cancer cell function been examined in detail (reviewed by Carracedo et al. (6)). Fatty acids provide an abundant energy source resulting from a cyclical series of reactions in the mitochondria that act to shorten the fatty acid and generate reduced nicotinamide adenine dinucleotide, reduced flavin adenine dinucleotide, and acetyl coenzyme A (CoA). The imaging of aberrant fatty acid oxidation by PET after malignant transformation has yet to be explored.
Short-chain carboxylates including acetate, propionate, butyrate, and the nonnatural substrate pivalate (trimethylacetate) use the early steps of the fatty acid oxidation pathway involving acyl-CoA and acyl-carnitine synthesis (7–9). Unlike acetate, however, pivalate cannot be oxidized to carbon dioxide in mammalian cells (10). We have designed a new probe, 3-18F-fluoro-2,2-dimethylpropionic acid, also called 18F-fluoro-pivalic acid (18F-FPIA; Fig. 1A), to image the early steps of the fatty acid oxidation pathway in cancer. We have recently reported the radiosynthesis of 18F-FPIA (11). In the present study, we evaluated the in vitro tumor cell uptake and metabolic stability of 18F-FPIA in tissues. We further investigated the potential utility of 18F-FPIA PET for tumor imaging in several xenograft models, in inflammatory tissue, and by comparison with 18F-FDG PET.
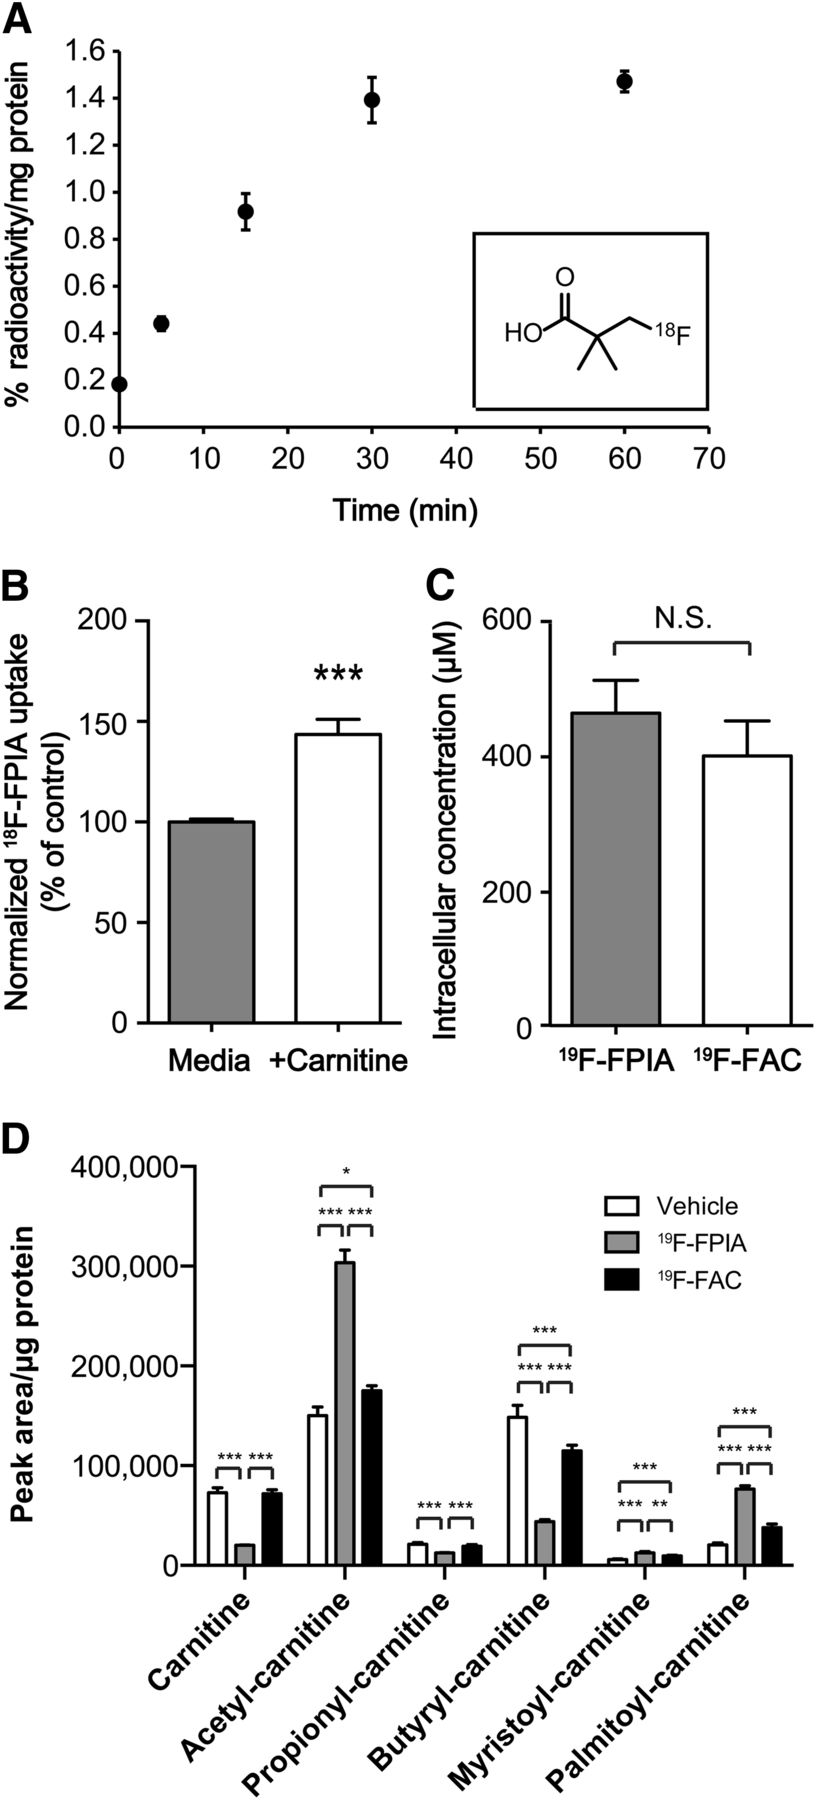
18F-FPIA uptake and metabolism in cancer cells. (A) Time course of 18F-FPIA uptake in EMT6 cells (n = 3). Inset: chemical structure of 18F-FPIA. (B) Effect of exogenous 10 μM carnitine on 18F-FPIA uptake, trapping, and retention in EMT6 cells (n = 3). (C) Intracellular accumulation of 19F-FPIA and 19F-FAC in human breast adenocarcinoma BT474 cells at 24 h as analyzed by liquid chromatography–mass spectrometry (n = 4). Effect of exogenous 19F-FPIA and 19F-FAC on intracellular metabolite concentrations of acyl-carnitine esters as analyzed by liquid chromatography–mass spectrometry (n = 4). Data are mean ± SD. NS = not statistically significant.
MATERIALS AND METHODS
Cell Culture
EMT6 murine breast cancer cells (donation from Dr. Sofia Pascu, University of Bath, U.K.) were grown in Waymouth medium (Life Technologies), with U87 human glioma cells (LGC Standards) grown in Dulbecco modified Eagle medium (Life Technologies). DU145 (donation from Dr. Almut Schulze, CRUK London Research Institute, U.K.) and BT474 (LGC Standards) were grown in RPMI (Life Technologies). All media were supplemented with 2.5 mL of penicillin/streptomycin (100 IU⋅mL−1/100 μg⋅mL−1) and 2 mM l-glutamine (Life Technologies). Waymouth medium contained 15% fetal calf serum, with 10% fetal calf serum added to Dulbecco modified Eagle medium and RPMI. All cells were propagated at 37°C in a humidified atmosphere containing 5% CO2.
Radiosynthesis
Automated radiosynthesis of 18F-FPIA was based on previously described methodology (11), as detailed in the supplemental materials (available at http://jnm.snmjournals.org). 18F-FPIA was obtained in an end-of-synthesis yield of 7.7% ± 5.0% (n = 9) in approximately 90 min from aqueous fluoride to formulation with radiochemical purity of more than 99%. Accurate and reliable measurement of specific activity was not possible by high-performance liquid chromatography because of the low ultraviolet absorbance of FPIA (11). 18F-FDG was purchased from PETNET Solutions.
Measurements in Cells
EMT6 cells (2 × 10⁵) were plated into 6-well plates overnight before 18F-FPIA uptake analysis. On the day of the experiment, fresh growth medium containing 0.74 MBq of 18F-FPIA was added to individual wells (1 mL/well). Cell uptake was measured over 60 min after radiotracer addition. Plates were placed on ice, washed 3 times with ice-cold phosphate-buffered saline (PBS), and lysed in radioimmunoprecipitation assay buffer (Thermo Fisher Scientific Inc.; 1 mL, 10 min). Cell lysates were transferred to counting tubes, and decay-corrected radioactivity was determined on a γ counter (Cobra II Auto-Gamma counter; Packard Biosciences Co.). Aliquots were snap-frozen and used for protein determination after radioactive decay using a bicinchoninic acid 96-well plate assay (Thermo Fisher Scientific Inc.). In addition, 10 μL standards from a 0.74 MBq/mL stock solution were counted to quantitate percentage radiotracer uptake. For carnitine treatment, cells were incubated with 10 μM l-carnitine for the duration of the uptake time course.
For the assessment of cell uptake and resulting intracellular concentrations of 19F-FPIA and 19F-fluoroacetate (19F-FAC), BT474 cells were seeded in 12-well plates at 2 × 10⁵ cells per well. A separate plate was seeded in parallel to determine the cell number and average intracellular volume per cell (Casy Cell Counter) and the amount of extraction solution to be added (1 mL/1 × 106 cells). The cells were treated with vehicle (dimethylsulfoxide), 19F-FPIA, or 19F-FAC (500 μM) and incubated for 18 h. The cells were washed once in 3 mL of ice-cold PBS, and intracellular metabolites were immediately extracted into a solution of methanol, acetonitrile, and water (5:3:2). Extracts were stirred in a vortex mixer for 10 min at 4°C and centrifuged at 16,500g at 4°C for 15 min. Supernatants were removed and analyzed by liquid chromatography–mass spectrometry (ZIC-pHelic high-performance liquid chromatography columns and Exactive Plus Orbitrap MS; ThermoScientific). Data were analyzed using Xcalibur and LCQuan software (ThermoScientific). 19F-FPIA and 19F-FAC external standards were run in parallel and used to convert peak area to mass. In addition, after extraction, cells were dried to completion before protein measurement (12) to determine the relative changes in the abundance of intracellular metabolites.
Measurements in Animal Models
All animal experiments were performed by licensed investigators in accordance with the United Kingdom Home Office guidance on the operation of the Animals (Scientific Procedures) Act 1986 and within the published guidelines for the welfare and use of animals in cancer research (13). EMT6 tumor cells (2 × 10⁶; 100 μL of PBS) were injected subcutaneously on the back of female BALB/c mice (aged 6–8 wk; Charles River) and grown to approximately 150 mm3. U87 tumors were grown after subcutaneous injection of 5 × 10⁶ cells (100 μL of PBS) on the back of female BALB/c nude mice (aged 6–8 wk; Charles River), with BT474 tumors induced after injection of 5 × 10⁶ cells in Matrigel (BD Biosciences; 1:1 ratio of PBS to Matrigel; 100 μL total). DU145 prostate adenocarcinoma xenografts were grown in male BALB/c nude mice (aged 6–8 wk; Charles River) after injection of 1 × 10⁶ cells (1:1 PBS to Matrigel; 100 μL). U87, BT474, and DU145 tumors were grown to approximately 100 mm3 before analysis. Tumor dimensions were measured periodically using a caliper (by the same experienced researcher), and tumor volumes were calculated by the following equation: volume = (π/6) × a × b × c, where a, b, and c represent 3 orthogonal axes of the tumor (14). For these measurements, animals were kept in a warm environment to avoid skin folds that can confound measurements.
Inflammation was induced in an aseptic inflammation model, through intramuscular injection of turpentine oil (30 μL) into the right posterior thigh of the mice, as previously described (15). For the analysis of radiotracer stability and metabolism, radiolabeled metabolites from plasma and tissues were quantified using a semiautomated method adapted from Smith et al. (16), fully described in the supplemental materials.
For biodistribution studies, 18F-FPIA (∼3.7 MBq) was injected via the tail vein of anesthetized EMT6 tumor–bearing BALB/c mice. The mice were maintained under anesthesia and sacrificed by exsanguination via cardiac puncture at 2, 15, 30, 60, 120, or 180 min after radiotracer injection and tissues harvested (n = 3 mice per group). Biodistribution studies were performed under anesthesia to permit comparison with dynamic imaging data. Biodistribution studies with BT474 and U87 tumor–bearing nude mice were performed 60 min after 18F-FPIA injection. Tissue radioactivity was determined on a γ counter (Cobra II Auto-Gamma counter) and decay-corrected. Ten-microliter standards from a 1:100 dilution of the stock activity were also counted for data normalization. Plasma was obtained from terminal blood samples after centrifugation (6,000g, 5 min). Data were expressed as percentage injected dose per gram of tissue (%ID/g).
18F-FPIA images were obtained on a GENISYS4 small-animal PET scanner (Sofie Biosciences), after a bolus intravenous injection of approximately 1.85 MBq of the radiotracer into tumor-bearing mice. Static scans were acquired for 10 min (at 50–60 min or 110–120 min), and images were reconstructed using maximum-likelihood expectation maximization (matrix size, 208 × 96 × 96). In a different cohort of mice, dynamic PET imaging (binned into the following frames: 15 s × 4, 60 s × 4, and 300 s × 11) was performed on an Inveon PET/SPECT/CT scanner (Siemens Medical Solutions; matrix size, 256 × 256 × 159) as described in detail in the supplemental materials. Dynamic PET imaging was performed for the 18F-FPIA and 18F-FDG comparison study in EMT6 tumor-bearing mice, with 50- to 60-min cumulative images of the dynamic data used for image reconstruction. Static scans on the GENISYS4 were used for all other experiments (n = 4 mice per group). Comparable performance of the 2 scanners has previously been established (17). Inveon Research Workplace software was used to visualize radiotracer uptake in the tumor and to manually define the 3-dimensional volumes of interest. Tumor radioactivity was normalized to that of the whole body to obtain the normalized uptake value (NUV) to permit comparison of data obtained using the 2 scanners.
RESULTS
Tumor Cell Uptake and Metabolism
Uptake of 18F-FPIA into EMT6 tumor cells was linear over the initial 30 min of incubation, reaching 1.40% ± 0.10% radioactivity per milligram of protein. By 60 min after radiotracer addition, cell uptake had plateaued at 1.47% ± 0.04% radioactivity per milligram of protein (Fig. 1A). 18F-FPIA uptake increased by 44% compared with control cells after incubation with 10 μM l-carnitine (Fig. 1B), suggesting possible use of carnitine for esterification of 18F-FPIA, although other mechanisms, for example, inhibition of acyl-carnitine efflux transporters, could be at play.
Unlabeled 19F-FPIA was also avidly taken up by BT474 cells, detected by mass spectrometry (Fig. 1C). At the higher probe concentrations used (500 μM in medium), we confirmed the presence of intracellular 19F-FPIA; however, no other metabolites were observed. The presence of a CoA derivative of 19F-FPIA could not be ruled out, since in control experiments with 19F-FAC, only the parent compound and 19F-fluorocitrate were observed (Fig. 1C and Supplemental Fig. 1A, respectively), which implies conversion via fluoroacetyl-CoA. Intracellular levels of 19F-FPIA were similar to those of 19F-FAC and its derived compounds (Fig. 1C). In addition, 19F-FAC but not 19F-FPIA caused negative feedback inhibition in cells (a significant increase in citrate and cis-aconitate, together with a significant decrease in α-ketoglutarate due to inhibition of aconitase; Supplemental Figs. 1B–1D). In contrast, 19F-FPIA produced a strong and specific reduction of intracellular nonesterified carnitine (Fig. 1D). 19F-FAC did not decrease intracellular carnitine, demonstrating differences between these 2 compounds. Furthermore, 19F-FPIA showed specific induction of acetylcarnitine, myristoylcarnitine, and palmitoylcarnitine but a decrease in medium-chain acylcarnitines (Fig. 1D and Supplemental Fig. 2). Conversely, medium-chain acylcarnitines were increased after 19F-FAC treatment (Supplemental Fig. 2).
Measurements In Vivo
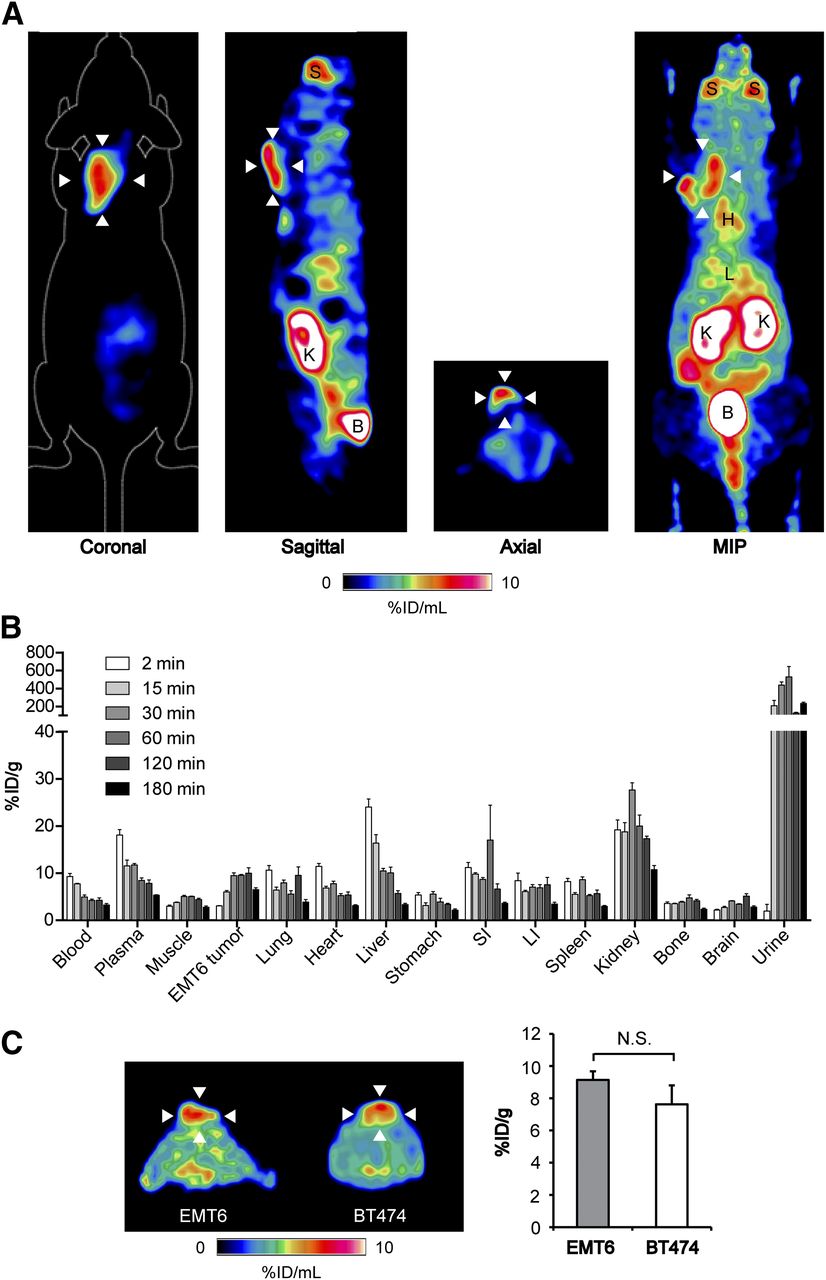
We next evaluated 18F-FPIA for in vivo tumor imaging. Substantial 18F-FPIA tumor localization was measured by PET in EMT6 murine breast adenocarcinoma xenografts, clearly visible above background normal tissue. High 18F-FPIA uptake was also observed in the bladder, kidney, and salivary glands. Representative static 18F-FPIA scans showing the 3 orthogonal axes of EMT6 tumor–bearing mice and an associated maximum-intensity projection 110–120 min after injection are shown in Figure 2A, with the time course biodistribution of 18F-FPIA over 180 min illustrated in Figure 2B. Similar to in vitro cell uptake, tumor-associated radioactivity linearly increased over the initial 30 min after injection to 9.3 ± 1.0 %ID/g, followed by stable retention in the tumor up to 120 min after radiotracer injection (9.8 ± 2.0 %ID/g). By 180 min, tumor-associated 18F-FPIA reduced 36% to 6.3 ± 0.7 %ID/g. 18F-FPIA pharmacokinetics were characterized by initial liver uptake, followed by rapid clearance, with the urinary tract being the primary route of excretion, determined both by biodistribution (Fig. 2B) and from tissue time–activity curves derived from dynamic imaging studies (Supplemental Fig. 3). Optimum tumor-to-blood and tumor-to-muscle ratios were achieved at 120 min after injection, at 2.4 and 2.3, respectively (Table 1), although these were not substantially different from those at 60 min (1.9 and 2.3, respectively). For practical reasons (including the comfort of subjects), 60 min was used for further dynamic and static imaging studies. Furthermore, tumor radioactivity was comparable for both the murine and the human breast adenocarcinoma tumor models, reaching 9.1 ± 0.5 %ID/g and 7.6 ± 1.2 %ID/g at 60 min after injection in EMT6 and BT474 tumors, respectively (Fig. 2C).

Time course 18F-FPIA pharmacokinetics and 18F-FPIA PET imaging of breast cancer xenografts. (A) Representative coronal, sagittal, axial, and maximum-intensity-projection PET images (10-min static scan) for 18F-FPIA obtained 110–120 min after injection in EMT6 tumor–bearing mice. Arrowheads indicate tumor. (B) Time course 18F-FPIA biodistribution performed at 2, 15, 30, 60, 120, and 180 min after injection. Approximately 3.7 MBq of 18F-FPIA were injected into anesthetized EMT6 tumor–bearing BALB/c mice, which were sacrificed at the indicated time points. Data are mean ± SD (n = 3 mice per group). (C) Comparison between 18F-FPIA uptake in murine EMT6 and human BT474 breast tumors (n = 4 mice per group). B = bladder; H = heart; K = kidneys; L = liver; LI = large intestine; MIP = maximum intensity projection; NS = not statistically significant; S = salivary gland; SI = small intestine.
Time Course 18F-FPIA Tumor–to–Tissue Ratios in EMT6 Xenografts
Radiotracer Stability In Vivo
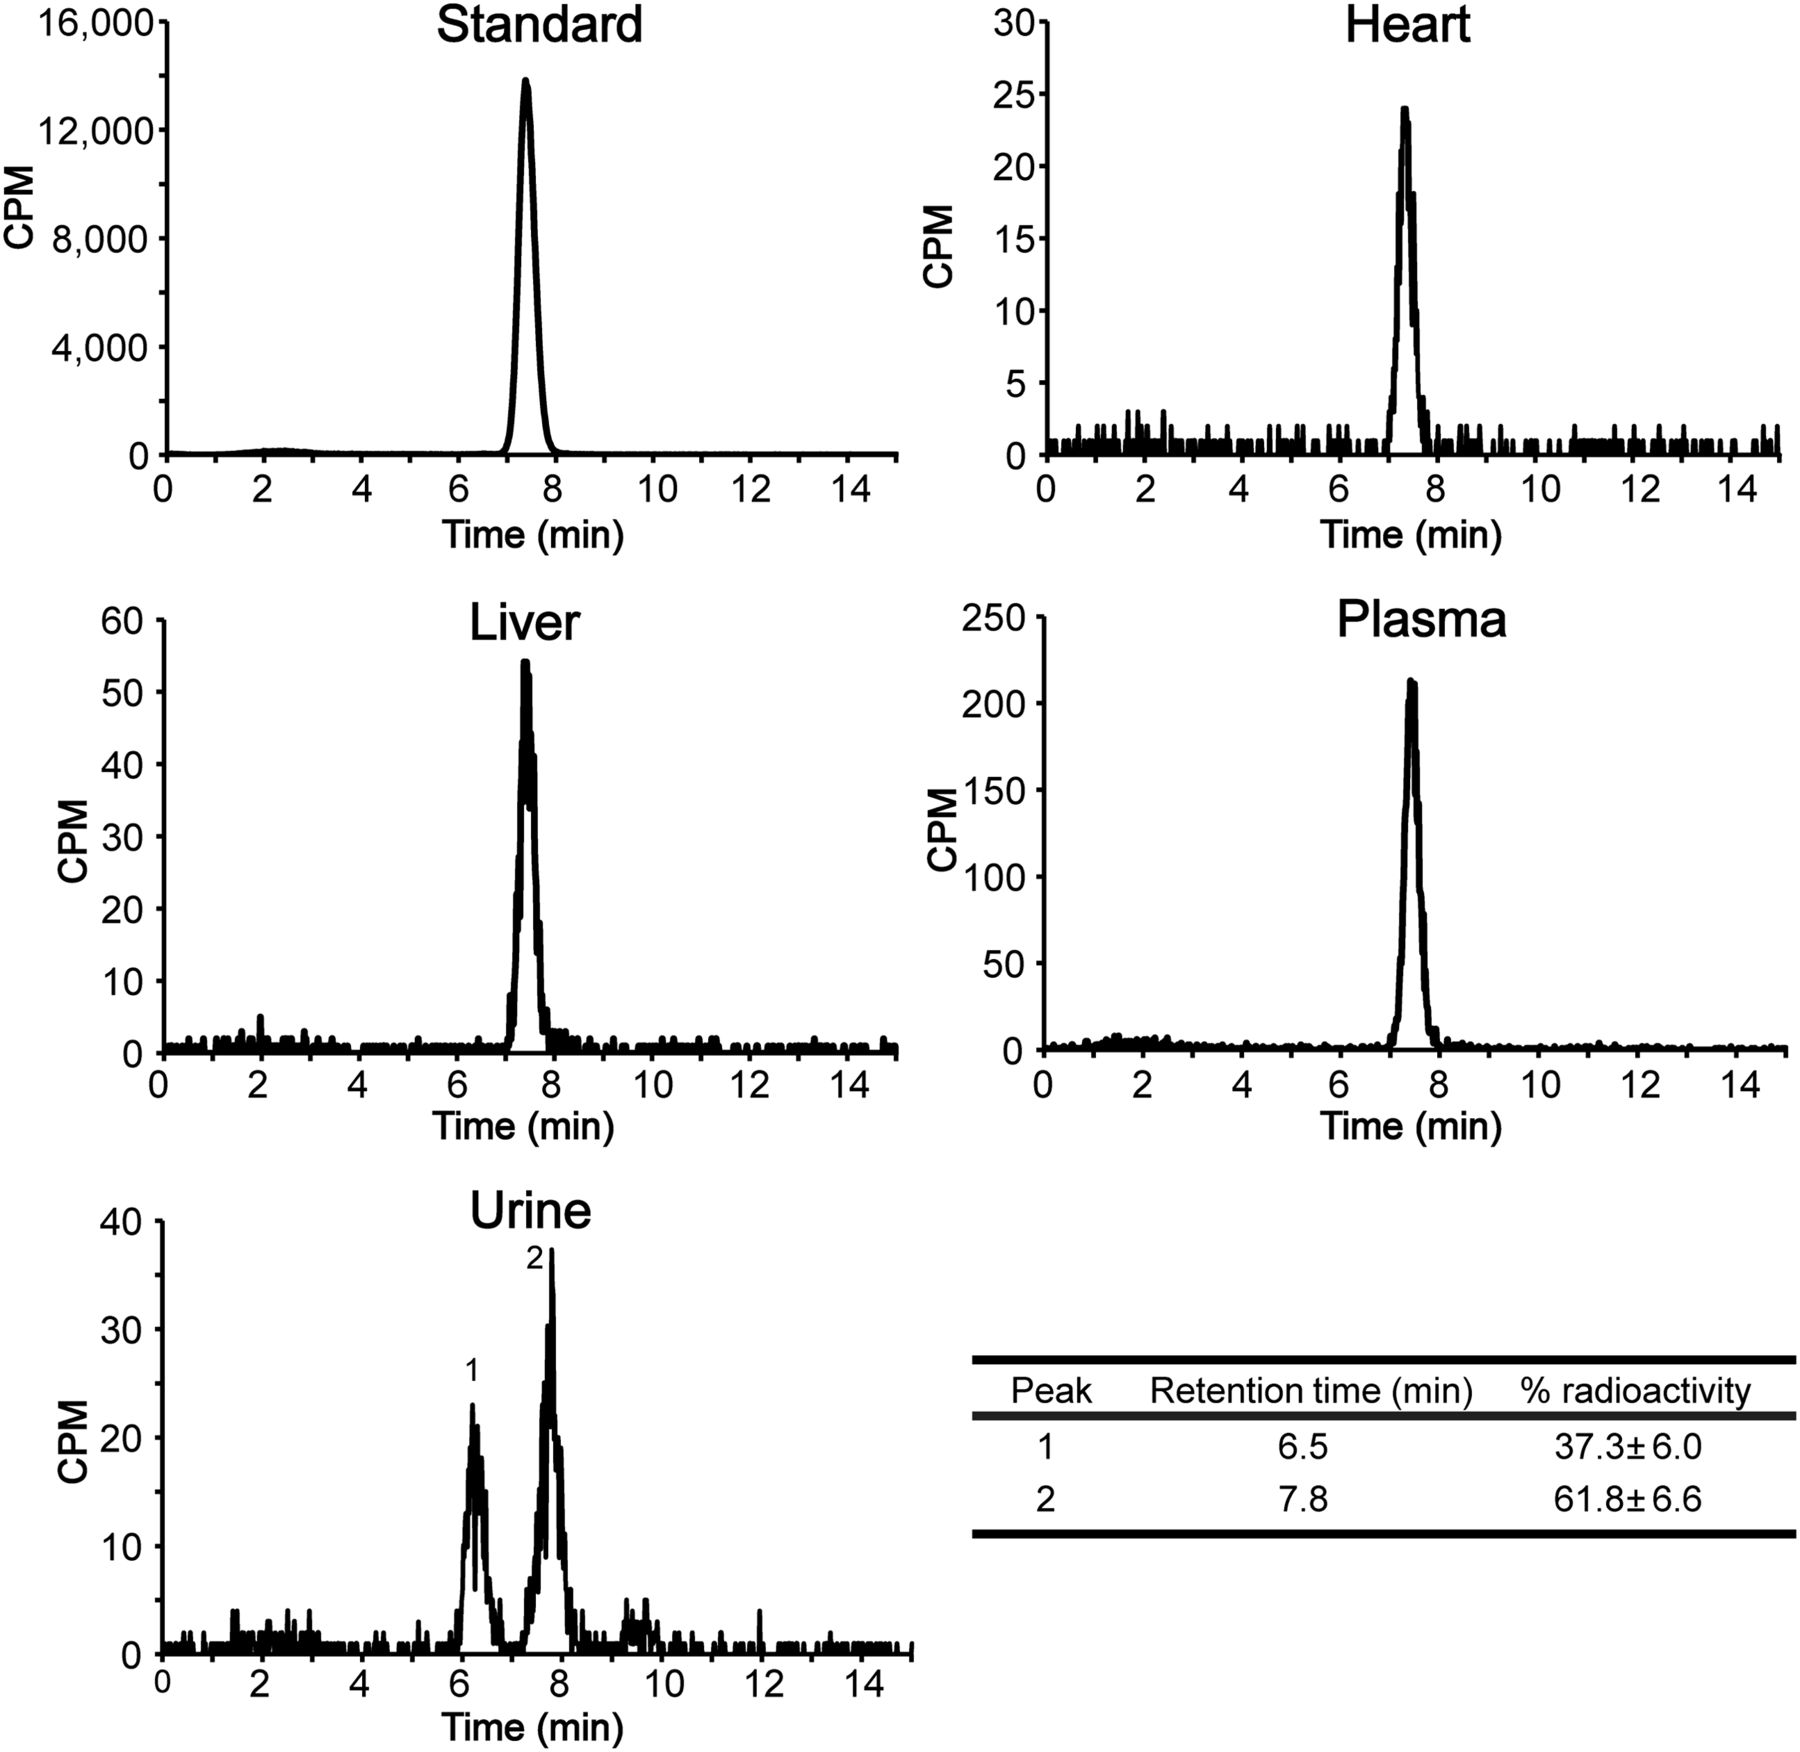
To confirm that tissue-associated radioactivity corresponded with parent 18F-FPIA, rather than undesired degradation products, 18F-FPIA stability was tested in tissues. 18F-FPIA showed good stability in plasma, liver, and heart at 30 min after injection, with only the peaks of the parent compound detectable by radio-high-performance liquid chromatography (Fig. 3). In the urine, the parent peak was the dominant fraction at 30 min (61.8% ± 6.6% radioactivity), with an additional unidentified metabolite peak observed at 6.5 min (37.3% ± 6.0% radioactivity).

Representative radio-high-performance liquid chromatography analysis of mouse tissue extracts. Tissues were obtained 30 min after intravenous injection of 18F-FPIA into non–tumor-bearing BALB/c mice and compared with injection-ready 18F-FPIA as standard. Percentage urine radioactivity of 18F-FPIA (peak 2; retention time, 7.8 min) and unknown metabolite (peak 1; retention time, 6.5 min) are shown. Data are mean ± SD (n = 3 mice). Table shows urine metabolite analysis.
Comparison of 18F-FPIA to 18F-FDG for Tumor Detection
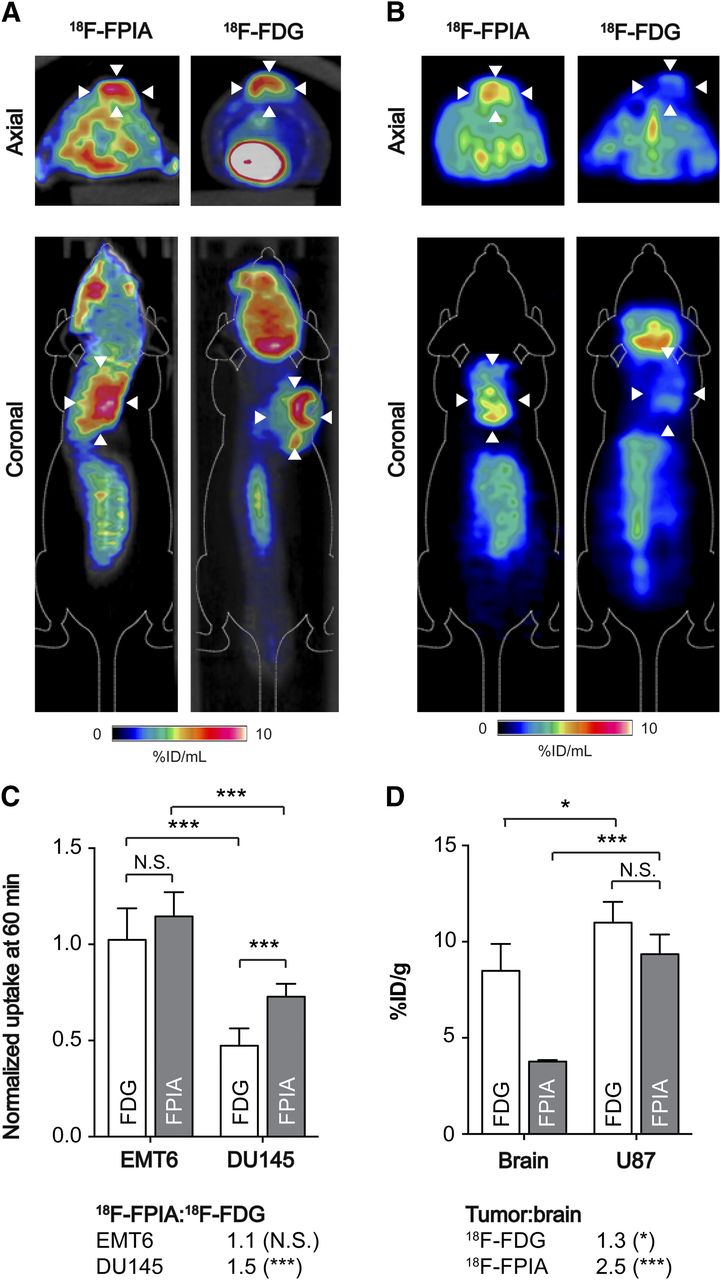
Given the promising 18F-FPIA uptake in EMT6 and BT474 tumors, dynamic 18F-FPIA PET imaging was performed over 60 min and compared with the gold-standard PET tracer for tumor diagnosis, 18F-FDG; the same scanner was used for both radiotracers. High tumor uptake was detected by PET for both 18F-FPIA and 18F-FDG in EMT6 tumors, illustrated in 50- to 60-min images (Fig. 4A). In contrast, DU145 prostate adenocarcinoma tumors were clearly discernible by 18F-FPIA PET, whereas tumor-associated radioactivity with 18F-FDG was not visible above background in 50- to 60-min static scans (Fig. 4B). For EMT6 tumors, tumor–to–whole-body normalized uptake reached 1.02 ± 0.16 NUV at 60 min for 18F-FDG, compared with 1.15 ± 0.13 for 18F-FPIA (Fig. 4C; P = 0.08; n = 4–6). Semiquantitative imaging parameters derived from the tumor time–activity curve also could not differentiate between these 2 tracers (Supplemental Fig. 4). Although lower than for EMT6 tumors, 18F-FPIA tumor uptake was 54% higher than 18F-FDG in DU145 prostate tumors, at 0.73 ± 0.07 and 0.47 ± 0.09 NUV, respectively (Fig. 4C; P = 0.002; n = 4–5).

Tumor imaging with 18F-FPIA and 18F-FDG PET. (A) Representative axial and coronal PET/CT images (50–60 min of summed activity) for 18F-FPIA and 18F-FDG in EMT6 tumor–bearing mice. Arrowheads indicate tumor, identified from CT image. (B) Representative axial and coronal PET images of DU145 tumor–bearing mice (50–60 min of summed activity) for 18F-FPIA and 18F-FDG. (C) Semiquantitative tumor uptake values for DU145 and EMT6, extracted from PET images and normalized to whole-body radioactivity. Data are mean ± SD (n = 4–6 mice per group). (D) 18F-FPIA and 18F-FDG biodistribution in U87 tumor–bearing mice. Approximately 3.7 MBq of 18F-FPIA were injected into anesthetized BALB/c mice, which were sacrificed 60 min after injection. Data are mean ± SD (n = 4 mice per group). *P < 0.05 ***P < 0.001. NS = not statistically significant.
Given that 18F-FPIA passes the blood–brain barrier, shown by γ counting (Fig. 2B), we next tested the potential to use 18F-FPIA to detect tumors of the brain, comparing uptake values to 18F-FDG using the well-characterized U87 glioma model. In these human-derived xenografts, similarly high 18F-FPIA and 18F-FDG tumor uptake was measured 60 min after radiotracer injection, at 9.35 ± 1.0 %ID/g and 11.0 ± 1.1 %ID/g, respectively (Fig. 4D; P = 0.07; n = 4). However, because of its low background retention, 18F-FPIA provided a significantly higher tumor-to-brain ratio of 2.5, compared with just 1.3 with 18F-FDG (P = 0.001; n = 4).
Inflammatory cells are known to display both elevated glycolysis and fatty acid oxidation (18). Given this, we explored 18F-FPIA and the known ability of 18F-FDG to image this condition using an aseptic inflammation model. Both 18F-FPIA and 18F-FDG accumulated in chemically induced inflammatory tissues, at 6.53 ± 1.13 %ID/g and 5.86 ± 0.68 %ID/g, respectively (Fig. 5). There was no significant difference between inflammation-to-muscle ratios for 18F-FPIA (2.36) and 18F-FDG (2.66). Inflammation was confirmed by histologic analysis after imaging (Fig. 5C).
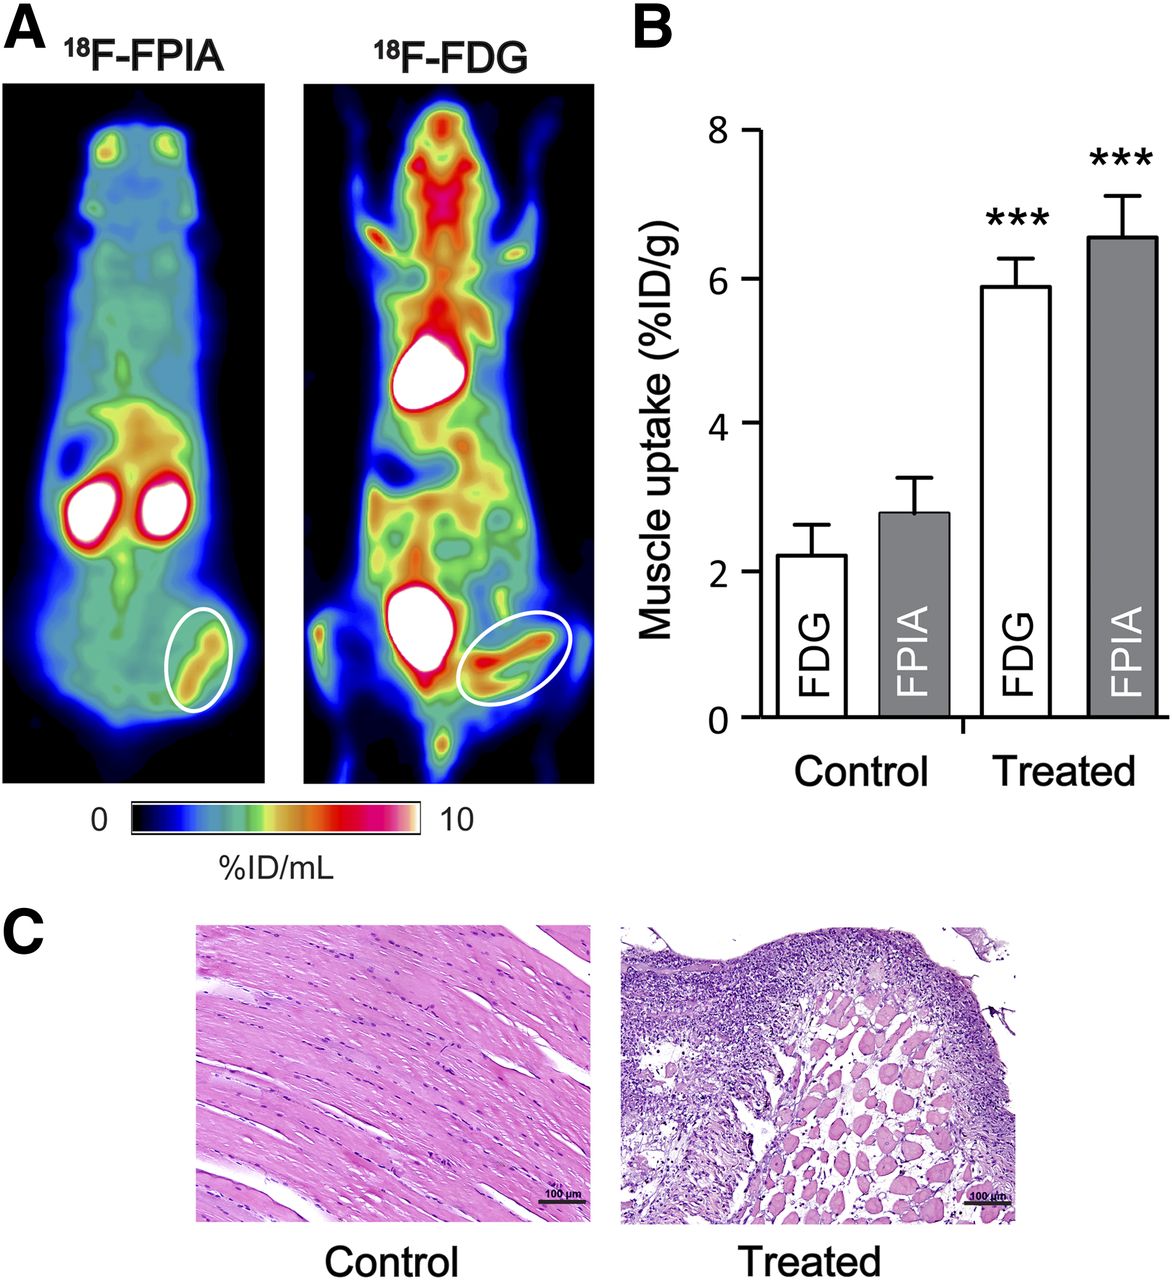
18F-FPIA and 18F-FDG uptake in aseptic inflammation model. (A) Representative coronal PET images (30- to 60-min summed frames) for 18F-FPIA and 18F-FDG. Turpentine-induced inflammatory tissue is circled in white. (B) 18F-FPIA and 18F-FDG biodistribution of turpentine-treated and control, untreated posterior thigh muscle. Data are mean ± SD (n = 3–4). (C) Immunohistochemistry analysis by hematoxylin and eosin staining in control and turpentine-treated muscle. Representative photographs of stained sections were acquired at ×200 magnification. Scale bar = 100 μm. ***P < 0.001.
DISCUSSION
Pivalic acid is a short-chain carboxylic acid, containing a gem-dimethyl group, and structural analog of propionate. Pivalic acid pharmacokinetics and intracellular metabolism at pharmacologic doses have been well described in the literature as the result of the widespread use of pivalic acid–containing prodrugs (reviewed by Brass (10)). Pivalate is intracellularly activated by acyl-CoA synthetases to pivaloyl-CoA, which, like other short-chain fatty acids including acetate and propionate, is transient in cells (7,8,19). Oxidation to CO2 is not possible in mammalian cells. Instead, transesterification of pivaloyl-CoA to pivaloyl-carnitine occurs under the action of carnitine acyl transferases (20). Pivaloyl-carnitine is membrane-impermeable and is transported out of tissues via the human kidney carnitine transporter, OCTN2, whose transport is competitively inhibited by l-carnitine (21). In this study, we used trace quantities of pivalic acid labeled with 18F (18F-FPIA) and investigated its behavior in vivo as a possible PET tracer for cancer imaging.
The increased uptake of 18F-FPIA after incubation with l-carnitine warranted further investigation of putative 18F-FPIA CoA or carnitine ester. Extensive work to synthesize the 19F-FPIA CoA or carnitine ester reference material was unsuccessful. Using mass spectrometry, we confirmed intracellular levels of 18F-FPIA, but again we could not rule out the existence of metabolites by comparison to 19F-FAC. Supporting these data, carnitine esters have previously been shown to be major metabolic products of both 13C-acetate and 13C-propionate catabolism in the heart, measured over a far shorter experimental window of 70 s by hyperpolarized 13C MR spectroscopy—with CoA esters a minor metabolic product (19). Here, 19F-FPIA treatment of cells resulted in a striking alteration in the levels of carnitine and associated acylcarnitine esters when compared with vehicle control (Fig. 1D). This observation is in keeping with the finding of profound carnitine deficiency as a result of pivalate toxicity in patients (22) and provides a direct link between FPIA and fatty acid oxidation. We speculate that decreases in medium-chain acylcarnitines could be due to inhibition of medium-chain acylcarnitine transferases by FPIA or FPIA esters (medium-chain species). The inhibitory effect on medium-chain acylcarnitines might have led to increased short-chain and long-chain acylcarnitines in order to maintain a normal fatty acid oxidation status. This hypothesis, however, requires further testing. Thus, whereas the mechanism of 18F-FPIA trapping is likely to occur via CoA and carnitine esters, we have not conclusively proven that in the work reported here.
Time course biodistribution studies revealed organ-specific variations in 18F-FPIA retention and pharmacokinetics, characterized by initial uptake in the liver and clearance primarily through the urinary tract and, to a lesser extent, hepatobiliary elimination; assessment of metabolism in intestinal contents will further clarify the nature of the radioactive species in this tissue. In agreement with previously published data on carnitine-acylcarnitine distribution (23), liver-associated 18F-FPIA rapidly equilibrated with the plasma compartment. The relatively high overall plasma concentration (∼5–18 %ID/g over 2–180 min) and plasma half-life (20.2 min) of 18F-FPIA observed here is almost certainly accounted for by the high reabsorption rate of small-chain fatty acids by the proximal tubules (24), with FPIA and its metabolites excreted into the urine (Fig. 3). The distribution profile of 18F-FPIA in other organs was also in keeping with the known tissue pharmacokinetics of pivalic acid in rodents (8). Of note, our study with 18F-FPIA (both biodistribution and imaging) was done under anesthesia, and such should be kept in mind during interpretation of the study results.
We further showed that 18F-FPIA preferentially accumulates in murine and human tumors of the breast, brain, and prostate used in this study. We speculate that upregulation of enzymatic activity (e.g., acetyl CoA synthetase and carnitine acetyltransferase), decreased OCTN2 expression, or elevated pools of metabolic intermediates may account for increased tumor–to–normal tissue retention. High serum carnitine (∼60 μM in healthy adult men (25)) may further enhance 18F-FPIA tumor retention, analogous to the increased uptake measured in cell experiments after addition of exogenous carnitine. We compared tumoral 18F-FPIA uptake with 18F-FDG uptake and retention. Although it was impossible to differentiate between the 2 radiotracers by NUVs in the breast adenocarcinoma xenografts, 18F-FPIA radiotracer retention was 54% higher in the prostate xenografts than with 18F-FDG, indicating the potential utility for 18F-FPIA for prostate cancer detection. Voiding of bladder radioactivity should enable good prostate tumor delineation, given the urinary excretion profile of 18F-FPIA. Further work is required to assess the effect of grade or androgen receptor status on 18F-FPIA uptake. We also observed that 18F-FPIA uptake was significantly lower than 18F-FDG uptake in the normal brain. The improved human glioma tumor-to-brain ratio of 2.5 for 18F-FPIA, versus 1.3 for 18F-FDG, could be advantageous for 18F-FPIA visualization of brain tumors when compared with 18F-FDG. One limitation of 18F-FPIA is that it does not appear to provide an advantage over 18F-FDG for the differential diagnosis of cancer versus inflammation (Fig. 5) (26). This warrants further studies of this radiotracer in nonmalignant inflammation-related pathologies, including Alzheimer's disease and multiple sclerosis.
CONCLUSION
18F-FPIA was designed for the imaging of aberrant lipid metabolism associated with malignant transformation. The radiotracer showed high accumulation in breast, prostate, and brain tumor models—accumulation comparable or superior to that of 18F-FDG. The lower normal-brain uptake (and hence the inferred superior tumor-to-brain contrast) is a promising characteristic for brain tumor imaging. Future work will further investigate the underlying molecular mechanisms that govern 18F-FPIA uptake and evaluate its potential for orthotopic brain tumor imaging before clinical translation.
DISCLOSURE
The costs of publication of this article were defrayed in part by the payment of page charges. Therefore, and solely to indicate this fact, this article is hereby marked “advertisement” in accordance with 18 USC section 1734. This work was funded by a Cancer Research U.K. Discovery award (C11589/A13222). A patent on this invention (application number: PCT/GB2014/051405) has been filed. No other potential conflict of interest relevant to this article was reported.
Acknowledgments
We thank Dr. Almut Schulze for donation of DU145 cells, Dr. Sofia Pascu for EMT6 cells, and Dr. Laurence Carroll for technical assistance.
Footnotes
Published online Jul. 10, 2014.
- © 2014 by the Society of Nuclear Medicine and Molecular Imaging, Inc.
REFERENCES
- Received for publication March 17, 2014.
- Accepted for publication May 19, 2014.


