


Abstract
Phosphodiesterase (PDE) 10A is an enzyme involved in the regulation of cyclic adenosine monophosphate and cyclic guanosine monophosphate and is highly expressed in medium-sized spiny neurons of the striatum, making it an attractive target for novel therapies for a variety of neurologic and psychiatric disorders that involve striatal function. Potential ligands for PET imaging of PDE10A have been reported. Here, we report the first-in-human characterization of 2 new PDE10A radioligands, 2-(2-(3-(1-(2-fluoroethyl)-1H-indazol-6-yl)-7-methyl-4-oxo-3,4-dihydroquinazolin-2-yl)ethyl)-4-isopropoxyisoindoline-1,3-dione (18F-MNI-654) and 2-(2-(3-(4-(2-fluoroethoxy)phenyl)-7-methyl-4-oxo-3,4-dihydroquinazolin-2-yl)ethyl)-4-isopropoxyisoindoline-1,3-dione (18F-MNI-659), with the goal of selecting the best one for use in future studies interrogating pathophysiologic changes in neuropsychiatric disorders and aiding pharmaceutical development targeting PDE10A. Methods: Eleven healthy volunteers participated in this study (18F-MNI-654 test–retest, 2 men; 18F-MNI-659 test–retest, 4 men and 1 woman; 18F-MNI-659 dosimetry, 2 men and 2 women). Brain PET images were acquired over 5.5 h for 18F-MNI-654 and over 3.5 h for 18F-MNI-659, and pharmacokinetic modeling with plasma- and reference-region (cerebellar cortex)-based methods was performed. Whole-body PET images were acquired over 6 h for 18F-MNI-659 and radiation dosimetry estimated with OLINDA. Results: Both radiotracers were similarly metabolized, with about 20% of intact parent remaining at 120 min after injection. PET time–activity data demonstrated that 18F-MNI-654 kinetics were much slower than 18F-MNI-659 kinetics. For 18F-MNI-659, there was good agreement between the Logan and simplified reference tissue models for nondisplaceable binding potential (BPND), supporting noninvasive quantification, with test–retest variability less than 10% and intraclass correlation greater than 0.9. The 18F-MNI-659 effective dose was estimated at 0.024 mSv/MBq. Conclusion: PET imaging in the human brain with 2 novel PDE10A 18F tracers is being reported. Noninvasive quantification of 18F-MNI-659 with the simplified reference tissue model using the cerebellum as a reference is possible. In addition, 18F-MNI-659 kinetics are fast enough for a good estimate of BPND with 90 min of data, with values around 3.0 in the basal ganglia. Finally, 18F-MNI-659 dosimetry is favorable and consistent with values reported for other PET radiotracers currently used in humans.
Cyclic nucleotides are major regulatory molecules of both short-term and long-term function in every known neuronal population. The modulation of cyclic nucleotides, especially cAMP (cyclic adenosine monophosphate), is a major target of many pharmaceutical agents for a large number of diverse brain disorders. Specificity has usually been achieved by modulating specific G-protein–coupled receptors that in turn regulate adenyl cyclase. Phosphodiesterases (PDEs), grouped into 11 families (PDE1–PDE11), act by catalyzing the breakdown of cAMP or cGMP (cyclic guanosine monophosphate) and allow additional opportunities to target specific neuron types, brain regions, disease states, or cyclase pathways that are not regulated by G-protein–coupled receptors (1–4).
PDE10A, highly expressed in the brain and strongly enriched in medium spiny neurons of the striatum, particularly in primates (5,6), catalyzes breakdown of both cAMP and cGMP (7) and is the major source of cAMP breakdown in the striatum among PDEs (8). PDE10A is therefore an attractive target for novel therapies for a variety of neurologic and psychiatric disorders that involve striatal function (9), including Parkinson disease (10), Huntington disease (11,12), schizophrenia (13,14), memory disorders (15), depression, and addiction (16). Animal models of Huntington disease have shown that PDE10A expression is an extremely sensitive marker of striatal neuron loss (12,17), and Parkinson disease models have been used to demonstrate possible roles of PDE10A in both the early motor symptoms and the late complications of Parkinson disease due to prominent PDE10A-dependent dysregulation of corticostriatal signaling (10,18). Developing imaging agents to accurately and sensitively interrogate PDE10A in vivo would greatly help in understanding changes in PDE10A in human brain disorders and speed the development of potential therapeutics targeting this enzyme.
Potential ligands for PET imaging of PDE10A have been reported (19–24). Papaverine, a widely used inhibitor of PDE10A activity, lacked suitable imaging characteristics when 11C-labeled (22). 11C-MP-10, another PDE10A inhibitor, was found to have good imaging qualities (19,24) despite a radiolabeled metabolite capable of penetrating the blood–brain barrier (24). 18F-JNJ41510417 was demonstrated to have good pharmacologic and anatomic specificity in rodent PET studies (23) but had a radiometabolite entering the brain. More recently, human studies with 18F-JNJ42259152 were reported (20,25).
Previously, we reported on the evaluation in nonhuman primates of the 2 novel PDE10A radiotracers 2-(2-(3-(1-(2-fluoroethyl)-1H-indazol-6-yl)-7-methyl-4-oxo-3,4-dihydroquinazolin-2-yl)ethyl)-4-isopropoxyisoindoline-1,3-dione (18F-MNI-654) and 2-(2-(3-(4-(2-fluoroethoxy)phenyl)-7-methyl-4-oxo-3,4-dihydroquinazolin-2-yl)ethyl)-4-isopropoxyisoindoline-1,3-dione (18F-MNI-659) and their PDE10A selectivity against MP-10 (26). Here, we report about their first-in-human characterization, with the goal of developing a useful tool for striatal disease assessment and pharmaceutical development. To this end, test–retest and dosimetry studies were undertaken in healthy volunteers.
MATERIALS AND METHODS
Radiochemistry
18F-MNI-654 and 18F-MNI-659 were prepared by reaction of the corresponding tosylate precursor with 18F in the presence of potassium carbonate and Kryptofix-222 using a commercial synthesizer, TRACERlab FX-FN (GE Healthcare) (Fig. 1).
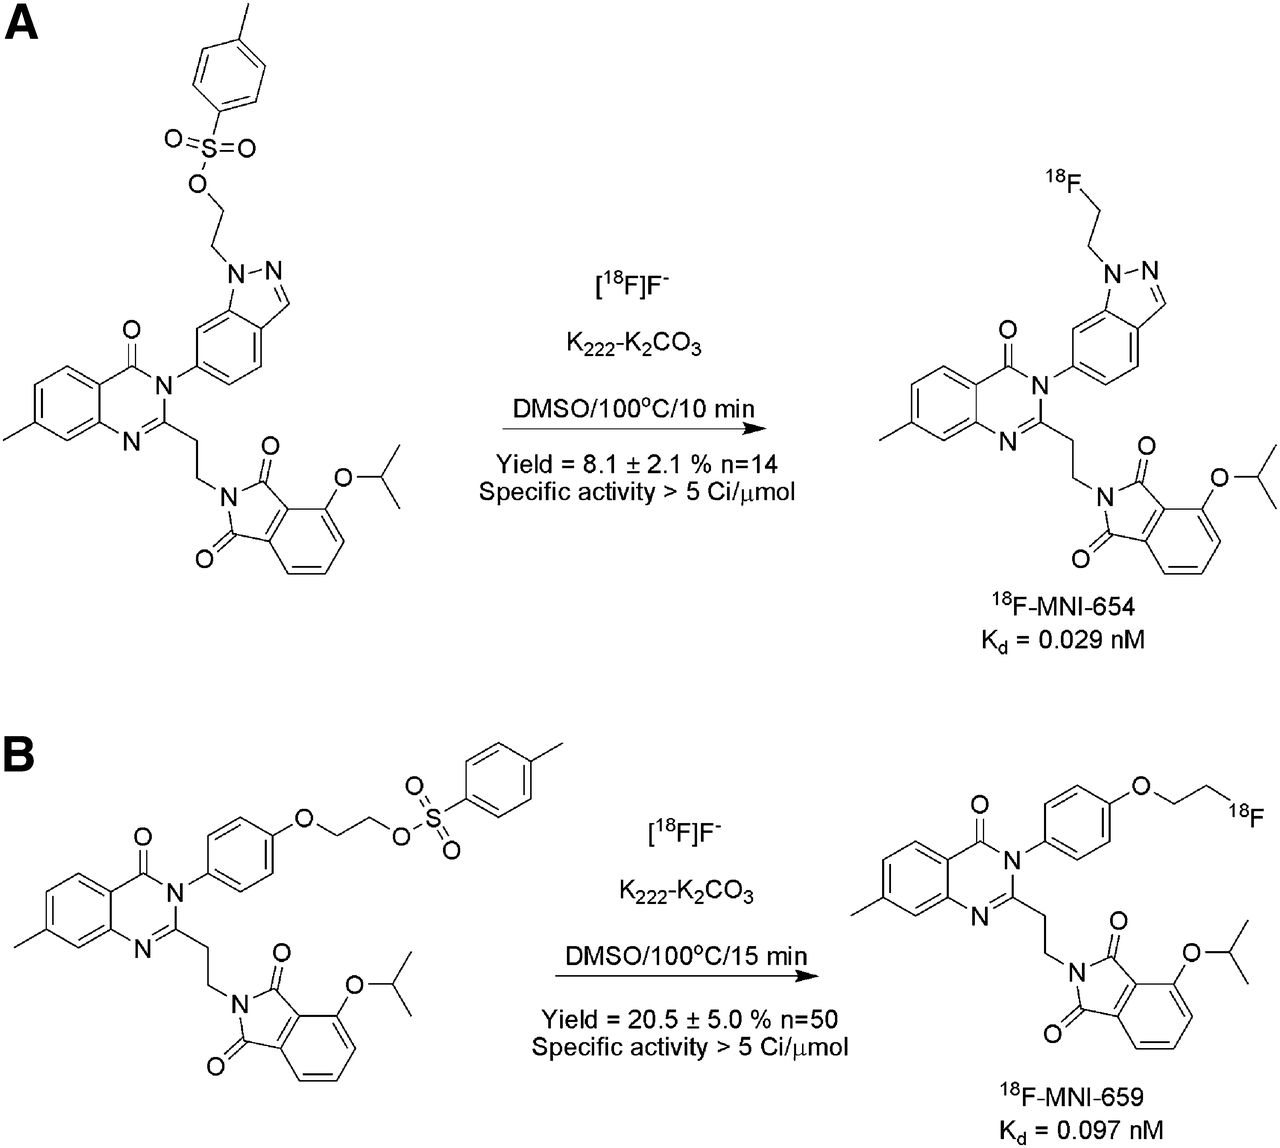
Radiosynthesis of 18F-MNI-654 (A) and 18F-MNI-659 (B) from their tosylate precursors. Specific activity = 185 GBq/μmol (5 Ci/μmol). DMSO = dimethyl sulfoxide.
The resulting radiolabeled product was purified using a semipreparative high-performance liquid chromatography (HPLC) column (Eclipse XDB-C18, 5 μm, 250 × 9.4 mm; Agilent) eluted with an acetonitrile/water solution (18F-MNI659: 65/35; 18F-MNI654: 40/60 [v/v]) at a flow rate of 4 mL/min and formulated in a physiologic solution (saline/ascorbic acid/polysorbate-80). For each radioligand, quality control showed a radiochemical purity above 99% and a specific activity exceeding 185 GBq/μmol (5 Ci/μmol) for all the productions. The average radiochemical yield was 8.1% ± 2.1% (n = 14) for 18F-MNI-654 and 20.5% ± 5.0% (n = 50) for 18F-MNI-659.
Pharmacologic Characterization
A PDE10A saturation binding assay was performed for each radioligand on homogenized striata from 4 frozen male rat brains (Sprague–Dawley; Bioreclamation, Inc.) that were thawed in lysis buffer (21). After dissection, the striata were homogenized in 6 mL of lysis buffer (50 mM Tris-HCl, pH 7.5, 1.2 mM MgCl2, 0.1 mM dithiothreitol, 10% sucrose, 1× Roche complete protease inhibitor) with a Polytron homogenizer at 0°C. Cell membranes were separated by centrifugation at 10,000g for 20 min at 4°C. Two milliliters of the supernatant containing PDE10A extract were diluted in 30 mL of assay buffer (50 mM Tris-HCl, pH 7.5, 5 mM MgCl2, 1× Roche complete protease inhibitor), and 250 μL of this solution were put in each assay tube. Brain homogenates were incubated with various concentration of radiotracers (from 0.002 to 3 nM) for 1 h at room temperature before filtration using a cell harvester and rinsed 3 times with 1 mL of assay buffer. Filters were measured in a well counter (Wallac 2480; Perkin-Elmer) and decay-corrected to generate the dose–response curve. Nonspecific binding was assessed using the same experiment but replacing the assay buffer with a solution of 10 μmol of MP-10 in assay buffer. Dissociation constants (Kd) were estimated by nonlinear regression using GraphPad Prism 5 (GraphPad Inc.) to be 0.029 and 0.097 nM for MNI-654 and MNI-659, respectively.
Human Subjects
The study protocol was reviewed and approved by the New England Institutional Review Board). Eleven healthy volunteers participated in this study (18F-MNI-654 test–retest: 2 men, aged 50 and 53 y; 18F-MNI-659 test–retest: 4 men and 1 woman, aged 36 ± 7 y; 18F-MNI-659 dosimetry: 2 men and 2 women, aged 42 ± 5 y). All participating subjects provided written informed consent and underwent screening evaluation by a research physician including baseline clinical laboratory testing, a physical and neurologic evaluation, and cognitive assessment.
Brain PET Studies
Image Acquisition and Reconstruction
Three-dimensional brain PET images were acquired on a Siemens ECAT EXACT HR+ camera. Healthy control subjects were administered a single dose of 18F-MNI-654 (171.3 ± 23.3 MBq [range, 136.9–187.2 MBq]; 0.67 ± 0.38 μg [range, 0.34–1.13 μg]) or 18F-MNI-659 (182.7 ± 8.5 MBq [range, 163.5–195.0 MBq]; 1.08 ± 0.90 μg [range, 0.42–2.97 μg]) as a slow intravenous injection over 3 min, followed by a 10-mL saline flush. Images were acquired over 5.5 h for 18F-MNI-654 as 3 sessions of 90 min. For 18F-MNI-659, subjects were imaged over 3.5 h as 2 sessions, with a first session of 90 min (first 2 subjects) or 120 min (last 3 subjects). The frames were of increasing duration from 30 s to 5 min. All subjects were allowed 30 min of rest outside the camera between each imaging session. A transmission scan was obtained before each emission scan with an external 68Ge rod source. Dynamic PET data were corrected for decay, attenuation, scatter, randoms, and dead time, and images were reconstructed using filtered backprojection with a gaussian filter (5 mm in full width at half maximum).
MR Imaging
A structural 3-dimensional T1-weighted MR image was acquired for all subjects on a GE Signa Excite 1.5-T scanner (fast spoiled gradient echo; repetition time, 8.3 ms; echo time, 4.0 ms; flip angle, 15°) or on a Siemens Symphony 1.5-T scanner (magnetization-prepared rapid acquisition with gradient echo; repetition time, 2.0 s; echo time, 3.9 ms; flip angle, 15°).
Input Function Measurement
Blood samples were collected from the radial artery every 45 s until 6 min and then at 8, 10, 15, 20, 25, 30, 45, 60, 90, 120, 150, 180, and 210 min for 18F-MNI-659 and up to 330 min for 18F-MNI-654. Radioactivity in whole blood and plasma was measured for all samples in a γ counter (Wallac 2480 Wizard; Perkin-Elmer), and in a subset radiometabolites were measured by reversed-phase HPLC on a Waters Nova-Pak C18 (4.6 × 250 mm) at a flow rate of 1 mL/min. The mobile phase consisted of a mixture of methanol/water with 0.8% of triethylamine in an 80/20 ratio. Plasma samples were processed either by acetonitrile denaturation (samples up to 60 min) or by liquid–liquid extraction with diethyl ether (after 60 min). The plasma protein binding free fraction (fp) was measured by ultrafiltration (Centrifree; Millipore).
Image Processing
Images were analyzed in PMOD 3.3 (PMOD Technologies). Images were frame-to-frame motion-corrected, realigned between sessions, merged, decay-corrected between sessions, and cross-calibrated with the well counter used for blood measurements. The initial PET images (15 min) were averaged and aligned onto the individual structural T1-weighted MR images. Both the MR imaging and the whole dynamic PET series were subsequently spatially normalized to the standard MNI (Montreal Neurologic Institute) space where a volume-of-interest template (comprising in particular the caudate, putamen, globus pallidus, cortical regions, thalamus, midbrain, brain stem, and cerebellum) was applied to extract the regional time–activity curves.
Kinetic Modeling
Time–activity curves were analyzed using standard 1-tissue- and 2-tissue-compartment models (1TCM and 2TCM) (27) as well as Logan graphical analysis (28) using the arterial plasma input function corrected for radiometabolites to derive the volume of distribution in each region. 1TCM and 2TCM assumed a whole-blood brain volume of 5%. Two different binding potentials were estimated using the cerebellar cortex as a reference region: nondisplaceable binding potential (BPND) = VT/VND – 1 and plasma binding potential (BPP) = VT − VND, VT and VND being the distribution volumes in the target and reference region, respectively (29).
The cerebellum has small levels of PDE10A in humans (6) and was shown to be a suitable reference region in baboons with 11C-MP-10 (19). The free fraction fp is low, and the measurements have a high variability. Therefore, BPF was not calculated, and fp was not used to calculate VND and VT.
In addition to the plasma input models, the simplified reference tissue model (SRTM) (30) with the cerebellar cortex as a reference region was investigated to derive directly BPND. All kinetic analyses were performed using PMOD where 1TCM, 2TCM, and SRTM were estimated with a Levenberg–Marquardt optimizer.
Statistical Analysis
The goodness of fit was evaluated using the Akaike information criterion (AIC) (31) and model selection criterion (MSC) (32), where smaller AIC or larger MSC indicates a more appropriate model. SE (%SE) was estimated from the covariance matrix diagonal elements and used to assess the parameter identifiability (33). Group data were expressed as mean ± SD. Test–retest reproducibility was assessed by the variability as ABS(test − retest)/AVERAGE(test + retest), and reliability was assessed by the intraclass correlation coefficient (ICC), where an ICC of −1 denotes no reliability and +1 denotes maximum reliability.
18F-MNI-659 Whole-Body Dosimetry Studies
Whole-body PET imaging studies were performed on a Siemens HR+ PET camera to determine 18F-MNI-659 biodistribution and estimate radiation-absorbed doses. Four healthy controls (2 men, 2 women) received a bolus intravenous administration of 18F-MNI-659 (180.8 ± 2.9 MBq [range, 176.6–182.8 MBq]; 0.87 ± 0.17 μg (range, 0.76–1.12 μg]), immediately followed by a series of whole-body PET images consisting of 9 bed positions. Images were acquired over approximately 6 h in 3 scanning sessions, with subjects being allowed out of the camera for 30 min between sessions. The first session included 5 whole-body passes (2 × 60 s per bed position and 3 × 120 s per bed position), and the last 2 sessions included 2 whole-body passes each (2 × 270 s per bed position). A transmission scan was acquired before each imaging session with an external 68Ge rod source. Urine was collected up to 8 h after radiotracer injection. PET data were corrected for attenuation, scatter, randoms, and dead time, and images were reconstructed using ordered-subset expectation maximization (4 iterations, 16 subsets). Source organs were identified, and non–decay-corrected time–activity curves were generated (expressed as percentage injected dose). Radiation-absorbed dose and effective dose (weighted average using ICRP-60 tissue-weighting factors (34)) were estimated with the OLINDA/EXM 1.0 software package. ICRP-30 (35) gastrointestinal tract kinetics were used with the assumption that activity entered the bowel through the hepatobiliary system; an intestinal decay-corrected time–activity curve was used for estimation of the fraction of activity entering the intestine. The adult male and female models, adjusted to each individual body mass, were assumed for the male and female subjects, respectively.
RESULTS
Plasma Analysis
HPLC analysis of arterial plasma showed that 18F-MNI-654 and 18F-MNI-659 were moderately metabolized with a similar profile, with about 20% of intact parent remaining at 120 min after injection for both (Fig. 2). fp was measured by ultrafiltration as 0.5%–1.3% (n = 4) for 18F-MNI-654 and 0.1%–0.7% (n = 10) for 18F-MNI-659 but was not used to calculate the distribution volumes. For both 18F-MNI-654 and 18F-MNI-659, radiometabolites were more polar than the parent compounds and are therefore not expected to penetrate the blood–brain barrier.
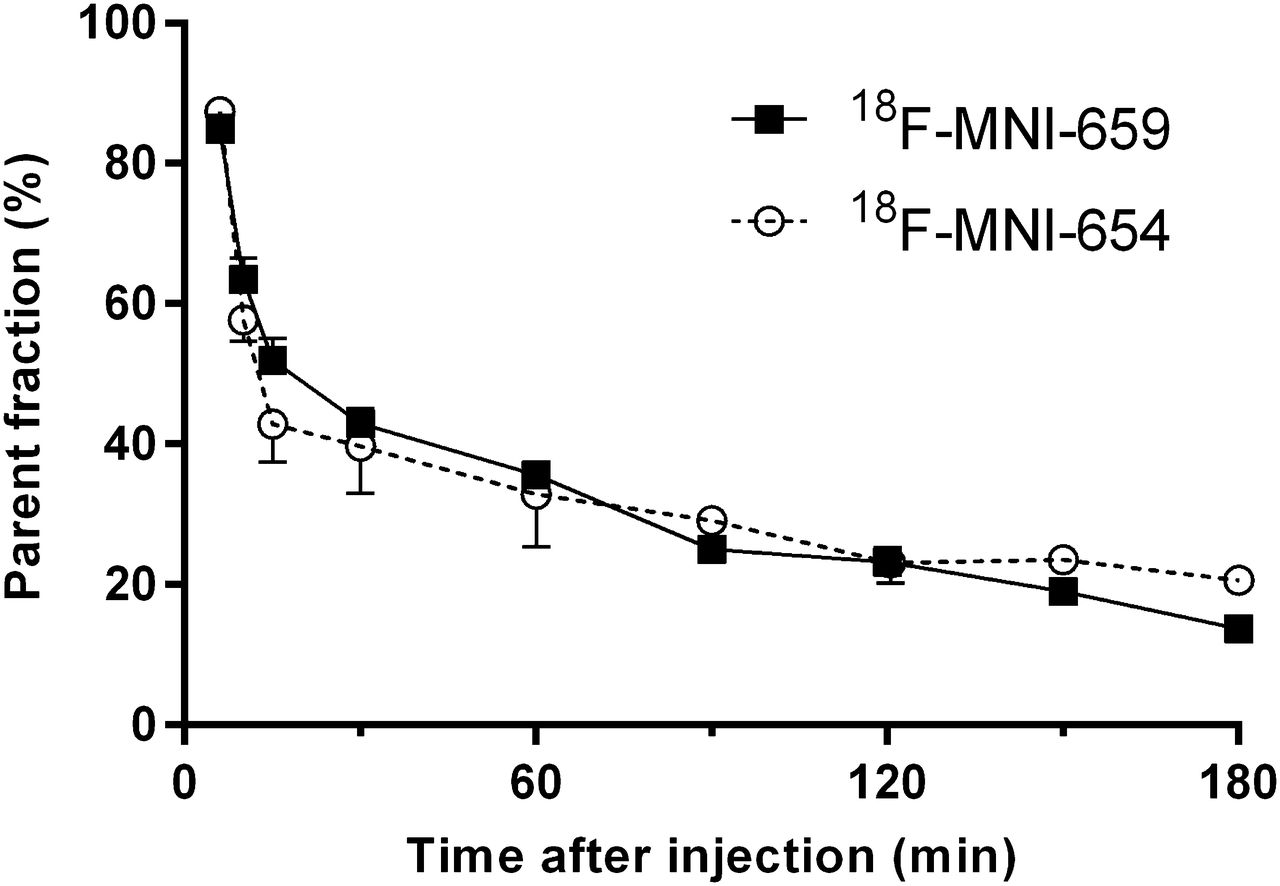
Average parent fraction profile in plasma after intravenous administration of 18F-MNI-654 (n = 4) and 18F-MNI-659 (n = 10). Error bars represent SD.
Brain Distribution and Kinetics
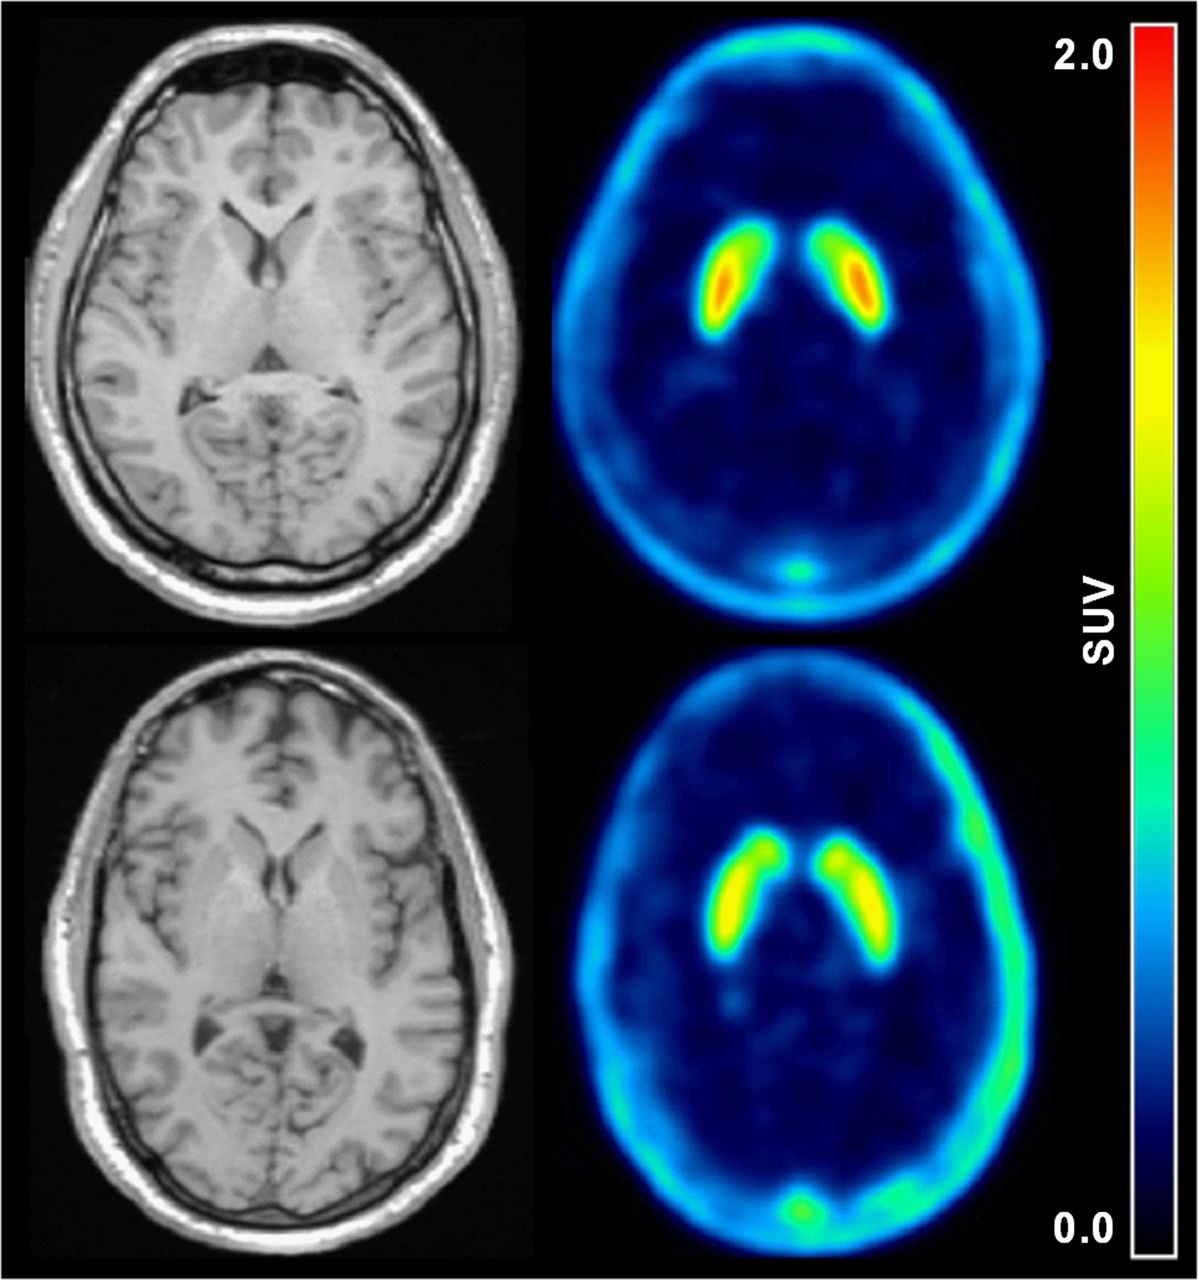
Representative average PET images from 30 to 90 min of acquisition of 18F-MNI-654 and 18F-MNI-659 show high uptake in the caudate, putamen, and globus pallidus, regions rich in PDE10A (Fig. 3). Representative time–activity curves of selected regions are presented in Figure 4. 18F-MNI-654 and 18F-MNI-659 readily entered the human brain, with a peak uptake of 0.7–1.0 standardized uptake value around 60–80 min after injection for 18F-MNI-654 and of 1.5–2.5 standardized uptake value around 10–20 min after injection for 18F-MNI-659 in the caudate, putamen, and globus pallidus and a much faster washout in all other brain regions, in particular in the cerebellum (peak uptake within 5 min of injection), consistent with the much lower PDE10A density in these regions (6). 18F-MNI-659 displayed much faster kinetics than 18F-MNI-654, with a significant washout over 3.5 h.

Transverse MR and average PET images (30–90 min) for 18F-MNI-659 (top) and 18F-MNI-654 (bottom) for 2 healthy subjects. SUV = standardized uptake value.

(A) 18F-MNI-659 time–activity curves in caudate, putamen, globus pallidus, and cerebellum showing 1TCM (dashed line) and 2TCM fits (solid line). (B) 18F-MNI-654 time–activity curves in caudate, putamen, globus pallidus, and cerebellum showing 1TCM (dashed line) and 2TCM fits (solid line). (C) 18F-MNI-659 time–activity curves in caudate, putamen, and globus pallidus showing SRTM fits (dashed line). (D) 18F-MNI-659 Logan plots in caudate, putamen, globus pallidus, and cerebellum showing linear regression (dashed line). ○ = caudate; □ = putamen; △ = globus pallidus; ● = cerebellum. Cp = plasma activity concentration; Ct = tissue activity concentration; SUV = standardized uptake value.
18F-MNI-654 Kinetic Modeling
2TCM provided better fits of 18F-MNI-654 data than 1TCM based on AIC and MSC (Fig. 4), in particular in the cerebellum where 1TCM did not properly describe the late part of the time–activity curve. The Logan plot (t* = 30 min) provided VT estimates in good agreement with 2TCM (r2 > 0.96) although lower by about 10%. SRTM failed to describe accurately the initial part of the curves but described appropriately the washout phase at later time points. Logan and SRTM BPND correlated well with 2TCM estimates (r2 > 0.96) but were lower by about 10%–20% and 30%–40%, respectively. 2TCM VT and BPND in the striatum were estimated to be 4.5 ± 0.8 and 7.0 ± 1.5, respectively. Test–retest variability was poor (20% for VT, 30%–40% for BPND), and reducing the acquisition duration below 3 h led to convergence issues in some regions, in particular the globus pallidus. Because of the poor imaging characteristics of this compound, no further analysis was done with 18F-MNI-654, and results in the remainder of this report refer only to 18F-MNI-659.
18F-MNI-659 Kinetic Modeling
2TCM is again the preferred configuration for 18F-MNI-659 data, compared with 1TCM, with smaller AIC and higher MSC in all regions where 1TCM fits undershot the late part of the time–activity curves, particularly for the cerebellum. Typical 1TCM, 2TCM, and SRTM fits and Logan plots (t* = 30 min) are provided in Figure 4. SRTM did not fit perfectly the data, in particular the late part of the curves, but the fits improved for shorter acquisitions. A summary of the modeling parameters for 90 and 210 min of data is given in Supplemental Table 1 (supplemental materials are available at http://jnm.snmjournals.org) for all 4 methods. Overall, VT had a low error around 2% in the high-uptake regions for both 2TCM and 1TCM, which slightly increased when using 90 min of data, in particular in the globus pallidus. The error was larger in the cerebellum, in particular for 2TCM (13.3% ± 7.5% for 210 min reduced to 7.8% ± 7.4% for 90 min of data). K1 also had a low error around 2%–3% for the high-uptake regions, slightly worse in the cerebellum (5%–6%). The intersubject VT variability was around 30% for all brain regions investigated for 2TCM, 1TCM, and Logan. A similar intersubject variability of 30% was measured for K1 in all regions for both 2TCM and 1TCM.
Model Comparison
Correlations of VT, BPP, and BPND obtained with 2TCM, 1TCM, Logan, or SRTM were done using 90-min estimates (Supplemental Fig. 1 for correlations of 210-min estimates). For VT, 2TCM and 1TCM correlated well with Logan, close to the line of identity, with an r2 greater than 0.99 and a slope close to 1.0 (Fig. 5). Regions with low VT (cerebellum) were, however, underestimated for 1TCM, compared with Logan (−35%). For BPP, there was again a good agreement of 2TCM and 1TCM versus Logan, with an r2 greater than 0.99 and a slope close to 1.0. 2TCM overestimated BPP by 10%, compared with Logan. For BPND, SRTM correlated well with Logan, with an r2 greater than 0.98 and an overestimation of less than 10%. 2TCM overestimated BPND by 20%–30%, and 1TCM clearly overestimated BPND, compared with Logan (60%–70%), due to the lower 1TCM VT estimate in the cerebellum.

(A) Correlation of 18F-MNI-659 2TCM and 1TCM 90-min VT estimates against Logan VT estimates (all regions). (B) Correlation of 18F-MNI-659 2TCM and 1TCM 90-min BPP estimates against Logan BPP estimates (caudate, putamen, and globus pallidus). (C) Correlation of 18F-MNI-659 2TCM, 1TCM, and SRTM 90-min BPND estimates against Logan BPND estimates (caudate, putamen and globus pallidus). ● = 2TCM; □ = 1TCM; cross = SRTM; solid line = linear regression fit; dashed line = line of identity.
Test–Retest
Results for VT, BPp, and BPND are summarized in Table 1, 2, and 3 for 90 min of data (Supplemental Tables 2, 3, and 4 for acquisitions of 210 min). BPND shows test–retest of around 10%–20% for 2TCM and below 10% for all other methods. Both VT and BPP showed moderate reproducibility around 30%. ICC of BPND was good, above 0.8 for all methods except 1TCM (0.4–0.8 for 90 min). For VT, the ICC was around 0.4–0.6 for 2TCM, 1TCM, and Logan in all regions, and for BPP, the ICC was slightly better around 0.5–0.7. The average of the estimates for the retest studies were all within 10% of the test studies.
18F-MNI-659 VT Test–Retest for 2TCM, 1TCM, and Logan for 90-Minute Acquisitions
18F-MNI-659 BPP Test–Retest for 2TCM, 1TCM, and Logan for 90-Minute Acquisitions
18F-MNI-659 BPND Test–Retest for 2TCM, 1TCM, Logan, and SRTM for 90-Minute Acquisitions
18F-MNI-659 Whole-Body Dosimetry
18F-MNI-659 whole-body distribution over time is shown in Figure 6. The 7 organs identified as source organs for the radiation dosimetry calculation were the brain, heart, liver, gallbladder, urinary bladder, kidneys, and intestines. The elimination of the radiotracer was primarily via the hepatobiliary route, with the gallbladder wall having the highest organ dose. The radioactivity present in urine was determined to be less than 10% of the injected dose. The average absorbed organ doses and effective dose across the 4 subjects are given in Table 4. The average effective dose was estimated to be 0.024 ± 0.007 mSv/MBq. This radiation exposure was similar to other 18F-labeled tracers (18F-FDG is 0.019 mSv/MBq) and would allow several scans to be obtained in the same subject per year with a 180-MBq injected dose.

Coronal PET images showing temporal distribution over 6 h of 18F-MNI-659. Same color scale is used but with different maximum activity (given above images) to better visualize relative distribution. Amax = maximum activity concentration.
Mean Radiation-Absorbed Dose as Well as Effective Dose (mSv/MBq)
DISCUSSION
The primary aim of this study was to evaluate 2 potential PET radioligands for in vivo imaging of the PDE10A enzyme in the human brain. 18F-MNI-654 and 18F-MNI-659 readily enter the brain, with an uptake distribution in agreement with the known distribution of PDE10A in the human brain (caudate ∼ putamen ∼ globus pallidus >> cortex, cerebellum). 18F-MNI-654 and 18F-MNI-659 also had a similar parent fraction profile over time. However, 18F-MNI-654 kinetics proved to be too slow, requiring long acquisitions of at least 180 min for robust estimates, with a poor reproducibility for both VT and BPND.
18F-MNI-659–measured plasma-free fraction was low (∼1%), and liquid–liquid extraction was used to improve the counting statistics of the HPLC samples beyond 60 min although acetonitrile denaturation led to sufficient counts up to 90 min. In addition, VT intrasubject variability was similar to VT and K1 intersubject variability, all around 30%, suggesting that the observed VT variability is probably mainly driven by measurement errors of the parent plasma input function. This finding is further supported by a BPND test–retest, which is below approximately 10%.
Although 2TCM was the favored model, 2TCM and 1TCM gave VT estimates within 10% in the PDE10A-rich regions. However, in the cerebellum, 2TCM was clearly favored and gave estimates higher by 25% and 50% for scans of 90 and 210 min, compared with 1TCM, respectively. On the other hand, 1TCM although biased was the most robust method against the scan duration, with variability and ICC similar to 2TCM and Logan for VT and good results for BPP and BPND as well.
In the cerebellum and the other low-uptake regions (cortex, thalamus), 2TCM gave a small k4 rate constant (29). However, reversible 2TCM was still favored against an irreversible model based on AIC and MSC (data not shown), with in any case a clear reversibility of the tracer in the basal ganglia. The need of 2 compartments to describe the kinetics in a reference region is usually due to low specific binding (although in humans, PDE10A levels in the cerebellum are small (6)), heterogeneity (gray and white matter), or a slow transfer rate between free and nonspecifically bound tracer. Investigation of higher-order compartment models showed that a third compartment (reversible or irreversible) improved the AIC and MSC (though marginally), and spectral analysis (36) revealed a slow component. The nature of this slow component is unclear at this stage but could explain, at least partly, the difficulties in fitting the data in the low-uptake regions with 2TCM.
For BPND, SRTM gave the best results, with variability less than 10% and ICC greater than 0.9. Variability was moderate (∼30%) for VT and BPP for all methods investigated. There was good agreement between Logan and SRTM, giving more confidence that noninvasive modeling with SRTM is appropriate to derive BPND despite the discrepancy observed for 1TCM and 2TCM due to their difficulties in describing the uptake in the cerebellum. In addition, SRTM BPND estimates were robust against the acquisition length, with values for 210 min of data within 8% of those derived with 90 min of data.
Further work is needed to fully validate the use of the cerebellum as a reference region for quantification of the PDE10A signal with 18F-MNI-659 in the human brain or at least estimate the bias or level of specific binding in that region, compared with the nonspecific and free signal (37–39). Moreover, it would be useful to further assess the bias due to SRTM assumption violation and sensitivity due to changes in the cerebral blood flow using a simulated dataset (37,40).
CONCLUSION
We reported here the PET imaging of PDE10A in the human brain with 2 novel 18F tracers. 18F-MNI-654 kinetics were slow, and long acquisitions would be necessary with this radiotracer. Noninvasive quantification of 18F-MNI-659 with SRTM using the cerebellum as a reference is possible, and SRTM BPND estimates with 18F-MNI-659 proved to be robust. In addition, 18F-MNI-659 kinetics are fast enough for a good estimate of BPND with 90-min acquisitions, with values around 3.0 in the basal ganglia. Finally, 18F-MNI-659 dosimetry is favorable with an effective dose estimated around 0.024 mSv/MBq, consistent with values reported for other PET radiotracers currently used in humans.
DISCLOSURE
The costs of publication of this article were defrayed in part by the payment of page charges. Therefore, and solely to indicate this fact, this article is hereby marked “advertisement” in accordance with 18 USC section 1734. No potential conflict of interest relevant to this article was reported.
Footnotes
Published online Jun. 2, 2014.
- © 2014 by the Society of Nuclear Medicine and Molecular Imaging, Inc.
REFERENCES
- Received for publication March 17, 2014.
- Accepted for publication March 27, 2014.


Jump to section
Related Articles
Cited By...
- Longitudinal Small-Animal PET Imaging of the zQ175 Mouse Model of Huntington Disease Shows In Vivo Changes of Molecular Targets in the Striatum and Cerebral Cortex
- A novel thermoregulatory role for PDE10A in mouse and human adipocytes
- Change in PDE10 across early Huntington disease assessed by [18F]MNI-659 and PET imaging
- AMG 580: A Novel Small Molecule Phosphodiesterase 10A (PDE10A) Positron Emission Tomography Tracer