


Abstract
We report the development of a PET tracer for α2C adrenoceptor imaging and its preliminary preclinical evaluation. α2C adrenoceptors in the human brain may be involved in various neuropsychiatric disorders, such as depression, schizophrenia, and neurodegenerative diseases. PET tracers are needed for imaging of this receptor system in vivo. Methods: High-specific-activity 11C-ORM-13070 (1-[(S)-1-(2,3-dihydrobenzo[1,4]dioxin-2-yl)methyl]-4-(3-11C-methoxymethylpyridin-2-yl)-piperazine) was synthesized by 11C-methylation of O-desmethyl-ORM-13070 with 11C-methyl triflate, which was prepared from cyclotron-produced 11C-methane via 11C-methyl iodide. Rats and mice were investigated in vivo with PET and ex vivo with autoradiography. The specificity of 11C-ORM-13070 binding to α2 adrenoceptors was demonstrated in rats pretreated with atipamezole, an α2 adrenoceptor antagonist. The α2C adrenoceptor selectivity of the tracer was determined by comparing tracer binding in wild-type and α2A- and α2AC adrenoceptor knockout (KO) mice. 11C-ORM-13070 and its radioactive metabolites in rat plasma and brain tissue were analyzed with radio–high-performance liquid chromatography and mass spectroscopy. Human radiation dose estimates were extrapolated from rat biodistribution data. Results: The radiochemical yield, calculated from initial cyclotron-produced 11C-methane, was 9.6% ± 2.7% (decay-corrected to end of bombardment). The specific activity of the product was 640 ± 390 GBq/μmol (decay-corrected to end of synthesis). The radiochemical purity exceeded 99% in all syntheses. The highest levels of tracer binding were observed in the striatum and olfactory tubercle of rats and control and α2A KO mice—that is, in the brain regions known to contain the highest densities of α2C adrenoceptors. In rats pretreated with atipamezole and in α2AC KO mice, 11C tracer binding in the striatum and olfactory tubercle was low, similar to that of the frontal cortex and thalamus, regions with low densities of α2C adrenoceptors. Two radioactive metabolites were found in rat plasma, but only one of them was found in the brain; their identity was not revealed. The estimated effective radiation dose was comparable with the average exposure level in PET studies with 11C tracers. Conclusion: An efficient method for the radiosynthesis of 11C-ORM-13070 was developed. 11C-ORM-13070 emerged as a potential novel radiotracer for in vivo imaging of brain α2C adrenoceptors.
The α2 adrenoceptor subtypes α2A, α2B, and α2C mediate many of the physiologic effects of noradrenaline and adrenaline. The α2C adrenoceptor subtype is a potential drug target for the treatment of neuropsychiatric disorders, such as depression, schizophrenia, and dementia (1,2).
In the rodent brain, the highest densities of α2C adrenoceptors are found in the striatum and olfactory tubercle (3,4). The striatum also contains the highest density of α2C adrenoceptors in postmortem human brain (5).
Several radioligands have been evaluated for PET imaging of brain α2 adrenoceptors, such as 11C-MK-912 (6), [O-methyl-11C]RS-15385-197 (7), 11C-mirtazapine (8), 11C-R107474 (9), and 11C-yohimbine (10), but they do not differentiate between the α2 adrenoceptor subtypes. Two recently developed PET tracer candidates, 11C-MBF and 11C-JP-1302, are selective for the α2C adrenoceptor subtype, but they do not readily enter the brain (11).
In this study, a novel PET tracer for α2C adrenoceptor imaging was developed and evaluated in rats and in wild-type (WT) and α2A and α2AC adrenoceptor knockout (KO) mice. We report here the radiosynthesis of 11C-ORM-13070 (1-[(S)-1-(2,3-dihydrobenzo[1,4]dioxin-2-yl)methyl]-4-(3-11C-methoxymethylpyridin-2-yl)-piperazine) with high specific activity (SA). The receptor specificity of 11C-ORM-13070 binding was assessed ex vivo in rats using pretreatment with atipamezole (Antisedan; Orion Pharma), a subtype-nonselective antagonist of α2 adrenoceptors. Selectivity for the α2C adrenoceptor subtype was demonstrated by the use of WT control mice and mice devoid of α2A adrenoceptors and mice lacking both α2A and α2C adrenoceptors (α2A KO and α2AC KO mice).
The fraction of unmetabolized 11C-ORM-13070 was determined in samples of rat plasma and brain using radiochromatography. The biodistribution of radioactivity after 11C-ORM-13070 injection was investigated in the brain and peripheral organs of rats in vivo with PET/CT and ex vivo using both autoradiography and radioactivity counting. A radiation dose for humans was extrapolated from rat biodistribution data.
MATERIALS AND METHODS
Production of 11C-Methane
11C was prepared by the 14N(p,α)11C nuclear reaction using 17-MeV protons, which were produced with an MGC-20 cyclotron (Efremov Institute), and was obtained as 11C-methane. The target gas was nitrogen, containing 5% hydrogen (AGA).
Radiosynthesis of 11C-ORM-13070
The desmethyl precursor (2-{4-[(S)-1-(2,3-dihydrobenzo[1,4]dioxin-2-yl)methyl]piperazin-1-yl}-pyridin-3-yl)-methanol (ORM-13333), the reference compound (ORM-13070), and atipamezole were provided by Orion Pharma. All other reagents were purchased from commercial suppliers and were used without further purification.
11C-ORM-13070 (2) was synthesized by 11C-methylation of its precursor, O-desmethyl ORM-13070 (ORM-13333) (1), with 11C-methyl triflate (Fig. 1), which was prepared from cyclotron-produced 11C-methane via 11C-methyl iodide. 11C-methyl iodide was synthesized from 11C-methane and iodine in a gas phase reaction at 720°C (12). 11C-methyl triflate was prepared online from 11C-methyl iodide by passing 11C-methyl iodide through a silver triflate/graphitized carbon column, using argon gas as a carrier at 200°C (13).
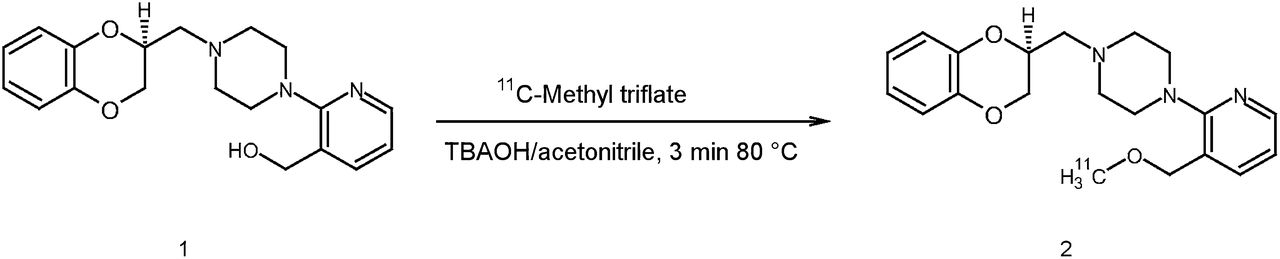
The desmethyl precursor (1.0 mg, 3.0 μmol) was dissolved in acetonitrile (200 μL) in a 1-mL reaction vial sealed with a septum and a screw-cap (Reacti-Vial; Pierce). Freshly prepared tetrabutyl ammonium hydroxide (3.0 μL, 1.0 M) was added to the reaction solution. The 11C-methyl triflate was transferred to the solution (at 0°C) in a stream of argon gas (15 mL/min). The reaction mixture was heated in an 80°C oil bath for 3 min. 11C-ORM-13070 was purified by high-performance liquid chromatography (HPLC) on a semipreparative size column, using the system described in the supplemental data (supplemental materials are available at http://jnm.snmjournals.org). After removal of the mobile phase by vacuum rotary evaporation, the 11C-ORM-13070 batches used for preclinical experiments were formulated in propylene glycol/ethanol/0.1 M phosphate buffer (10/5/85, v/v/v; volume, 3.5 mL) and passed through a sterile Acrodisc Syringe Filter with HT Tuffryn Membrane (0.2 μm, 25 mm; Pall Corp.) into the sterile end-product vial for injection. The analytic HPLC system is described in the supplemental data.
Animals
Male Sprague–Dawley (originally from Harlan), locally outbred rats (n = 34), weighing 292 ± 31 g, and male α2A KO (n = 6), α2AC KO (n = 5), and C57Black WT mice (n = 6), weighing 33 ± 3 g, were used in this study. α2A KO and α2AC KO mice were originally a gift from Dr. Brian K. Kobilka, Stanford University (14) and were bred locally; WT control mice were obtained from the Jackson Laboratory. The animals were housed at the Central Animal Laboratory of the University of Turku under standard conditions (temperature, 21°C; humidity, 55% ± 5%; lights on from 6:00 am to 6:00 pm), with free access to standard food and tap water. Animal care complied with the guidelines of the International Council of Laboratory Animal Science. This study was approved by the Animal Experiment Board of the Province of Southern Finland.
In Vivo PET Imaging
PET imaging was performed using an Inveon Multimodality PET/CT scanner (Siemens Medical Solutions) designed for small laboratory animals. Isoflurane, 2% or 2.5%, in oxygen was used to anesthetize the rats or mice, respectively, for 30 min before radiotracer injection. The animals were kept warm with a heating pad and a bubble-wrap cover, and their eyes were protected with ophthalmic gel. CT transmission scans were obtained to correct for attenuation. Dynamic emission scans were acquired for 60 min in 3-dimensional list mode, with an energy window of 350–650 keV. Scans were started immediately after the intravenous bolus injection of 11C-ORM-13070. The injected dose for rats (n = 4) was 48 ± 13 MBq, and the injected mass was 0.2 ± 0.1 nmol/kg (range, 0.1–0.3 nmol/kg). The injected dose for mice (n = 6) was 10.7 ± 1.6 MBq, and the injected mass was 6.8 ± 15.1 nmol/kg (range, 0.4–37.7 nmol/kg), as calculated from the SA at the time of injection.
List-mode data were stored into 3-dimensional sinograms, which were then Fourier-rebinned into 2-dimensional sinograms (51 frames; 30 × 10, 15 × 60, 4 × 300, and 2 × 600 s). Images were reconstructed using 2-dimensional filtered backprojection with a 0.5-mm ramp filter.
To analyze the PET images, volumes of interest were drawn on the striatum and cerebellar cortex with Inveon Research Workplace Image Analysis software (Siemens Medical Solutions). CT images were used as anatomic reference. From the volumes of interest, time–radioactivity curves were obtained for the striatum and cerebellar cortex. Striatum–to–cerebellar cortex radioactivity ratios were then calculated at 5–15 min after injection.
Ex Vivo Autoradiography
Ex vivo autoradiography imaging of brain cryosections was performed at 10 min (n = 6) and 30 min (n = 10) after injection of 11C-ORM-13070 in rats and at 1 time point (10 min after injection; n = 11) in mice. The injected dose for rats was 60 ± 17 MBq, and the injected mass was 2.7 ± 2.0 nmol/kg (range, 0.3–6.9 nmol/kg). The injected dose for mice was 7.4 ± 2.3 MBq, and the injected mass was 6.2 ± 12.4 nmol/kg (range, 0.5–31.4 nmol/kg), as calculated from the SA at the time of injection.
Brains were dissected, weighed, measured for 11C radioactivity, and immediately frozen with isopentane, which was chilled with dry ice. Coronal cryosections (40 μm) were prepared on microscope slides, air dried, and apposed to an imaging plate (Imaging Plate BAS-TR2025; Fuji Photo Film Co.) for approximately 1 h. The imaging plates were scanned with a Fuji BAS-5000 Analyzer.
Digital autoradiographic images were analyzed for count densities (photostimulated luminescence per unit area, PSL/mm2) using the Aida 2.14 program (Raytest Isotopenmessgeräte GmbH). Regions of interest were drawn over the frontal cortex, olfactory tubercle, striatum, thalamus, and cerebellar cortex (15). At least 5 sections were analyzed for each brain region of each animal, and background count densities were subtracted from the region-of-interest counts. For each animal, the uptake of 11C-ORM-13070–derived radioactivity in the brain was evaluated as PSL/mm2. Region–to–cerebellar cortex radioactivity ratios were calculated. The cerebellar cortex was used as a reference tissue because of its known low, negligible density of α2C adrenoceptors (4).
The pharmacologic specificity of 11C-ORM-13070 binding in rats was estimated from the decrease in binding after the subcutaneous administration of a dose of atipamezole (1 mg/kg), a subtype-nonselective antagonist of α2 adrenoceptors. Atipamezole was dissolved in a 0.9% NaCl solution and administered to the rats 40 min before 11C-ORM-13070. The rats were sacrificed 30 min after the tracer injection. The regional distribution of 11C radioactivity in the brains of these rats (n = 2) was determined using autoradiography, as described earlier.
Metabolite Analysis and Plasma Protein Binding
11C-ORM-13070 and its radioactive metabolites were analyzed in rat plasma, striatum, and cerebellar cortex using radio-HPLC with a semipreparative C18 column (supplemental data).
Attempts were also made at the Drug Metabolism Laboratory of Orion Pharma to identify the 2 radioactive metabolites formed from 11C-ORM-13070 (supplemental data).
Plasma proteins were precipitated with acetonitrile. The brain samples were homogenized in HPLC mobile phase, deproteinized with acetonitrile, and centrifuged. The supernatants were then injected into the HPLC system for analysis. Chromatograms were manually integrated, and the results were decay-corrected. The fractions of unmetabolized 11C-ORM-13070 and its radioactive metabolites of the total radioactivity present in the samples were analyzed using D-7000 HSM (HPLC System Manager) software (version 3.0; Merck-Hitachi).The protein binding of 11C radioactivity in plasma was determined by ultrafiltration (Microsep 30 kD; Pall Life Sciences). The fraction of protein-unbound radioactivity was expressed as the percentage of the total 11C radioactivity in plasma.
Biodistribution of 11C-ORM-13070 in Rats
11C-ORM-13070 was injected into the tail vein of rats (n = 15) under light isoflurane/oxygen anesthesia. The injected radioactivity was 38 ± 7 MBq, and the injected mass was 3.9 ± 5.6 nmol/kg (range, 0.6–15.6 nmol/kg), as calculated from the SA at the time of injection. Rats were sacrificed by CO2 inhalation at 2 min (n = 3), 5 min (n = 3), 10 min (n = 3), 20 min (n = 3), or 40 min (n = 3) after the injection of 11C-ORM-13070. Organs and tissues were immediately dissected, weighed, and measured for 11C radioactivity in a 2480 Wizard Gamma Counter (Wallac) or in a well counter (7.62 × 7.62 cm NaI (Tl) crystal; Bicron Inc.).
Dosimetry
Dose estimates for healthy human males (73 kg) were extrapolated from the rat biodistribution data, using the program OLINDA/EX 1.0 (16). On the basis of these extrapolated 11C radioactivity uptake values in human organs, the software was used to calculate the estimated effective organ doses (μSv/MBq).
Statistics
Descriptive statistics are presented by arithmetic means and SDs. Differences in region–to–cerebellar cortex uptake ratios between groups of mice (WT, α2A KO, α2AC KO) were tested separately for each brain region (striatum, olfactory tubercle, frontal cortex, thalamus), using 1-way ANOVA. In addition, pairwise comparisons of the groups against α2AC KO mice were performed with the Dunnett method. All tests were performed 2-sided, with a significance level set at 0.05. The analyses were performed using the SAS System (version 9.3 for Windows [Microsoft]; SAS Institute Inc.).
RESULTS
Synthesis of 11C-ORM-13070
11C-ORM-13070 (2) was synthesized by 11C-methylation of the desmethyl precursor (1) with 11C-methyl triflate (Fig. 1). The initial radioactivity of 11C-methane was approximately 37 GBq as determined by calibrated Geiger–Müller tubes in the synthesis apparatus, and the average synthesis time was 32 ± 3 min, including the synthesis of 11C-methyl triflate, methylation, HPLC purification, and formulation. The retention times of the precursor and 11C-ORM-13070 in HPLC purification were 3.9 and 7.2 min, respectively.
The radiochemical yield, calculated from the initial 11C-methane (decay-corrected to end of bombardment), was 9.6% ± 2.7%, and the radioactivity of 11C-ORM-13070 was 1,210 ± 360 MBq at end of synthesis. Measured by analytic HPLC, the SA was 640 ± 390 GBq/μmol (end of synthesis). The chemical purity of the final product, that is, the absence of unknown signals in the ultraviolet trace, was verified by analytic HPLC. The concentration of precursor in the final product was low, at 0.15 nmol/mL or less. The retention times of the precursor and 11C-ORM-13070 in analytic HPLC were 1.4 and 3.6 min, respectively.
The radiochemical purity of the product exceeded 99% in all syntheses (n = 118). The final product was radiochemically stable for up to 1 h, as verified by HPLC. Of the synthesized batches, 22 were used for preclinical evaluation.
In Vivo PET/CT
PET/CT imaging of the rat brain showed that the 11C radioactivity uptake in the striatum reached a maximum of 1.8 percentage injected dose per gram (%ID/g) in 1 min after injection. Thereafter, the striatal 11C radioactivity rapidly decreased to a level of about 0.2 %ID/g at 30 min. In the cerebellar cortex, the uptake and clearance of radioactivity were faster than in the striatum. The striatum–to–cerebellar cortex radioactivity ratio reached a maximum of 1.8 in about 10 min after injection, after which the ratio slowly declined to 1.4 at 30 min (Fig. 2).

(A) Summed maximum-intensity-projection PET/CT image shows 11C radioactivity biodistribution in Sprague–Dawley rat in vivo, for period 5–15 min after tracer injection. (B) Time–radioactivity curves obtained from inferior vena cava, striatum, and cerebellar cortex show rapid clearance of 11C-ORM-13070 from blood and rapid entry into brain. Cere = cerebellar cortex; Str = striatum.
PET/CT imaging of mice showed that the 11C radioactivity uptake in the brain was similar for WT and α2A KO mice and reached a maximum of 7.8–8.1 %ID/g in about 1 min and decreased to a level of 1.2 %ID/g at 30 min. The striatum–to–cerebellar cortex radioactivity ratios at 5–15 min for α2A KO (n = 2), α2AC KO (n = 2), and WT mice (n = 2) were 1.51–1.51, 1.06–1.09, and 1.51–1.57, respectively. In α2AC KO mice, the uptake in the striatum did not differ from the uptake in the cerebellar cortex (Fig. 3).
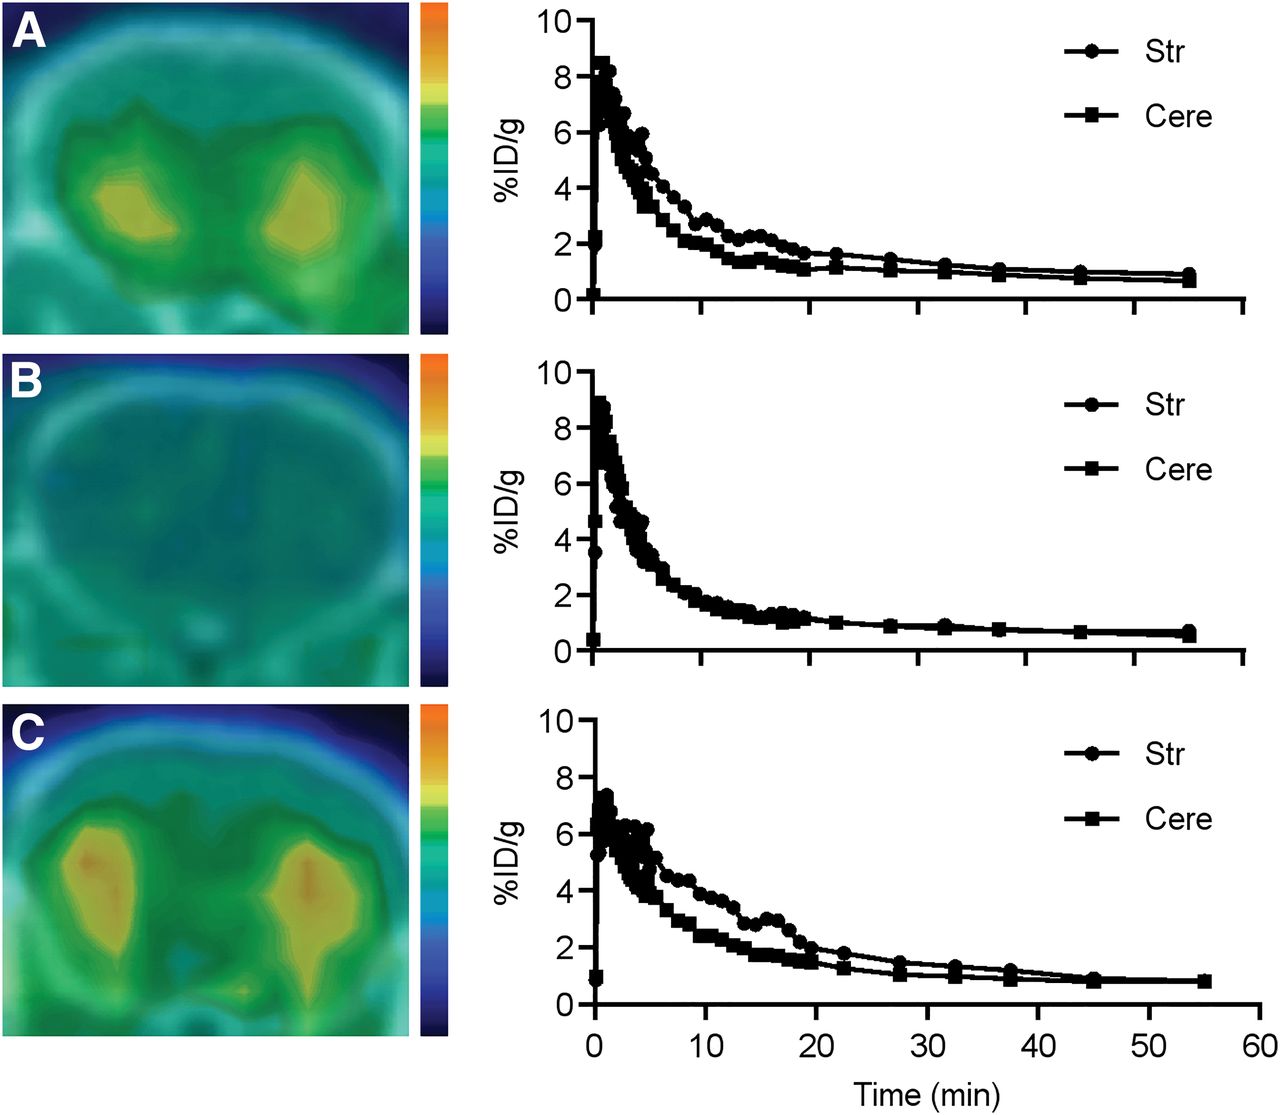
Representative 11C-ORM-13070 PET/CT images and time–activity curves for striatum and cerebellar cortex of α2A KO (A), α2AC KO (B), and WT mice (C). α2A KO and WT mice show higher uptake in striatum than cerebellar cortex. No differences in regional uptake were seen in α2AC KO mice. Cere = cerebellar cortex; Str = striatum.
Ex Vivo Autoradiography and Specificity of 11C-ORM-13070 Binding
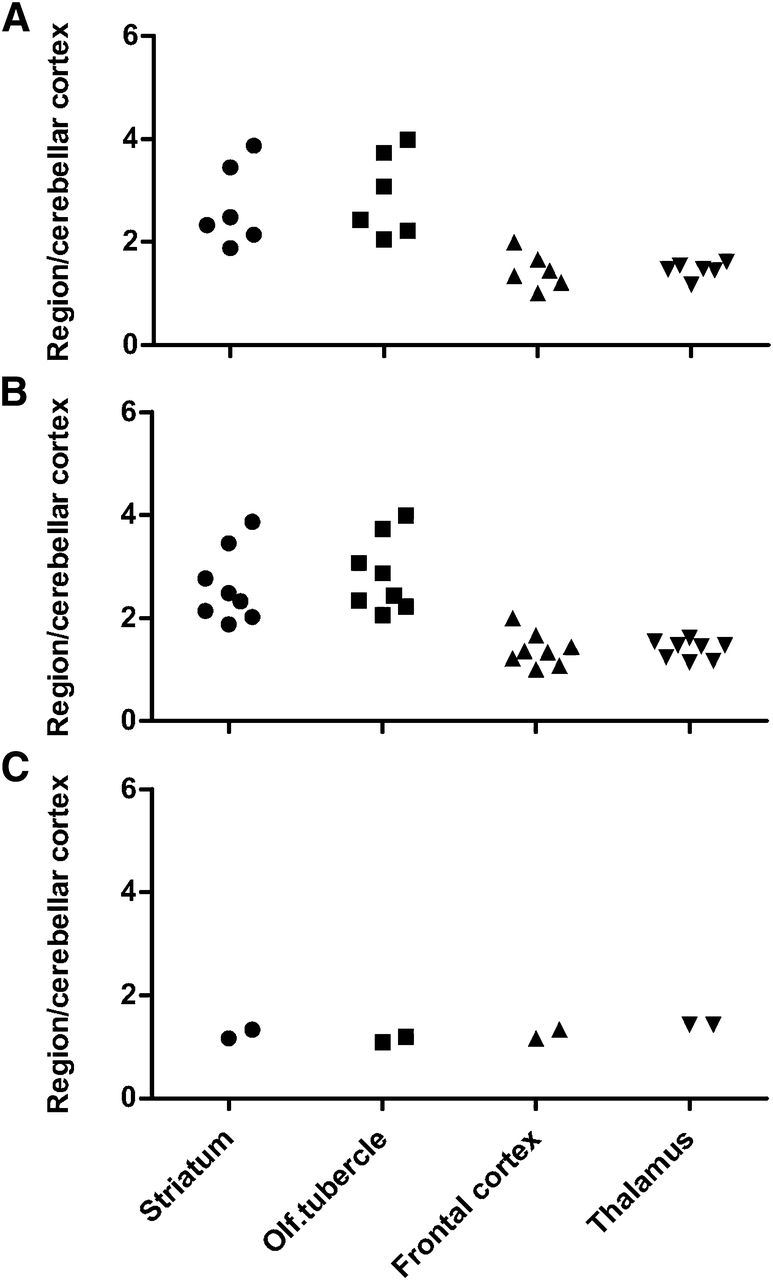
The highest region–to–cerebellar cortex radioactivity ratios in both rats and WT and α2A KO mice were observed in the striatum and olfactory tubercle (Figs. 4 and 5; Supplemental Figs. 1 and 2). In rats pretreated with atipamezole, the 11C radioactivity ratios of the striatum and olfactory tubercle were similar to those of the frontal cortex and thalamus at 30 min after injection—that is, close to 1.0 (Fig. 4). The region–to–cerebellar cortex radioactivity ratios were clearly higher in the striatum and olfactory tubercle in α2A KO and WT mice than α2AC KO mice (P = 0.024 and 0.032 for α2A KO vs. α2AC KO, and P = 0.036 and 0.091 for WT vs. α2AC KO). α2A KO mice also tended to have higher frontal cortex–to–cerebellar cortex radioactivity ratios than α2AC KO mice (P = 0.061) (Fig. 5).
Region–to–cerebellar cortex radioactivity ratios for Sprague–Dawley rats were calculated from ex vivo autoradiograms. Brain cryosections were obtained 10 min (A) and 30 min (B) after 11C-ORM-13070 injection without pretreatment and at 30 min after 11C-ORM-13070 injection with atipamezole pretreatment (C) (mean ± SD, n = 2–8). Olf. = olfactory.

Region–to–cerebellar cortex radioactivity ratios for α2A KO (A), α2AC KO (B), and C57Black WT (C) mice were calculated from ex vivo autoradiograms of 40-μm brain cryosections, which were obtained 10 min after 11C-ORM-13070 injection. Each animal is marked with individual marker (■, •, ▲, and ▼). Region–to–cerebellar cortex radioactivity ratios were higher in striatum and olfactory tubercle of α2A KO and WT mice than α2AC KO mice (P = 0.024 and 0.032 for α2A KO vs. α2AC KO, and P = 0.036 and 0.091 for WT vs. α2AC KO). Trend toward significance was also observed for difference between α2A KO and α2AC KO mice for frontal cortex–to–cerebellar cortex radioactivity ratio (P = 0.061). Asterisks (*) denote individual animals dosed with 11C-ORM-13070 with relatively low SA (injected mass, 31.0 and 31.4 nmol/kg), highlighting importance of high SA in imaging of receptors with low abundance and high affinity. Olf. = olfactory.
Radioactive Metabolites of 11C-ORM-13070
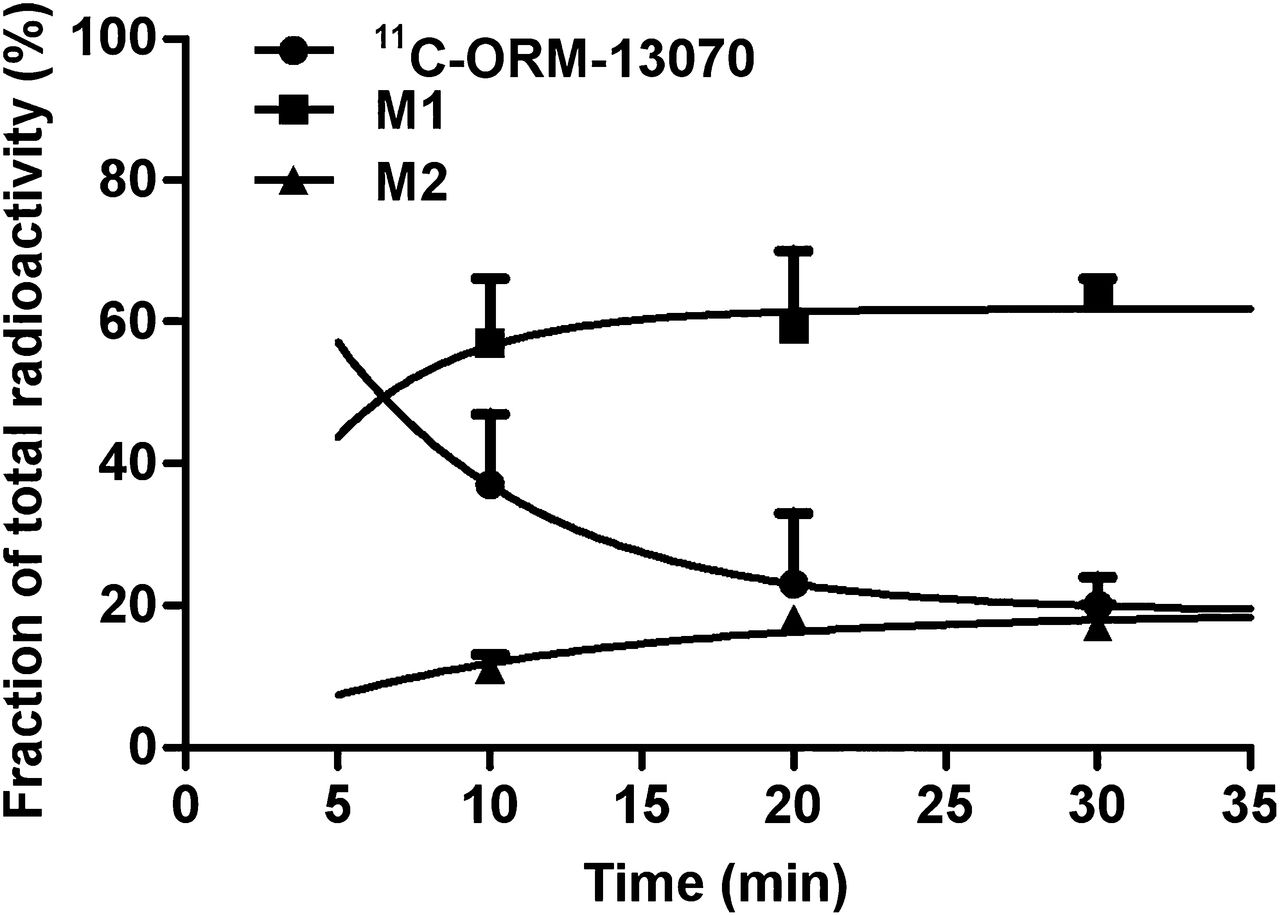
Intact 11C-ORM-13070 was detected in rat plasma, striatum, and cerebellar cortex at a retention time of 7.3 min in HPLC. One major radioactive metabolite (M1) was detected in all samples, at a retention time of 2.1 min. Another minor radioactive metabolite (M2) was detected at a retention time of 3.4 min. Chromatograms of samples of rat striatum, cerebellar cortex, and plasma at 10 min after injection are shown in Supplemental Figure 3. At 10 min after injection, 32% ± 10% of the total radioactivity was found as intact 11C-ORM-13070 in plasma (Fig. 6). The fraction of intact 11C-ORM-13070 was 89% ± 3% (n = 5) in the striatum and 81% ± 5% (n = 3) in the cerebellar cortex at 10 min after injection. At 30 min after injection, the fractions were 77% ± 9% (n = 3) and 58%–67% (n = 2), respectively. Only M1 was observed in the brain (Supplemental Fig. 3).

In vivo metabolism of 11C-ORM-13070 in blood plasma of Sprague–Dawley rats. Time–radioactivity curves obtained from high-performance liquid chromatograms of plasma samples at 10, 20, and 30 min after injection of 11C-ORM-13070 are shown. 11C-ORM-13070 was metabolized into 2 polar radiolabeled metabolites, and fractions of unmetabolized tracer and radiolabeled metabolites changed over time.
Metabolites corresponding to M1 and M2 could not be detected in plasma or brain samples with mass spectroscopy (supplemental data). It is likely that M1 and M2 represent volatile compounds with low molecular weight, not detectable with the used HPLC–mass spectroscopy approaches.
Binding of 11C-ORM-13070–derived radioactivity to plasma proteins decreased over time. The fraction of unbound 11C radioactivity in plasma at 10 min was 32%–39% and 48%–58% at 30 min (n = 2 for each time point).
Biodistribution in Rats and Dosimetry
The 11C radioactivity uptake in peripheral organs and tissues after injection of 11C-ORM-13070 in rats is presented in Supplemental Table 1. The uptake of 11C-ORM-13070 into tissues was rapid, reaching its maximum in most tissues at 2 min after injection. The highest initial 11C radioactivity was found in the adrenal glands. High levels of 11C radioactivity were also recorded in the small intestine, kidneys, pancreas, and liver.
Dose estimates for an adult human were extrapolated from the rat biodistribution data. The organs with the highest estimated doses were the small intestine and adrenal glands, with 36.8 and 14.4 μSv/MBq, respectively. The estimated effective human radiation dose of 11C-ORM-13070 was 4 μSv/MBq.
DISCUSSION
We aimed to develop 11C-ORM-13070 as a PET tracer for brain α2C adrenoceptor imaging and to evaluate its suitability for PET imaging. Several α2 adrenoceptor PET tracer candidates have been evaluated previously, but they have either lacked receptor subtype selectivity or shown poor penetration into the brain (6–11). Receptor binding assays have been performed with ORM-13070 and recombinant human α2 adrenoceptor subtypes (17) and more than 100 other potential receptor targets (Cerep Discovery Profile) to determine the receptor profile of the tracer. The calculated binding affinities were as follows (binding affinity values [nM], with corresponding 95% confidence intervals in parentheses): α2C adrenoceptor, 3.8 (2.0–7.3); α2B adrenoceptor, 23 (14–38); and α2A adrenoceptor, 109 (86–138). Screening assays for binding to more than 100 other potential receptors and targets indicated only weak or no activity of ORM-13070 (Orion Pharma, unpublished data, 2006).
We developed an efficient method for the radiosynthesis of 11C-ORM-13070 and demonstrated, through preclinical evaluation, the specificity and selectivity of the tracer for α2C adrenoceptors in rats and mice and its suitability for in vivo imaging. Of the brain regions investigated here, α2C adrenoceptor expression has been shown to be most abundant in the striatum and olfactory tubercle, less abundant in the frontal cortex, and very low in the thalamus and cerebellum (4). In general, our results with 11C-ORM-13070 agree with these previous findings.
High SA is important for imaging of brain receptors that are expressed at low density, to avoid significant receptor occupancy, subsequent errors in the quantitation of binding sites, and possible pharmacologic effects. The high SA of 11C-ORM-13070 was achieved using in-target–produced 11C-methane with high SA as starting material for 11C-methyl iodide production (18) and subsequent synthesis of 11C-ORM-13070. 11C-ORM-13070 was synthesized with good radiochemical yield, and the radiochemical purity exceeded 99% in all syntheses.
Initial in vivo PET imaging and ex vivo autoradiographic studies of the rat brain after 11C-ORM-13070 injection showed that the distribution of tracer uptake was consistent with the known expression pattern of α2C adrenoceptors in the brain (Figs. 2, 3C, and 4; Supplemental Figs. 1 and 2) (4,5,14). The specificity of 11C-ORM-13070 binding to α2 adrenoceptors was demonstrated by pretreating rats with the subtype-nonselective α2 adrenoceptor antagonist atipamezole. This pretreatment completely blocked the binding of 11C-ORM-13070 in the striatum and olfactory tubercle (Fig. 4; Supplemental Fig. 1).
α2 adrenoceptor subtype selectivity of the tracer was demonstrated by comparison of tracer uptake in the brains of α2A KO, α2AC KO, and WT control mice (Figs. 3 and 5; Supplemental Fig. 2). The 11C-ORM-13070 binding in the brains of α2A KO and WT mice was similar. There was little tracer binding in the brains of α2AC KO mice. These results demonstrated the α2C adrenoceptor selectivity of the tracer.
Time–activity curves of specific tracer uptake into the striatum and cerebellum of rats and mice (Figs. 2 and 3) showed fast uptake into and clearance from the brain, which are suitable qualities for a tracer used for imaging of brain α2C adrenoceptors. Moreover, radio-HPLC of striatal and cerebellar cortex tissue homogenates showed that the intact tracer was the most abundant radioactive species present. Thus, the radioactivity signal in the rat brain was mainly derived from intact 11C-ORM-13070 (Supplemental Fig. 3).
The amount of 11C radioactivity increased over time in the gastrointestinal tract, indicating that the 11C radioactivity from 11C-ORM-13070 was mainly cleared via this route (Supplemental Table 1; Fig. 2). High initial 11C radioactivity uptake was found in the adrenal glands, lungs, and heart (Supplemental Table 1). Radio-HPLC of plasma as a function of time showed relatively rapid metabolism of the parent compound, where the fraction of intact tracer was approximately 20% of total 11C radioactivity at 30 min after injection. Two polar radioactive metabolites (M1 and M2) were observed in plasma (Fig. 6), but only one of these was observed in brain samples (Supplemental Fig. 3).
Metabolites corresponding to M1 and M2 could not be identified in plasma or brain samples with extensive mass spectroscopy analysis (supplemental data). The plasma protein binding of the radioactivity decreased over time, and the unbound fraction at 30 min (48%–58%) corresponded with the amount of M1 shown in Figure 6. The major radioactive metabolite M1 is likely to be a small volatile compound with no affinity for the target receptor, but its possible impact on human brain PET studies still calls for further clarification.
On the basis of the effective dose estimates derived from rats in this study, a 500-MBq injection of 11C-ORM-13070 to a 73-kg human would result in a radiation dose of 2 mSv. This is in line with the average expected exposure in PET studies of brain receptors with other 11C tracers (19).
α2C adrenoceptors are present in brain regions involved in the processing of sensory information and in the control of motor- and emotion-related activities (4). They may be involved in various neurodegenerative and neuropsychiatric disorders. The anatomic distribution of α2C adrenoceptors in the brain appears to be well conserved between rodents and humans (4,5). Therefore, results from studies on α2C adrenoceptors in rodent models are likely to be relevant for α2C adrenoceptor physiology and pharmacology in the human brain.
The α2C adrenoceptor is a potential drug target for the treatment of neurodegenerative and neuropsychiatric diseases. A PET tracer for α2C adrenoceptors is expected to be useful for preclinical and clinical drug development (20). The tracer has been introduced to human use (21,22), as evidenced by 4 already completed clinical PET trials with 11C-ORM-13070 (ClinicalTrials.gov identifiers NCT00735774, NCT00829907, NCT01435213, and NCT01794975).
CONCLUSION
An efficient method for the radiosynthesis of 11C-ORM-13070 with high SA was developed. In vivo PET imaging showed high uptake of 11C-ORM-13070 in the striatum of rats and mice. 11C-ORM-13070 emerged as a selective tracer for imaging of α2C adrenoceptors in vivo in mice and rats and is, therefore, a promising PET tracer for imaging of α2C adrenoceptors in humans.
DISCLOSURE
The costs of publication of this article were defrayed in part by the payment of page charges. Therefore, and solely to indicate this fact, this article is hereby marked “advertisement” in accordance with 18 USC section 1734. This work was supported by grants from Orion Pharma, EU IMI-JU NEWMEDS grant 115008, and the Academy of Finland (project 266891). No other potential conflict of interest relevant to this article was reported.
Footnotes
Published online May 5, 2014.
- © 2014 by the Society of Nuclear Medicine and Molecular Imaging, Inc.
REFERENCES
- Received for publication December 17, 2013.
- Accepted for publication March 17, 2014.


Jump to section
Related Articles
Cited By...
- No citing articles found.