


Abstract
Dysfunctional insulin signaling may affect brain metabolism or amyloid deposition. We investigated the associations of type 2 diabetes with amyloid accumulation measured using 11C-Pittsburgh compound B (11C-PiB) and brain hypometabolism measured using 18F-FDG PET. Methods: We studied a sample of nondemented participants from the population-based Mayo Clinic Study of Aging. All subjects underwent MR imaging, amyloid PET, and 18F-FDG PET. Alzheimer disease (AD) signature and region-of-interest (ROI) measures for 11C-PiB retention ratio and 18F-FDG ratio were measured. Diabetes was assessed from the Rochester Epidemiology Project medical records linkage system. Results: Among 749 participants (median age, 79.0 y; 56.5% men, 81.0% cognitively normal; 20.6% diabetic individuals), 18F-FDG hypometabolism (18F-FDG ratio < 1.31) in the AD signature meta-ROI was more common in diabetic individuals (48.1%) than in nondiabetic individuals (28.9%; P < 0.001). The median 18F-FDG ratio was lower in diabetic individuals than in nondiabetic individuals in the AD signature meta-ROI (1.32 vs. 1.40, P < 0.001) and in the angular (1.40 vs. 1.48, P < 0.001) and posterior cingulate gyri ROIs (1.63 vs. 1.72, P < 0.001). The odds ratio (OR) for abnormal AD signature 18F-FDG hypometabolism was elevated (2.28; 95% confidence interval [CI], 1.56–3.33) in diabetic individuals versus nondiabetic individuals after adjustment for age, sex, and education and after additional adjustment for apolipoprotein ε4 allele, glycemic level, and cognitive status (OR, 1.69; 95% CI, 1.10–2.60). However, the AD signature 11C-PiB retention ratio was similar in diabetic individuals versus nondiabetic individuals (OR, 1.03; 95% CI, 0.71–1.51; P = 0.87). In post hoc analyses in nondiabetic individuals, a 1% increase in hemoglobin A1c was associated with greater AD signature hypometabolism in cognitively normal subjects (OR, 1.93; 95% CI, 1.03–3.62; P = 0.04) and in the total cohort (OR 1.59; 95% CI, 0.92–2.75; P = 0.10). Conclusion: Diabetes and poor glycemic control in nondiabetic individuals may enhance glucose hypometabolism in AD signature regions. These factors should be investigated in longitudinal studies for their role in detecting onset of symptoms in AD.
- diabetes
- cerebral glucose metabolism
- 18F-FDG PET imaging
- 11C-PiB PET imaging
- hemoglobin A1c
- amyloid accumulation
Several studies have reported associations of type 2 diabetes with cognitive impairment, Alzheimer disease (AD), or vascular dementia (1–5). The exact mechanisms underlying the association of diabetes with AD remain incompletely understood, but studies suggest that ischemic cerebrovascular disease and hippocampal atrophy are involved (6–10). Other potential mechanisms including global and regional brain hypometabolism (6,10) and amyloid deposition have been hypothesized (11) but require further investigation. Neuropathologic studies, which provide the gold standard for AD pathology, have been inconsistent; some studies have reported greater amyloid-related pathology in diabetic brains (11) whereas others have not (3,7,12,13). Given the dysfunctional insulin signaling in type 2 diabetes, we hypothesized that abnormal cerebral glucose metabolism in diabetic individuals may lead to neuronal injury and cognitive impairment (14). PET offers the opportunity to study in vivo markers of both abnormal brain metabolism and amyloid accumulation.
The objective of our study, therefore, was to specifically examine the association of type 2 diabetes with in vivo markers of amyloid accumulation and cerebral glucose metabolism measured using 11C-Pittsburgh compound B (11C-PiB) PET and 18F-FDG PET, in a subset of participants from the population-based Mayo Clinic Study of Aging.
MATERIALS AND METHODS
Study Participants
The study design and methodology have previously been published (15). Briefly, participants were Olmsted County, Minnesota, residents aged 70–89 y on October 1, 2004, who were randomly selected from an enumeration of the population using the Rochester Epidemiology medical records linkage system and invited to participate in the Mayo Clinic Study of Aging (16). Starting in 2008, additional subjects were recruited continually to maintain the sample size. Participants were invited to undergo MR imaging of the brain in 2005 and PET imaging in 2006. All subjects signed a written informed consent form that included the Health Insurance Portability and Accountability Act authorization to use and disclose protected health information. The Mayo Clinic and Olmsted Medical Center Institutional Review Boards approved all study protocols.
Assessment of Cognitive Status
Each participant underwent a nurse or study coordinator interview, a physician evaluation, and cognitive testing by a psychometrist. The interview included questions about memory (participant) and the Clinical Dementia Rating Scale (17) and Functional Activities Questionnaire (informant) (18). The physician evaluation included the Short Test of Mental Status (19) and a neurologic examination. The cognitive testing used 9 tests to assess performance in memory (3 tests), executive function (2 tests), language (2 tests), and visuospatial skills (2 tests) domains. Cognitive domain scores were computed from age-adjusted test scores that were scaled (mean, 10; SD, 3), then summed and scaled tests within a domain to allow comparisons across domains (15,20,21).
Mild cognitive impairment (MCI) criteria were defined as cognitive concern (subject, informant, nurse, or physician), impairment in one cognitive domain or more, essentially normal functional activities, and no dementia (15,21,22). Dementia was based on the Diagnostic and Statistical Manual of Mental Disorders, 4th ed. (DSM-IV) (23) criteria. Subjects who performed within the range for cognitively normal (CN) subjects from the population and did not meet criteria for MCI or dementia were considered CN (15,21,22).
Ascertainment of Type 2 Diabetes
Type 2 diabetes was abstracted from the medical records (16) as treatment for diabetes (oral antidiabetic agents, insulin), or a fasting blood glucose of 126 mg/dL or more reported two or more times, or a physician diagnosis (24).
Other Covariates
Date of birth and years of education were assessed by interview. Hemoglobin A1c (HBA1c) level at enrollment was assessed from the medical record (16). Apolipoprotein (APOE) genotype was performed at baseline, and blood glucose was measured just before PET imaging.
18F-FDG PET and 11C-PiB PET Acquisition
MR imaging was performed at 3T with a 3-dimensional volumetric T1-D-MPRAGE (magnetization-prepared rapid gradient-echo) sequence previously described (25). PET images were acquired using a PET/CT scanner operating in 3-dimensional mode (26). A CT image was obtained for attenuation correction. The 11C-PiB PET scan consisted of four 5-min dynamic frames acquired 40–60 min after injection (27). Subjects were injected with 18F-FDG 1 h after the 11C-PiB scan and imaged after 30–38 min, for an 8-min image acquisition of four 2-min dynamic frames (27,28). An in-house fully automated image-processing pipeline was used for quantitative image analysis for 11C-PiB and 18F-FDG. Each subject’s PET images were registered to his or her MR images, which had been labeled with our parcellation atlas (27). An AD signature cortical 11C-PiB PET meta-region-of-interest (meta-ROI) retention ratio was calculated from the median uptake over voxels in the prefrontal, orbitofrontal, parietal, temporal, anterior cingulate, and posterior cingulate/precuneus ROIs normalized to the cerebellar gray matter ROI of the atlas (26). An AD signature 18F-FDG PET ratio was calculated in a similar manner based on glucose metabolic rates from an Alzheimer signature meta-ROI and consisted of the average bilateral angular gyri, posterior cingulate/precuneus, and inferior temporal cortical ROIs from both hemispheres normalized to pons uptake (29–31).
Statistical Analyses
We defined an abnormal AD signature meta-ROI 11C-PiB retention ratio (standardized uptake value ratio) as greater than 1.50 and an abnormal AD signature meta-ROI 18F-FDG ratio as less than 1.31, corresponding to the 90% sensitivity in AD dementia (28,32). For 11C-PiB PET, for which higher biomarker values are worse, the cutpoint corresponding to 90% sensitivity was at the 10th percentile of the AD distribution. For 18F-FDG PET, for which lower biomarker values are worse, the cutpoint was at the 90th percentile of the AD distribution. We examined the association of diabetes with abnormal AD signature 11C-PiB PET ratio and 18F-FDG PET ratio using logistic regression models adjusted for age and sex. Given that 18F-FDG ratio varies with cognitive status, we performed analyses for the total sample, MCI, and CN (30) We examined potential confounding and effect modification (interaction) by APOE ε4 allele, blood glucose at PET imaging, and cognitive status. For comparison, we selected non-AD regions of the primary sensorimotor regions and global whole brain (based on 35 ROIs), computed unadjusted and glucose-adjusted means of 18F-FDG ratio, and examined their associations with diabetes using linear regression models. We conducted post hoc analyses in nondiabetes to determine whether glycemic control (HBA1c) was also associated with hypometabolism. All analyses were conducted using SAS (version 9.3; SAS). P values were considered significant at an α less than 0.05 (2-tailed tests).
RESULTS
Table 1 shows the characteristics of 749 participants without dementia who underwent PET imaging (2006–2012). The frequency of an abnormal AD signature meta-ROI 18F-FDG ratio was significantly higher among diabetic individuals; the median was lower in diabetic individuals than in nondiabetic individuals in both CN and MCI subjects (Fig. 1, top) and in the total sample (not shown). 18F-FDG hypometabolism was found in all 3 subregions of the AD signature meta-ROI. Unadjusted means for AD signature 18F-FDG ratio for sensorimotor regions and whole brain and were significantly different in diabetic individuals versus nondiabetic individuals, but glucose-adjusted means did not differ (Supplemental Table 1; supplemental materials are available at http://jnm.snmjournals.org).
Characteristics of Participants by Type 2 Diabetes
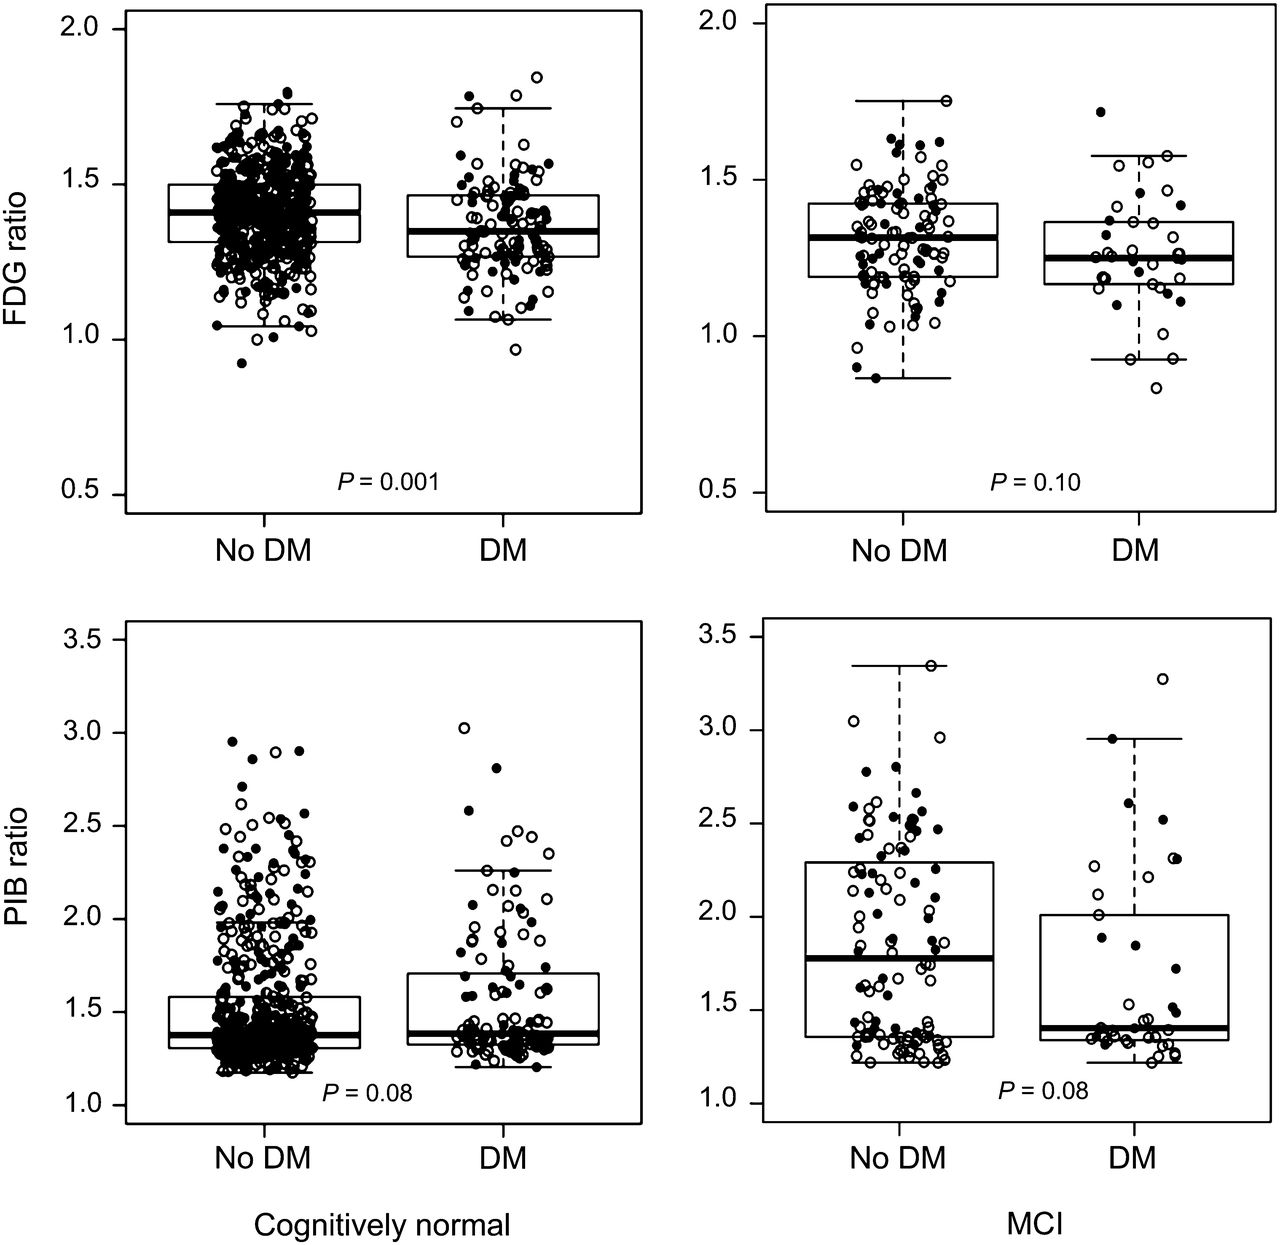
Box plots for 18F-FDG and 11C-PiB retention ratio in AD signature regions by diabetes mellitus (DM) in CN and MCI subjects. ● = women; ○ = men.
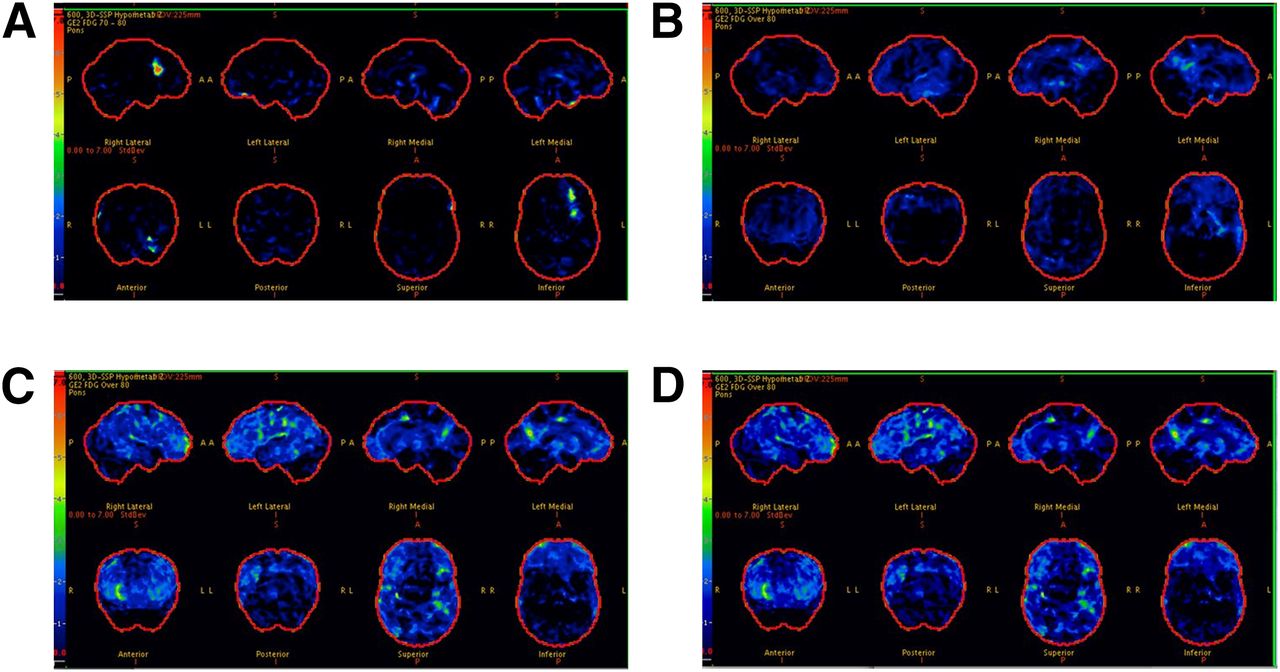
In the total sample, AD signature meta-ROI 18F-FDG ratio was significantly lower in younger diabetic individuals than in nondiabetic individuals (Figs. 2A and 2B), in men than in women (Figs. 2C and 2D), and in APOE ε4 noncarriers than in carriers (Figs. 2E and 2F); the findings were consistent for CN and MCI (not shown). In representative scans, AD signature 18F-FDG hypometabolism was absent in subjects with no diabetes and no MCI (Fig. 3A), minimal in nondiabetic individuals with MCI (Fig. 3B), and worst in diabetic individuals with MCI (Figs. 3C and 3D).
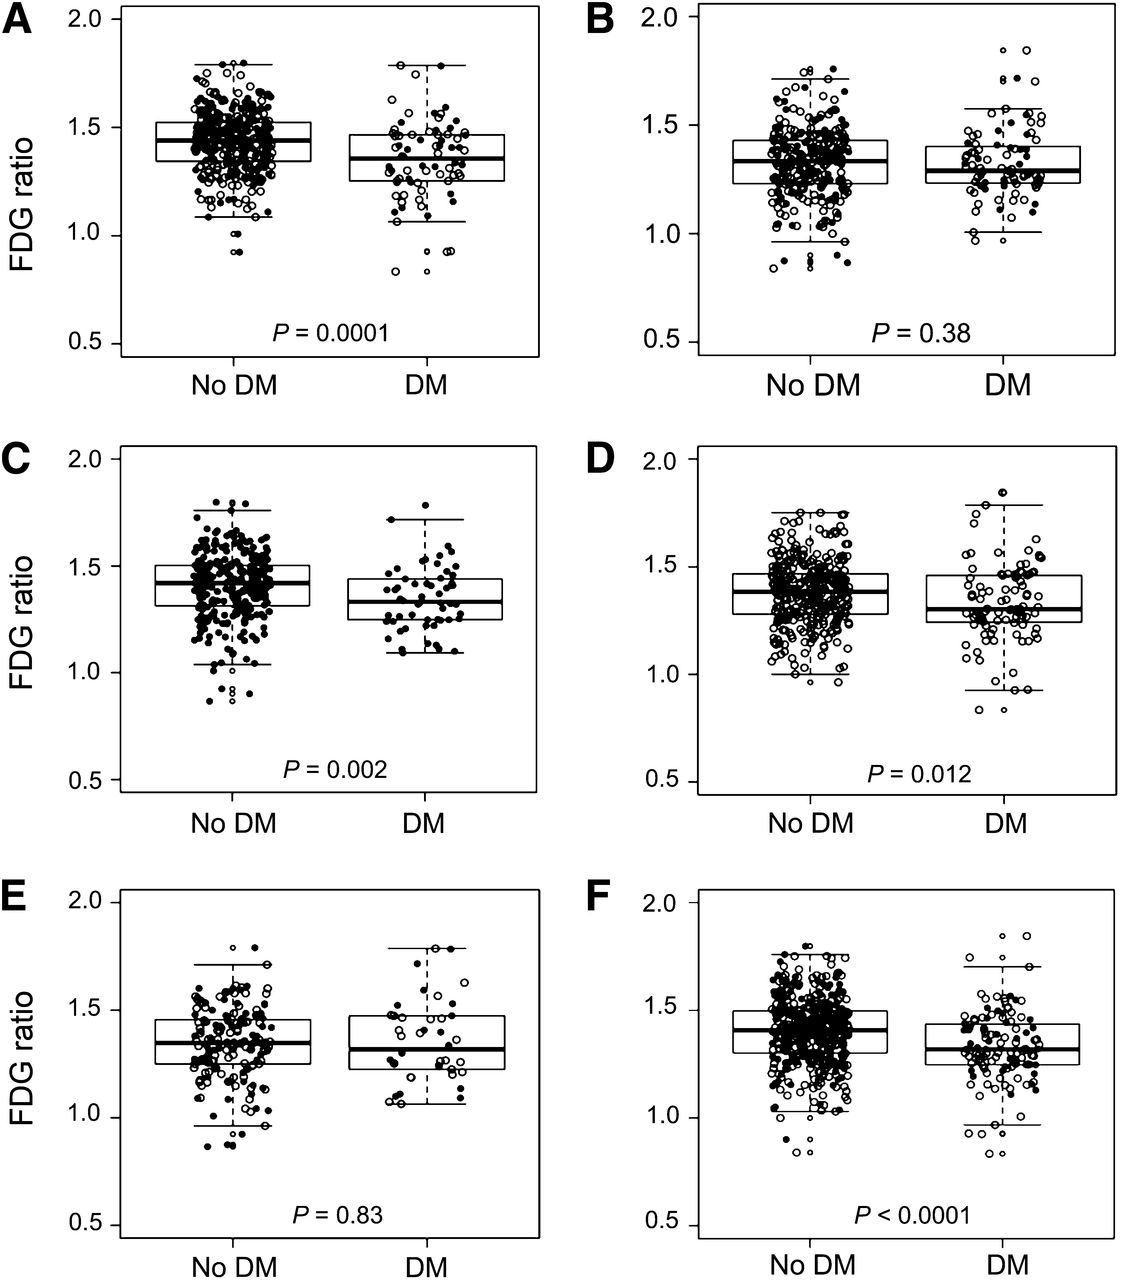
Box plots of 18F-FDG ratio in AD signature regions in total sample by diabetes (DM) status stratified by age (70–79 y [A] and 80–89 y [B]), sex (women [C] and men [D]), and apolipoprotein ε4 allele (ε4 carrier [E] and ε4 noncarrier [F]). ● = women; ○ = men.

18F-FDG scans for participants without diabetes (CN [A] and MCI [B]) and with diabetes (both with MCI [C and D]). Each image set represents 3-dimensional stereotactic surface projections of regional hypometabolism normalized to age-appropriate healthy subjects and displayed as z score; upper boundary as 7.0 (red) and lower boundary as 0.0 (black). z score of 1.5 (medium blue) or greater would be considered significant.
By contrast, the proportion of diabetic individuals versus nondiabetic individuals with an abnormal AD signature meta-ROI 11C-PiB ratio did not differ (Table 1). The median AD signature meta-ROI 11C-PiB ratio was similar for diabetic individuals versus nondiabetic individuals (Table 1) among CN and MCI (Fig. 1, bottom).
Association of Diabetes with AD Signature 18F-FDG Uptake
Diabetes was significantly associated with AD signature meta-ROI 18F-FDG hypometabolism of the range seen in AD dementia (Table 2). The odds ratio (OR) decreased slightly after adjustment for glucose but remained significant for the total sample and MCI cases for the fully adjusted models. Diabetes was associated with decreased 18F-FDG ratio in the sensorimotor ROIs and the whole brain, but the associations were not significant after adjustment for glucose (Supplemental Table 2). There were no significant interactions of diabetes with age, sex, or APOE ε4; the OR for diabetes and hypometabolism was significant for subjects with glucose levels less than 126 mg/dL (OR, 1.72; 95% confidence interval, 1.11–2.69; P = 0.02) (Supplemental Table 3).
Association of Type 2 Diabetes with Abnormal 18F-FDG PET Ratio* in AD Signature Meta-ROI
Association of Diabetes with AD Signature 11C-PiB
In contrast to unadjusted estimates, the OR for abnormal AD signature meta-ROI 11C-PiB was significantly reduced in subjects with MCI after adjustment for age, sex, and education but not after adjustment for APOE ε4 allele (Table 3).
Associations of Type 2 Diabetes with Abnormal 11C-PiB PET Retention Ratio* in AD Signature Meta-ROI
HbA1c and AD Signature 18F-FDG Hypometabolism
In CN nondiabetic individuals, the OR for hypometabolism in the AD signature meta-ROI increased with each 1% increase in HBA1c after adjustment for age, sex, and education (OR, 1.93; 95% CI, 1.03–3.62; P = 0.04) and after additional adjustment for APOE ε4 allele (OR, 1.89; 95% CI, 1.00–3.57; P = 0.049).
DISCUSSION
In this sample of elderly persons, diabetes was associated with 18F-FDG hypometabolism. This association persisted in the AD signature region for the total sample and MCI cases even after controlling for serum glucose but not in the sensorimotor cortex. By contrast, diabetes was not associated with increased 11C-PiB retention ratio (amyloid accumulation) in AD signature meta-ROIs for the total sample, or for CN subjects, but the OR was significantly reduced in subjects with MCI in models that did not include APOE ε4.
Glucose hypometabolism in diabetic individuals suggests that diabetes affects cerebral energy metabolism independently of amyloid deposition, possibly through mechanisms that cause neuronal injury (33). This hypometabolism in CN diabetic individuals suggests that neuronal injury is present even before symptomatic evidence of cognitive impairment. The loss of significance in the CN group after adjustment for glucose level, however, suggests that the effect of diabetes may be small in CN or below the threshold for sustained effect, such that a larger sample of CN is required to detect a significant difference. Alternately, the findings in CN may be due to a more generalized diabetes effect rather than a specific AD meta-ROI effect. The persistence of significant associations for the total sample and for MCI cases, even after adjustment for glucose, suggests the effect may be real. The stronger association for MCI subjects suggests that hypometabolism may be in the causal pathway for cognitive impairment in diabetic individuals. Finally, the absence of an effect in multivariable models for the sensorimotor cortex suggests that the associations are not entirely explained by a competitive inhibition of labeled glucose uptake by elevated serum glucose in diabetic individuals.
Our subgroup analyses showed stronger associations of diabetes with hypometabolism for APOE ε4 noncarriers, younger subjects, and men. The stronger OR for APOE ε4 noncarriers suggests that APOE ε4 allele effects might share some mechanistic commonalities with diabetes, that are independent of APOE ε4–related amyloidosis (34). The stronger association in 70- to 79-y-olds may relate to earlier diabetes onset, age-related differences in diabetes effects, nonparticipation in older subjects, or potential survival bias. The stronger OR in men suggests etiologic differences as observed for amnestic MCI in our previous studies (21,35). Follow-up of the cohort will provide greater power to detect significant interactions.
Our findings for HBA1c in nondiabetic individuals support our hypothesis that altered glycemic control is associated with neuronal injury and are consistent with other studies. In CN adults with newly diagnosed prediabetes or diabetes, increasing insulin resistance was associated with greater 18F-FDG hypometabolism in AD regions (36), and higher fasting glucose levels in CN nondiabetic individuals were associated with 18F-FDG hypometabolism (37). These findings suggest that markers of prediabetes should be examined for early detection of brain hypometabolism.
The analyses reported here did not use partial-volume correction. When we applied partial-volume correction, our findings changed somewhat. Significant associations persisted with adjustment for age- and sex-adjusted models in AD signature regions. However, glucose-adjusted models were not significant. This difference in results may mean that the 18F-FDG changes we observed may in part reflect loss of brain volume due either to diabetes or to other etiology. Alternately, we recognize that if diabetes and related hyperglycemia contributes to structural and metabolic changes, controlling for blood glucose may result in overcontrolling.
The absence of an association of diabetes with 11C-PiB retention ratio in AD signature regions in CN subjects is consistent with findings from several studies (3,7,12,13,38). In one study, diabetes was associated with cerebral infarctions but not with AD pathology (7); another study found no difference in AD pathology among diabetic individuals and nondiabetic individuals (3). A third study reported that diabetic APOE ε4 carriers had a lower amyloid β load than nondiabetic individuals (12). In contrast, one study reported that diabetic APOE ε4 carriers had greater AD pathology (11), and another reported greater plaque density with longer duration of diabetes (3).
The absence of an association of diabetes with AD signature 11C-PiB ratio and the significantly lower AD signature 11C-PiB in diabetic MCI subjects are inconsistent with the hypothesis that diabetes contributes to increased amyloid deposition (39,40). However, they are consistent with other studies (41). In the Baltimore Longitudinal Study of Aging, diabetes-related parameters were not associated with AD pathology (41). It is possible that diabetes may have greater effects on neuronal injury and brain atrophy than on amyloid accumulation in elderly persons (8,9). The null association may also be due to interactions of timing of onset of vascular pathology with amyloid deposition in diabetic individuals. By contrast, subjects with diabetes and 11C-PiB deposition occurring independently at earlier ages may progress more rapidly from MCI to dementia and may be less likely to be captured in our cohort because we did not initially enroll demented subjects to imaging studies. The absence of a significant difference in AD signature 11C-PiB ratio for MCI diabetic individuals and nondiabetic individuals (Fig. 1, lower) versus the significant association observed in multivariable models suggests possible confounding; the association was significant after adjustment for age, sex, and education but not APOE ε4 allele. These findings indicate the need to account for potential confounders when comparing 18F-FDG ratio across regions.
One potential limitation of our study is that because of the cross-sectional design, we cannot assess causality. The absence of associations of diabetes with AD signature 18F-FDG ratio in APOE ε4 carriers and with AD signature 11C-PiB retention ratio could be due to underrepresentation of diabetic individuals, lower participation of diabetic individuals with more severe or longer disease duration, or lower frequency of APOE ε4 allele in this older age group. HBA1c was assessed at enrollment and not at the time of imaging; however, the findings support our hypothesis that impaired glucose metabolism affects brain metabolism. Ongoing recruitment should increase the number of diabetic individuals in our sample. Finally, more than 98% of our cohort is of northern European ancestry, thus our findings should be confirmed in other ethnicities.
Our study has several important strengths. Participants were randomly selected from the population; thus, our findings are less subject to selection or volunteer bias. The diagnosis of diabetes was reliably ascertained using the medical records linkage system and not subject to recall bias as occurs with self-reporting. We had a large sample size of subjects who had undergone PET imaging, which provides more reliable estimates than studies of small sample size.
CONCLUSION
In elderly persons, diabetes and impaired glucose metabolism in CN might contribute to neuronal injury. These factors should be examined in future longitudinal studies for their potential role in detecting onset of AD symptoms.
DISCLOSURE
The costs of publication of this article were defrayed in part by the payment of page charges. Therefore, and solely to indicate this fact, this article is hereby marked “advertisement” in accordance with 18 USC section 1734. This work was supported by NIH grants U01 AG006786, P50 AG16574, K01 AG028573, K01 MH68351, R01 AG011378, and R01 AG041851; the Robert H. and Clarice Smith and Abigail Van Buren Alzheimer’s Disease Research Program; the Center for Individualized Medicine of Mayo Clinic; the Minnesota Partnership for Biotechnology and Medical Genomics; GE Healthcare; the Elsie and Marvin Dekelboum Family Foundation; the Rochester Epidemiology Project (R01 AG034676); Abbvie Health Economics and Outcomes Research; the Walter S. and Lucienne Driskill Foundation; Cephalon, Inc.; Allon Therapeutics, Inc.; the NIA; the Alzheimer’s Association; the Mangurian Foundation; the Alexander Family Alzheimer's Disease Research Professorship; Siemens Molecular Imaging; the MN Partnership for Biotechnology and Medical Genomics; and the Leukemia & Lymphoma Society. Dr. Knopman is deputy editor for Neurology; on the data safety monitoring boards for Lilly Pharmaceuticals, Lundbeck Pharmaceuticals, and the DIAN study; a consultant to TauRx Pharmaceuticals through 2012; and an investigator for clinical trials by Baxter and Elan Pharmaceuticals, TauRx. Dr. Kantarci is on the data safety monitoring board for Takeda Global Research & Development Center, Inc. Dr. Boeve is a consultant to GE Healthcare and receives publishing royalties for The Behavioral Neurology of Dementia (Cambridge University Press, 2009). Dr. Petersen is on the scientific advisory boards for Pfizer, Inc., Janssen Alzheimer Immunotherapy, Elan Pharmaceuticals, and GE Healthcare; is a CME lecture for Novartis, Inc.; and receives royalties for Mild Cognitive Impairment (Oxford University Press, 2003). Dr. Jack is a consultant for Janssen, Bristol-Meyer-Squibb, General Electric, Siemens, and Johnson and Johnson and an investigator for Allon and Baxter, Inc., clinical trials. Dr. Lowe is on the scientific advisory boards for Bayer Schering Pharma and GE Healthcare. No other potential conflict of interest relevant to this article was reported.
Footnotes
Published online Mar. 20, 2014.
- © 2014 by the Society of Nuclear Medicine and Molecular Imaging, Inc.
REFERENCES
- Received for publication September 17, 2013.
- Accepted for publication November 13, 2013.


Jump to section
Related Articles
Cited By...
- Cognitive decline and diabetes: a systematic review of the neuropathological correlates accounting for cognition at death
- Diabetes Mellitus and Cognition: Pathway Analysis in the MEMENTO Cohort
- Insulin Resistance Is Associated With Enhanced Brain Glucose Uptake During Euglycemic Hyperinsulinemia: A Large-Scale PET Cohort
- Association of midlife vascular risk and AD biomarkers with subsequent cognitive decline
- Diabetes and dementia incidence in Latin America; a 10/66 population-based cohort study
- Inflammation in the hippocampus affects IGF1 receptor signaling and contributes to neurological sequelae in rheumatoid arthritis
- Chronic social stress-induced hyperglycemia in mice couples individual stress susceptibility to impaired spatial memory
- Striatal molecular alterations in HD gene carriers: a systematic review and meta-analysis of PET studies
- Brain amyloid load and its associations with cognition and vascular risk factors in FINGER Study
- Type 2 Diabetes, Cognition, and Dementia in Older Adults: Toward a Precision Health Approach
- Type 2 diabetes mellitus is associated with brain atrophy and hypometabolism in the ADNI cohort
- The ARIC-PET amyloid imaging study: Brain amyloid differences by age, race, sex, and APOE
- Changes in insulin and insulin signaling in Alzheimers disease: cause or consequence?
- Multimorbidity and neuroimaging biomarkers among cognitively normal persons
- Type 2 diabetes mellitus and biomarkers of neurodegeneration
- High glucose concentrations per se do not adversely affect human sperm function in vitro