


Abstract
Inclusion of time-of-flight (TOF) information in PET reconstructions has been demonstrated to improve image quality through better signal-to-noise ratios, faster convergence, better lesion detectability, and better image uniformity. The goal of this work was to assess the impact of TOF information on the accuracy and precision of quantitative measurements of activity uptake in small lesions in clinical studies. Methods: Data from small (10-mm diameter) spheres were merged with list-mode data from 6 healthy volunteers after injection of 18F-FDG. Six spheres having known activity uptake with respect to the average whole-body uptake were embedded in both the liver and the lung of the subject’s data. Images were reconstructed with TOF information and without TOF information (non-TOF reconstruction). The measured uptake was compared with the known activity; variability was measured across 60 bootstrapped replicates of the merged data, across the 6 spheres within a given organ, and across all spheres in all subjects. Results: The average uptake across all spheres and subjects was approximately 50% higher in the lung and 20% higher in the liver with TOF reconstruction than with non-TOF reconstruction at comparable noise levels. The variabilities across replicates, across spheres within an organ, and across all spheres and subjects were 20%–30% lower with TOF reconstruction than with non-TOF reconstruction in the lung; in the liver, the variabilities were 10%–20% lower with TOF reconstruction than with non-TOF reconstruction. Conclusion: TOF reconstruction leads to more accurate and precise measurements, both within a subject and across subjects, of the activity in small lesions under clinical conditions.
The benefit of including time-of-flight (TOF) information in the reconstruction of PET data was demonstrated in the 1980s (1–3), when TOF PET scanners were first developed, and followed the predictions of reduced variance (4–6). The gain obtained with TOF reconstruction was characterized by an improved signal-to-noise ratio, with higher gains being predicted for larger objects and better timing resolution. Since the resurgence of interest in TOF information in the last decade and the subsequent development of commercial TOF PET systems (7–9), the advantages of reconstruction with TOF information over reconstruction without TOF information (non-TOF reconstruction) have been studied more thoroughly through simulation and measurement with iterative reconstruction methods (10–22). Iterative TOF PET reconstruction of simulated phantoms (10) resulted in faster and more uniform convergence of contrast recovery that improved further with better timing resolution; this faster convergence with TOF reconstruction resulted in contrast recovery that was higher than that achieved with non-TOF reconstruction at similar noise levels. Measurements of the TOF benefit in physical phantoms showed higher contrast recovery of small lesions with TOF reconstruction for a large uniform phantom at matched noise (11). In clinical studies, the contrast recovery of lesions having unknown uptake was higher with TOF reconstruction than with non-TOF reconstruction for all subjects, and the gain in contrast recovery with TOF reconstruction increased with patient mass (11). In a visual assessment of the TOF benefit in patient studies, Lois et al. (14) showed that images reconstructed with TOF had better definition of small structures, better uniformity, less noise, and higher lesion contrast. Using a prototype scanner with better timing resolution (23), we showed higher contrast recovery with reduced variability across the object and with reduced sensitivity to potential errors in the corrections (e.g., the scatter estimate) (15). Other groups have also remarked on the decreased sensitivity to inconsistencies in the data or corrections with TOF reconstruction (24,25).
The impact of TOF reconstruction on lesion detection has also been investigated with numeric and human observers. TOF information was shown to improve lesion detectability with numeric observers for spheric lesions in simple uniform cylindric phantoms (12,18). Kadrmas et al. (13,20) found improved lesion detectability with TOF reconstruction in 2 sizes of physical anthropomorphic phantoms containing spheric lesions by using localization receiver-operating-characteristic analysis with both numeric and human observers; they found a greater TOF impact for the larger phantom. More recently, the benefit of TOF reconstruction for lesion detectability was demonstrated with both numeric and human observers for clinical whole-body patient data with embedded artificial lesions, especially for low-contrast lesions or large subjects (16,17,22).
The goal of this work was to adapt the sphere insertion technique used in our lesion detectability studies to assess the impact of TOF information on both the accuracy and the precision of the measurement of uptake in lesions in clinical PET data. The power of this technique is that it combines the advantages of a phantom study, where truth is known, with the nonuniform activity and attenuation distributions seen in patient studies.
MATERIALS AND METHODS
TOF Scanner
Data were acquired with the University of Pennsylvania prototype TOF PET scanner, based on LaBr3 scintillators (15,23). This fully 3-dimensional scanner comprises 24 modules of 1,620 crystals (4 × 4 × 30 mm) in a 93-cm-diameter ring. The transverse field of view is 57.6 cm; the axial field of view is 19.2 cm. The intrinsic timing resolution of the scanner, measured with a point source in air, is 375 ps. The energy resolution of 6.5% after energy calibration allows the lower energy threshold to be raised to 470 keV. Data are acquired in list mode with 25-ps timing bins to preserve timing and spatial resolutions. The spatial resolution of the scanner is 5.8 mm (full width at half maximum) at a 1-cm radius.
Data Reconstruction and Corrections
The image reconstruction algorithm was the 3-dimensional list-mode iterative ordered-subsets expectation maximization (OSEM) algorithm (26,27) with a TOF kernel applied in both the forward projection and the backprojection operations (28). The TOF response function was modeled as a 1-dimensional gaussian function along the line of response. All physical effects were incorporated into the system model of the reconstruction. Resolution modeling to compensate for detector blurring was not explicitly included in the reconstruction; instead of voxels, however, modified Kaiser–Bessel (“blob”) basis functions (29,30) were used to constrain the image to be a continuous function during reconstruction. Blob basis functions control image noise without the need for postfiltering while maintaining spatial resolution (30), albeit in a spatially invariant manner. The blobs used for this study had a 7.5-mm radius placed on a 6-mm body center cubic grid (shape parameter, 8.63). The final image was interpolated to 2 × 2 × 2 mm voxels. All TOF OSEM reconstructions had 25 chronologically ordered subsets. Although clinical TOF reconstructions are typically stopped after 4 or 5 iterations, in this study the data were reconstructed for up to 20 iterations to determine the convergence with clinical data.
A rotating line source was used to correct the measured timing differences between crystals (23). Attenuation correction was performed by use of transmission imaging with a rotating 137Cs point source (31). The model-based single scatter simulation was extended to estimate the 4-dimensional scatter distribution in the radial and TOF domains (32,33). The scatter estimate used in non-TOF reconstructions was derived from the 4-dimensional single-scatter simulation–TOF scatter sinogram by compression of the sinogram along the time domain. Random coincidences were estimated by use of the delayed coincidence window technique with the smoothing technique of Casey and Hoffman (34).
Healthy Volunteer Studies
The institutional review board of the University of Pennsylvania approved this study, and all subjects signed written informed consent forms before the study. Six healthy volunteers (5 men and 1 woman; body mass index, 25–38) were injected with 555 MBq (15 mCi) of 18F-FDG and scanned after an average 105-min uptake period. Four frames were acquired to cover the region from the neck to the pelvis. The patient bed was moved between frames to allow for nearly 50% overlap of bed positions to ensure uniform axial noise behavior. The scan duration for each subject was chosen to provide counts comparable, on average, to the events measured in a 2-min–per–frame clinical 18F-FDG study on a Philips Gemini TF TOF PET scanner with our standard 60-min postinjection protocol. Totals of 115–270 megacounts (prompts) and 45–100 million counts (true events) were acquired in the 4-frame studies, in which the ranges in counts were the ranges seen across the 6 subjects.
Sphere Insertion Methodology
To assess the impact of TOF information on the accuracy and precision of sphere uptake measurements in clinically realistic conditions, we inserted spheres with known uptake into the measured healthy volunteer data. El Fakhri et al. (16) and Surti et al. (17) developed a technique for merging list-mode data from spheric lesions measured in air with data from patients for their studies on lesion detectability. In those studies, spheres were embedded at an activity ratio calculated with respect to the local activity in the organ. For this work, their technique was modified to insert spheres having known activity with respect to the average whole-body uptake, similar to a fixed standardized uptake value.
Spheres (10-mm diameter; 1-mm wall thickness) were scanned in air at 77 locations throughout the scanner field of view (radius, 0–12 cm; z-axis, 0 ± 4 cm from the center of the scanner), and the data were stored in list-mode format. Spheres were selected for insertion into the liver and lung regions of the healthy volunteer data such that no 2 spheres were closer than 3.5 cm from center to center. A total of 6 spheres were chosen for each organ.
The desired ratio (ao) of sphere uptake to the average whole-body activity concentration was 10:1. The average whole-body uptake per volume (BWB) was determined by averaging all voxels inside the body in the image after 20 iterations of list-mode TOF OSEM. The transmission image was used to define the interior of the body for this calculation. Voxels in slices within 28 mm of the ends of the whole-body image were excluded from the calculations because those slices were noisy as a result of low slice sensitivity near the ends of the axial field of view.
The procedure for calculating the number of sphere events to insert is illustrated in Figure 1. The desired total sphere activity (A) at the location of each sphere is Eq. 1where Vsph is the volume of the sphere; ao was 10 for this study. However, the whole-body image before sphere insertion had some background activity in the region of the sphere (Ab,i); therefore, the total activity to be inserted into the healthy volunteer data for sphere i (Ai) is given by
 Eq. 2The number of list-mode events to be inserted for sphere i (
 ) was calculated by scaling Ai by the ratio of the number of events in the sphere dataset (
 ) to the total activity (Atot,i) in the sphere-in-air image as follows:
 Eq. 3
Eq. 3
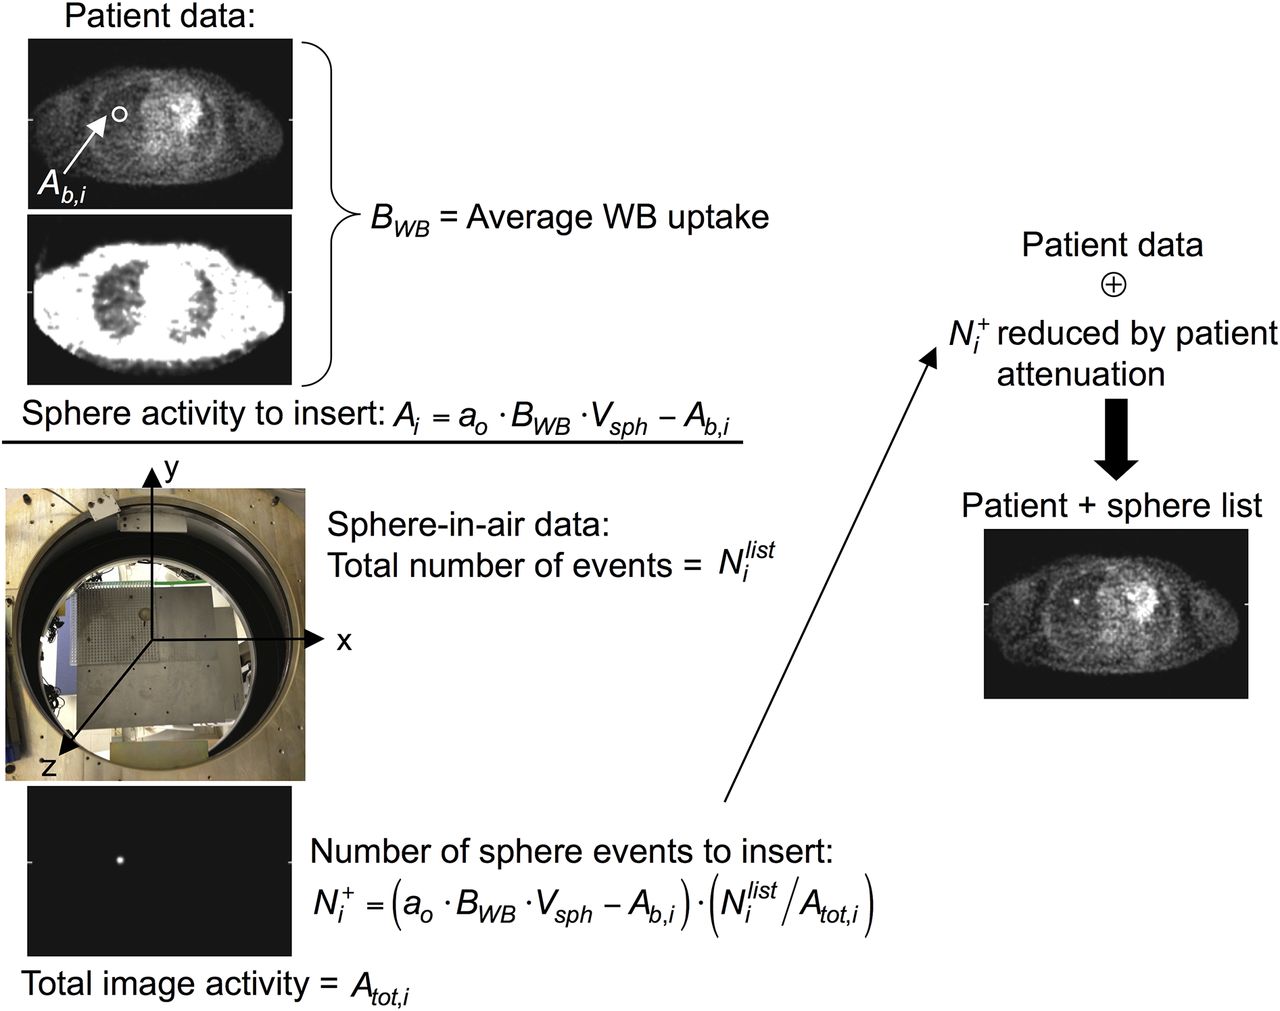
Schematic of sphere insertion process for list-mode data. Sphere activity to insert (Ai) depends on desired activity ratio (ao) with respect to average whole-body (WB) uptake per unit volume (BWB), reduced by activity already present in patient image at location of sphere (Ab,i). Sphere-in-air data were acquired at known locations on grid (photograph). Sphere data were reconstructed, and ratio of sphere-in-air list-mode events to total sphere image activity ( ) was used to scale Ai to determine number of list-mode events (
 ) that would generate that activity. These list-mode events were reduced by sampling of probability of attenuation by body for line of response of given event and then were merged with subject’s list-mode data (⊕). This procedure was adapted from that used in earlier lesion detectability studies (16,17).
This scaling undoes any geometric efficiency corrections performed during reconstruction (e.g., solid-angle correction).
To compensate for attenuation effects seen in the whole-body study but not present in the sphere-in-air data, the selected sphere events were reduced by rejecting events through random sampling of the probability of attenuation by the body for the line of response of each sphere event. The “attenuated” sphere events were then merged with the healthy volunteer data by random insertion into the subject’s list-mode data stream. The net result was an increase in the total number of events of less than 1%. This technique implicitly includes partial-volume blurring of the sphere but does not include wall effects. Unlike physical spheres in phantom measurements, the sphere wall does not displace activity around the sphere because counts are present in the subject’s data in the region of the sphere wall; this scenario results in the insertion of effectively wall-less lesions into the clinical data. The merged list-mode data were then reconstructed with TOF information and without TOF information as described earlier.
The sphere insertion process was validated by scanning a 35-cm cylinder that had 5 physical spheres (10-mm diameter; 6:1 activity ratio) located at radial positions from 0 to 11 cm. Fifteen additional 10-mm-diameter spheres were inserted into the phantom data in accordance with the procedure described earlier, with an ao of 6. The data were reconstructed with list-mode TOF OSEM for 20 iterations. Volumes of interest (VOIs; 10-mm diameter) were drawn on the spheres, and the background activity was determined by averaging all voxels inside the phantom image without inserted spheres, analogous to BWB. The average uptake in the physical spheres divided by the background activity was 2.37 ± 0.13 (mean ± SD; range, 2.19–2.48); the average uptake in the inserted spheres was 2.51 ± 0.14 (range, 2.29–2.69). The slightly higher (<10%) uptake measured in the inserted spheres than in the physical spheres can be explained by and is consistent with the findings for wall-less spheres compared with spheres having glass walls (35).
Bootstrapped Replicates
To determine the statistical variability of the measured sphere uptake for TOF and non-TOF reconstructions, we generated 60 replicates of the list-mode data with and without inserted spheres by using bootstrapping as proposed by Haynor and Woods (36) and as demonstrated and validated by Dahlbom (37) and Buvat (38). Bootstrapping permits an assessment of the statistical variability in TOF and non-TOF images at clinically realistic noise levels.
Analysis
Sphere uptake was calculated for VOIs with a 10-mm diameter. The VOI centers were determined from the sphere-in-air reconstructions, and the same VOIs were used on the images reconstructed from the merged sphere and subject data. The sphere VOIs (VOIsph) were normalized by the average whole-body uptake (BWB) after 20 iterations to define a normalized uptake ratio (NUV): Eq. 4BWB was calculated separately for TOF images and non-TOF images to compensate for differences in calibration for TOF and non-TOF reconstructions. Without partial-volume effects, the NUV for each sphere should be 10 (i.e., equal to ao). Because no resolution modeling was included in the reconstruction, the measured NUV was less than 10.
From the 60 replicates of the 6 patient studies with 6 inserted spheres in the lung and liver, we calculated 4 measures.
1. The average NUV for 1 replicate across all subjects and spheres for each organ j (NUVj) was calculated as Eq. 5where
  is the uptake in organ j of sphere s in subject p for 1 replicate. This quantity was not averaged across all replicates because each bootstrapped replicate was derived from the same dataset (37).
2. The statistical variability of sphere uptake across the 60 bootstrapped replicates, expressed as the percentage coefficient of variation and averaged across all subjects and spheres for each organ j ( ), was calculated as
 Eq. 6where NUVj(r,s,p) is the uptake in organ j of sphere s in subject p for replicate r.
3. The variability of sphere uptake across sphere locations for the 6 spheres in each organ j of a subject, averaged across all subjects ( ), was calculated as
 Eq. 7where
  is the average uptake in organ j of all spheres in subject p for 1 replicate.
4. The variability of sphere uptake across subjects and spheres in each organ j (COVsubj,j) was calculated as Eq. 8where
  is as defined in Equation 5. The same 6 spheres could not be inserted in all subjects because the relative locations of the subjects within the scanner with respect to the sphere positions varied; therefore, the variability across subjects included the variability across location within a subject.
Image noise was calculated as the average statistical noise (across the 60 replicates) for a group of voxels in a large region of interest drawn in the liver. A cylindric region of interest with a diameter of 50–80 mm and an axial length of 7 slices (14 mm) was drawn in the liver for this average.
RESULTS
Average Uptake
Figure 2 shows a typical plot of NUVj(1,s,p) as a function of image noise for the 6 spheres in the lung and liver of 1 subject with TOF and non-TOF reconstructions. This plot shows the typical variation seen among the 6 spheres in a given subject. As previously noted (10,11,23,39), the rate of convergence was higher with TOF reconstruction than with non-TOF reconstruction; after 5 iterations, the sphere uptake values with TOF reconstruction had largely converged, whereas more iterations were required for some spheres with non-TOF reconstruction to reach convergence. It was also not apparent whether the NUV achieved with non-TOF reconstruction would ever reach the value achieved with TOF reconstruction. The NUV in the liver was higher than that in the lung for both TOF and non-TOF reconstructions, although the spheres were inserted with the same activity ratio with respect to the average whole-body uptake. This difference was a consequence of partial-volume effects because the spillover from the lower activity in the lung did not contribute as much to the VOI as the spillover from the higher activity in the liver.

Sphere NUV [ ] for 1 replicate in 1 subject as function of image noise for each of 6 spheres inserted in lung (A) and liver (B), demonstrating typical variations seen across locations and organs. Solid symbols indicate TOF reconstruction; open symbols indicate non-TOF reconstruction. Each curve represents 1 sphere; data points correspond to each of 20 iterations used.
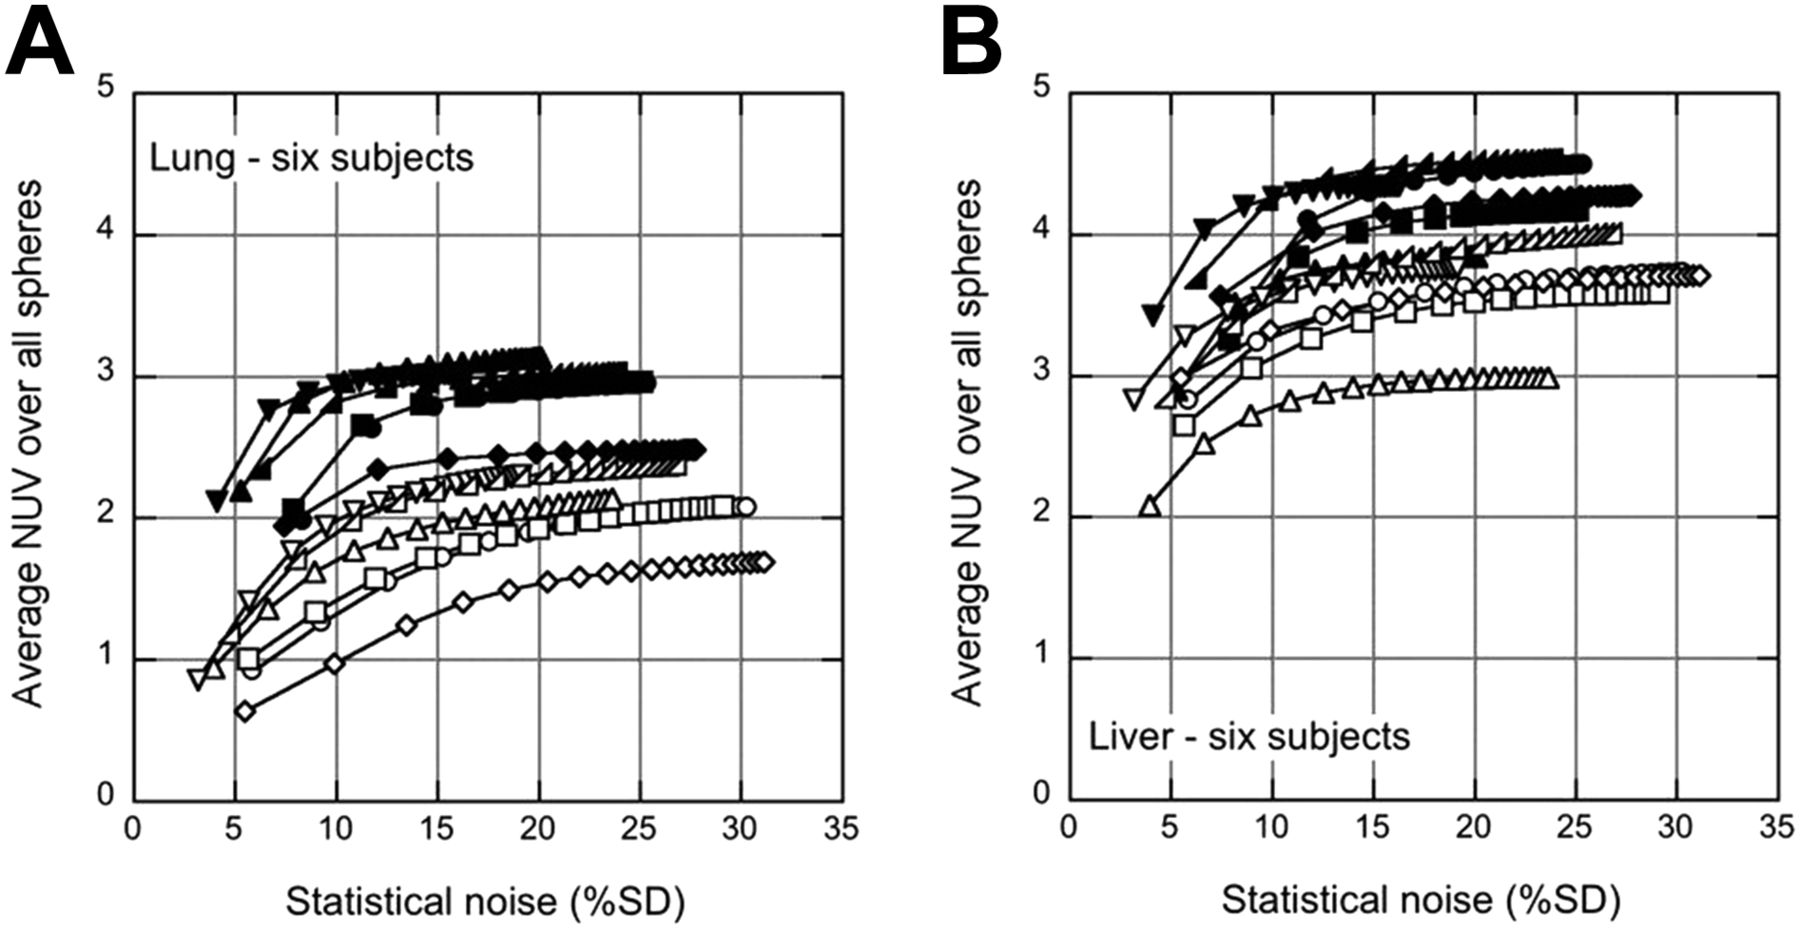
Figure 3 shows  for all 6 subjects as a function of image noise. Qualitatively, the difference in NUV between the liver and the lung appeared to be somewhat smaller with TOF reconstruction than with non-TOF reconstruction; this finding was examined in more detail later. As was observed in the results from 1 subject (Fig. 2), the sphere uptake was higher with TOF reconstruction than with non-TOF reconstruction, and the TOF and non-TOF reconstructions appeared to converge to different values.

Average NUV across all 6 spheres [ ] in given organ for each of 6 subjects as function of image noise in lung (A) and liver (B). Solid symbols indicate TOF reconstruction; open symbols indicate non-TOF reconstruction. Each curve represents 1 subject; data points correspond to each of 20 iterations used.
Variability of Uptake
Figure 4 shows the variabilities of the NUV measurements across replicates ( ), across locations within an organ (
 ), and across subjects (
 ) as a function of iteration for TOF and non-TOF reconstructions. In both the lung and the liver, all variabilities were smaller with TOF reconstruction than with non-TOF reconstruction. The difference in variability between TOF reconstruction and non-TOF reconstruction was also generally larger in the lung than in the liver. By 5 iterations,
  and
and  had converged to within 98% and 92% of their values at 20 iterations in the lung and the liver, respectively, for TOF reconstruction (95% and 92%, respectively, for non-TOF reconstruction); however,
  was slower to converge and continued to increase with more iterations, especially for non-TOF reconstruction.
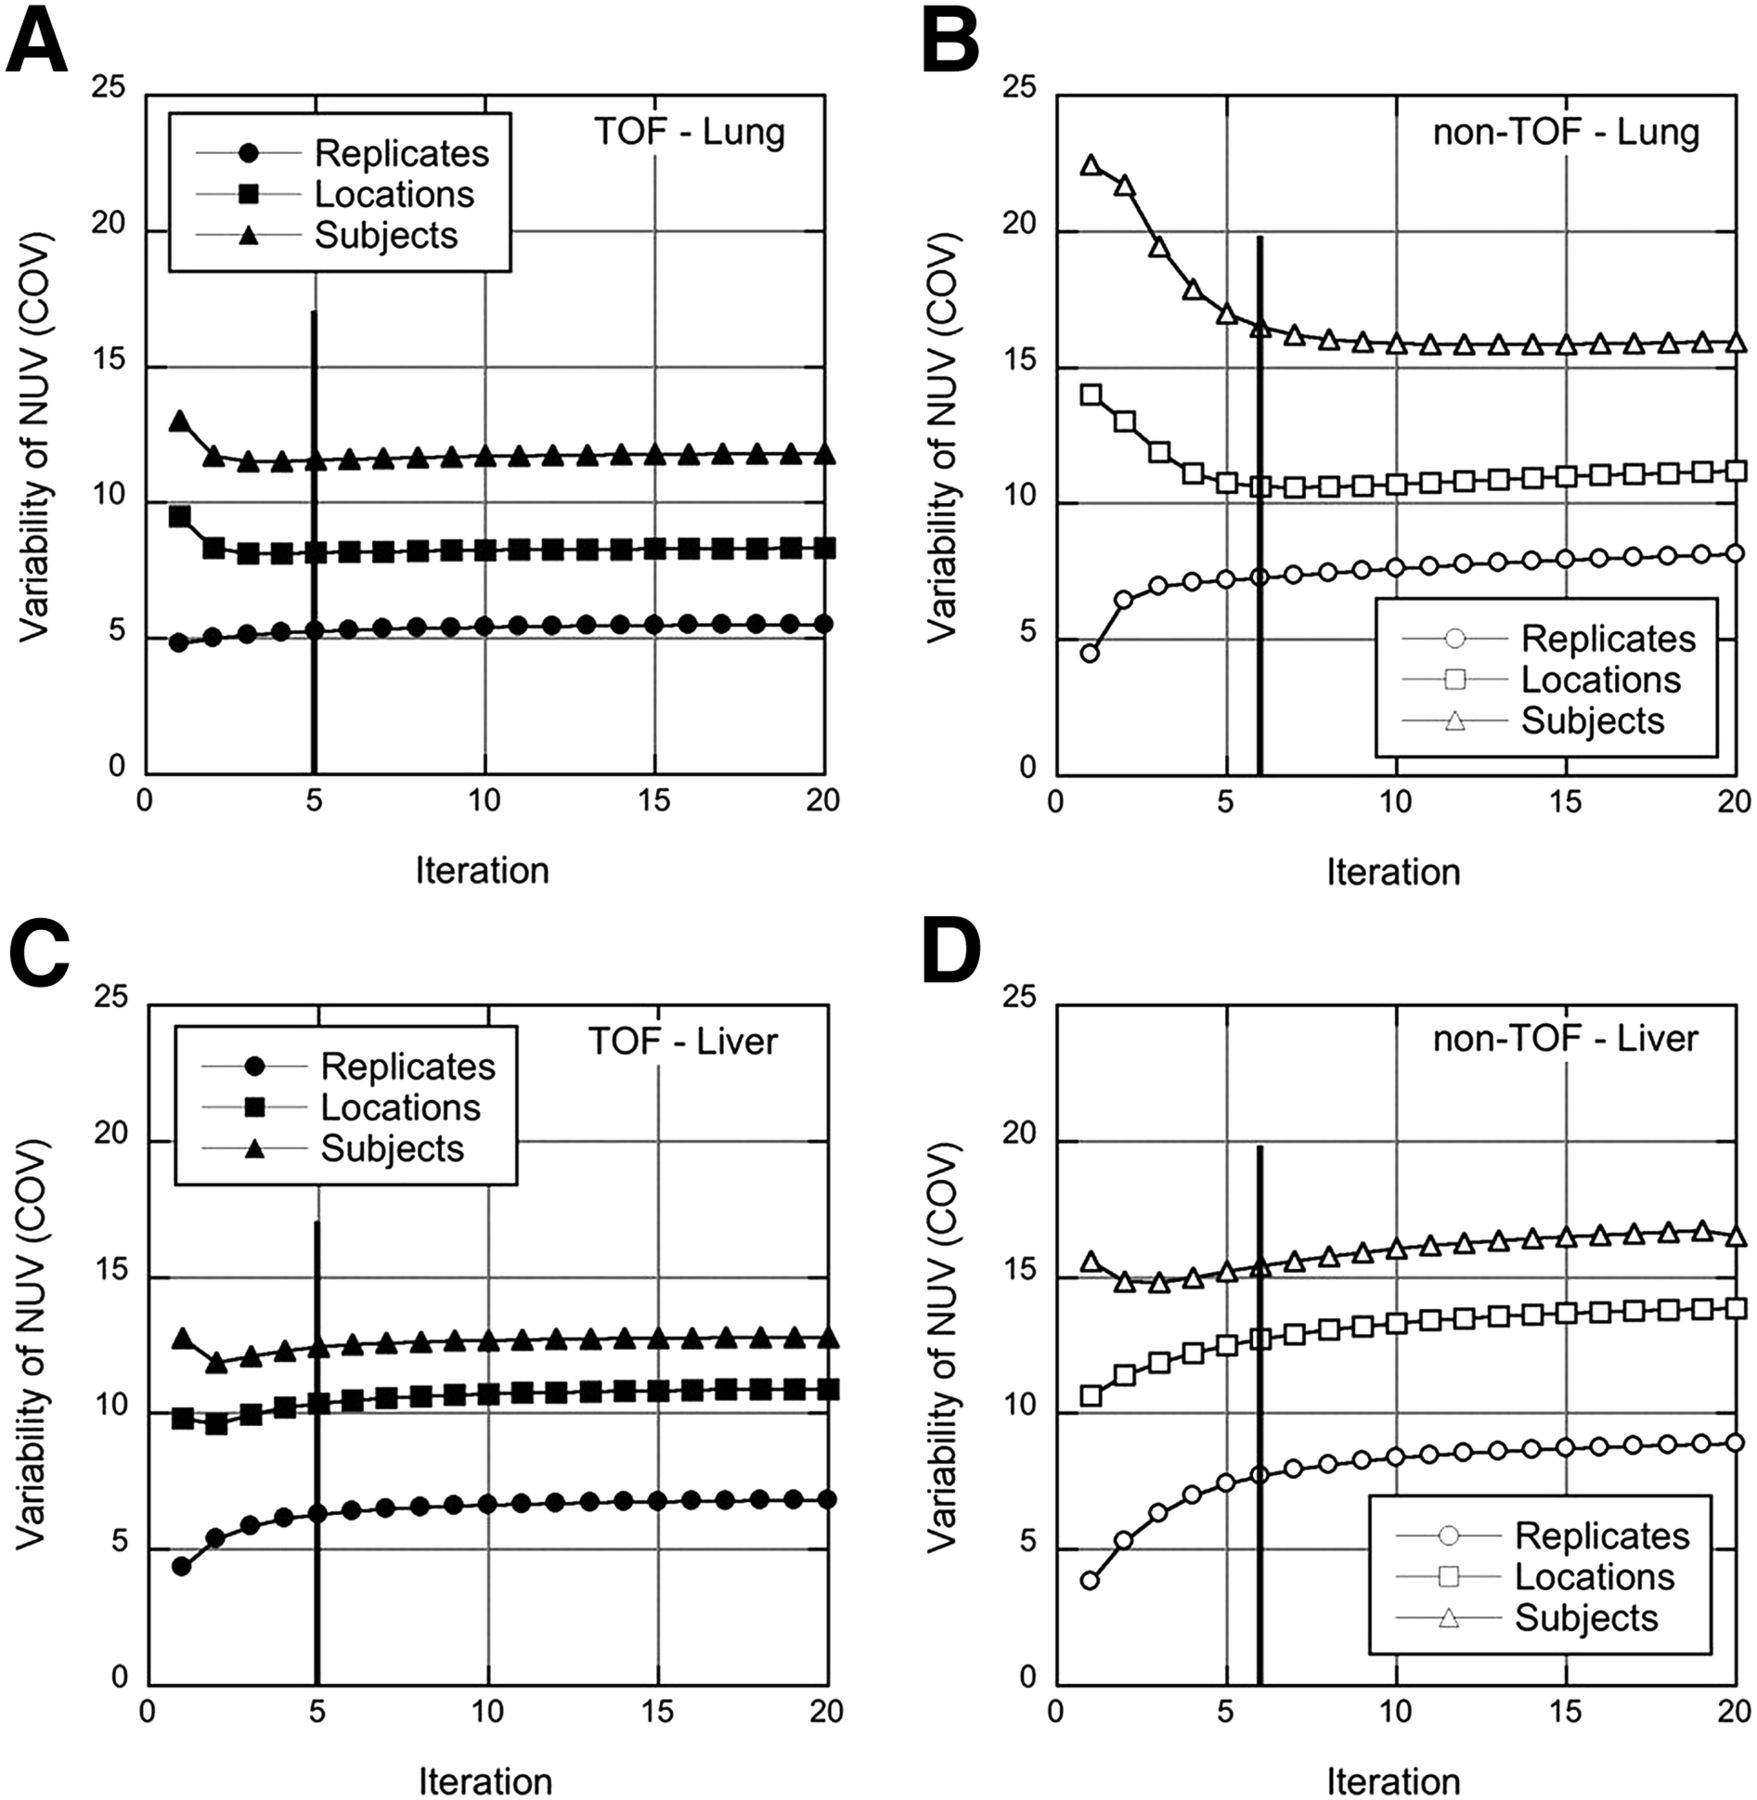
Variability measures for TOF (left) and non-TOF (right) reconstructions of spheres in lung (A and B) and liver (C and D). Variabilities across replicates ( ), across sphere locations within organ (
 ), and across spheres and subjects (
 ) are shown as function of iteration. Vertical lines at 5 TOF iterations (6 non-TOF iterations) indicate points (with similar image noise) at which reconstructions were stopped for subsequent analysis.
Average Uptake and Variability of Uptake for Clinical Reconstructions
Clinical image reconstructions are typically not run to convergence but are stopped after a fixed, smaller number of iterations at which the image noise is sufficiently low for good visual image quality and lesion detection. We stopped the TOF reconstruction after 5 iterations. At this stopping point,  was within 98% of convergence. We stopped the non-TOF reconstruction at a comparable image noise (6 iterations), although it is evident from Figure 3 that
  would be farther from convergence (on average, 92% and 97% of the values at 20 iterations in the lung and the liver, respectively). Figure 5A shows
  achieved in the lung and the liver at this stopping point. The average sphere uptake was higher with TOF reconstruction than with non-TOF reconstruction at matched image noise and was higher in the liver than in the lung. Figure 5B summarizes the variabilities when the reconstructions were stopped early. All variabilities were consistently lower with TOF reconstruction, especially in the lung.

Average uptake and variability at fixed number of iterations and corresponding image noise (5 TOF iterations; 6 non-TOF iterations). (A) Sphere uptake ( ) in lung and liver, averaged across all spheres in all subjects. (B) Variability of NUV measurements across replicates (Repl.) (
 ), across sphere locations (Loc.) (
 ), and across subjects (Subj.) (
 ) for spheres inserted in lung and liver.
DISCUSSION
The present study showed the impact of TOF reconstruction on lesion quantification under clinically realistic but controlled conditions (i.e., known uptake). In contrast to the conditions in previous studies of the impact of TOF reconstruction on lesion uptake measurements (11,14), the uptake in the spheres was known, so quantitative accuracy could be assessed. Further, unlike the conditions in a phantom study, the nonuniform activity and attenuation distributions seen in patient studies were included to create a situation virtually identical to that in clinical settings. Under these conditions, TOF reconstruction led to improved recovery of sphere uptake (higher NUV) with lower variability (higher precision) across replicates, across locations within an organ, and across subjects. We focused on 10-mm spheres at locations dictated by the positions of the liver and the lung inside the scanner, but we believe that the conclusions would be similar for the various lesion sizes or locations seen in clinical settings.
The increase in NUV observed with TOF reconstruction (factors of 1.5 ± 0.1 in the lung and 1.20 ± 0.05 in the liver at 5 TOF iterations) was consistent with the higher contrast recovery observed in clinical studies with lesions having unknown uptake and with the higher contrast recovery seen for spheres in a large, 35-cm phantom (11). It is interesting, however, that the increase in NUV with TOF reconstruction had no obvious correlation with body mass index, although Karp et al. (11) reported a gain in contrast recovery with TOF reconstruction that increased with patient size. In the present work, the lesions were limited to 10-mm-diameter spheres, and the locations of the lesions were restricted to the lung and the liver; in the previous study, data from patients with disease and lesions with unknown uptake, of various sizes, and at various locations throughout the body were used. In addition, the body mass index had a smaller range in the present study (25–38) than in the previous work (19–46). However, the small numbers of subjects in both studies make it difficult to make a definitive statement about the impact of patient size on the accuracy and precision of lesion uptake measurements with TOF reconstruction.
Because the size of the VOIs was equal to the physical inner diameter of the spheres, the measured NUV included partial-volume effects. To minimize these effects, we also determined the maximum uptake in each sphere (NUVmax), which is analogous to the maximum standardized uptake value commonly used in clinical studies, and we repeated the analysis for 2 subjects. Although the NUVmax was higher than the NUV measured in a VOI by an average of 60%, the results were more variable, as would be expected for a single-voxel measurement:  increased by 35%–100%, and
  increased by 10%–80%. However, the relatively higher measured uptake and lower variability obtained with TOF reconstruction than with non-TOF reconstruction for the NUVmax were consistent with the results presented for the VOIs. Further improvement in the accuracy of the uptake measurement could also be achieved through resolution modeling during reconstruction (20–22). However, because convergence is slowed with resolution modeling, variability across locations and subjects may increase.
The difference between liver and lung spheres was smaller with TOF reconstruction than with non-TOF reconstruction. The ratios of the average liver NUV to the average lung NUV were 1.48 ± 0.06 with TOF reconstruction and 1.85 ± 0.08 with non-TOF reconstruction. Some difference between liver and lung sphere VOIs is expected for images without resolution modeling or partial-volume correction because of different amounts of spillover of activity from outside the sphere into the VOI. This effect is reduced with a smaller VOI. However, differences in the rate of convergence of the OSEM algorithm, which depends on the local activity distribution and is less uniform for non-TOF reconstruction, and differences in the sensitivity of TOF and non-TOF reconstruction algorithms to errors in data correction (24,25) may also play roles.
The increase in the NUV with TOF reconstruction was accompanied by a decrease in the variability (improved precision) of the NUV for all 3 variability metrics studied. At 5 TOF iterations, the variabilities in the lung were 20%–30% lower with TOF reconstruction; in the liver, the variabilities were 10%–20% lower. This improvement in precision with TOF reconstruction can lead to increased confidence in uptake measurements for lesions with unknown activity in clinical studies.
Although it is tempting to compare the gain in the NUV with TOF reconstruction and the theoretic metrics of the gain in the signal-to-noise ratio with TOF reconstruction (4–6), we believe that such a comparison is not the right one for these data. The classical TOF gain metrics were derived from an assessment of image noise, with the assumption that the signal is unchanged, at the center of a uniform object for an analytic reconstruction. With a nonlinear algorithm such as TOF OSEM and the nonuniform emission and attenuation distributions in the present study, the gain in the signal-to-noise ratio with TOF reconstruction was more difficult to quantify. In addition, the focus of the present work was the impact of TOF reconstruction on uptake measurements for lesions in a warm background, not image noise reduction.
The present study was performed with a prototype TOF PET scanner with a TOF resolution of less than 400 ps. Although clinical TOF PET scanners currently have TOF resolutions closer to 600 ps, the impact of timing resolution on the accuracy and precision of lesion uptake measurements is a topic of ongoing investigation. Theoretic and simulation studies suggest an improvement in signal-to-noise ratio gain (40) and higher contrast recovery with better lesion detectability (10) at better TOF resolutions. The healthy volunteers included in the present study were also scanned on a TOF PET system with a 600-ps TOF resolution so that a similar analysis can be performed in the future.
CONCLUSION
The present study showed, with clinical data, that the accuracy and precision of lesion uptake measurements were improved with TOF reconstruction. The findings have implications for individual lesion measurements, for which uncertainty is reduced with TOF reconstruction, yielding more reliable results for improved confidence in diagnostic interpretation. By reducing the underlying intersubject variability of lesion uptake measurements, TOF reconstruction also has the potential to reduce the number of subjects needed for clinical trials.
DISCLOSURE
The costs of publication of this article were defrayed in part by the payment of page charges. Therefore, and solely to indicate this fact, this article is hereby marked “advertisement” in accordance with 18 USC section 1734. This project was supported in part by National Institutes of Health grant R01-CA113941, EU FP7 project SUBLIMA (grant 241711), and a sponsored research agreement with Philips Healthcare. The content is solely the responsibility of the authors. No other potential conflict of interest relevant to this article was reported.
Acknowledgments
We thank Matt Werner for development and implementation of the TOF reconstruction algorithm and data processing, Janet Reddin for assistance with acquisition of the healthy volunteer data, Randy Kulp for system setup and calibration, and Anna Fagin and Kara Napolitano for coordinating the healthy volunteer studies.
Footnotes
Published online Mar. 6, 2014.
- © 2014 by the Society of Nuclear Medicine and Molecular Imaging, Inc.
REFERENCES
- Received for publication May 30, 2013.
- Accepted for publication November 1, 2013.


Jump to section
Related Articles
Cited By...
- Total-Body PET System Designs with Axial and Transverse Gaps: A Study of Lesion Quantification and Detectability
- Performance Characteristics of a New Generation 148-cm Axial Field-of-View uMI Panorama GS PET/CT System with Extended NEMA NU 2-2018 and EARL Standards
- Benefit of Improved Performance with State-of-the Art Digital PET/CT for Lesion Detection in Oncology
- Display of 3D Multimodality Cardiac Images With 2D Polar Maps: Simplicity Can Be a Virtue
- Techniques, Benefits, and Challenges of PET-MR
- Improving the Detection of Small Lesions Using a State-of-the-Art Time-of-Flight PET/CT System and Small-Voxel Reconstructions
- Update on Time-of-Flight PET Imaging