


REPLY: We appreciate the opportunity to reply to the letter by Spinelli and Boschi about our recent publication (1). In that pilot work, a high-sensitivity intensified charge-coupled-device camera was used to collect Cerenkov luminescence emitted from lymph node uptake of 18F-FDG in patients after their diagnostic PET/CT scan. The work represented an early result of an ongoing pilot clinical trial of the feasibility of Cerenkov luminescence imaging of 18F-FDG in patients. As noted in the article, this work followed the demonstration by Spinelli et al. (2) of acquisition of Cerenkov luminescence images in a patient after injection of therapeutic 131I for hyperthyroidism.
Several questions were raised about the characteristics of the image-capture device. Further elaboration will help to enable replication of these measurements. A 50-mm Schneider wide-aperture (f/0.95) lens was used with the camera running at a frame rate of 120 frames/s, similar to a list-mode acquisition in nuclear medicine. This method enables software-based real-time removal of frames with γ strikes from the radiopharmaceutical or from extraterrestrial cosmic rays (3), as well as correction for patient movement. The individual frames are then summed to a final image.
The comments on the spectral distribution of the Cerenkov emission from tissue are certainly valid, and we thank the authors for bringing this to our attention. There was an error in the ahead-of-print article (4) that was corrected in the final version of the article (1). At the time of acquiring the data, we found it necessary to suppress a contaminating dim background light and improve the signal-to-noise ratio by using a 605-nm long-pass filter. In fact, in several patients, imaging without the filter was inferior to imaging with the filter because of the additionally captured background signal. We agree that optimization of the imaging system toward the exiting spectrum of the Cerenkov emission will be helpful, and such optimization is currently part of ongoing studies.
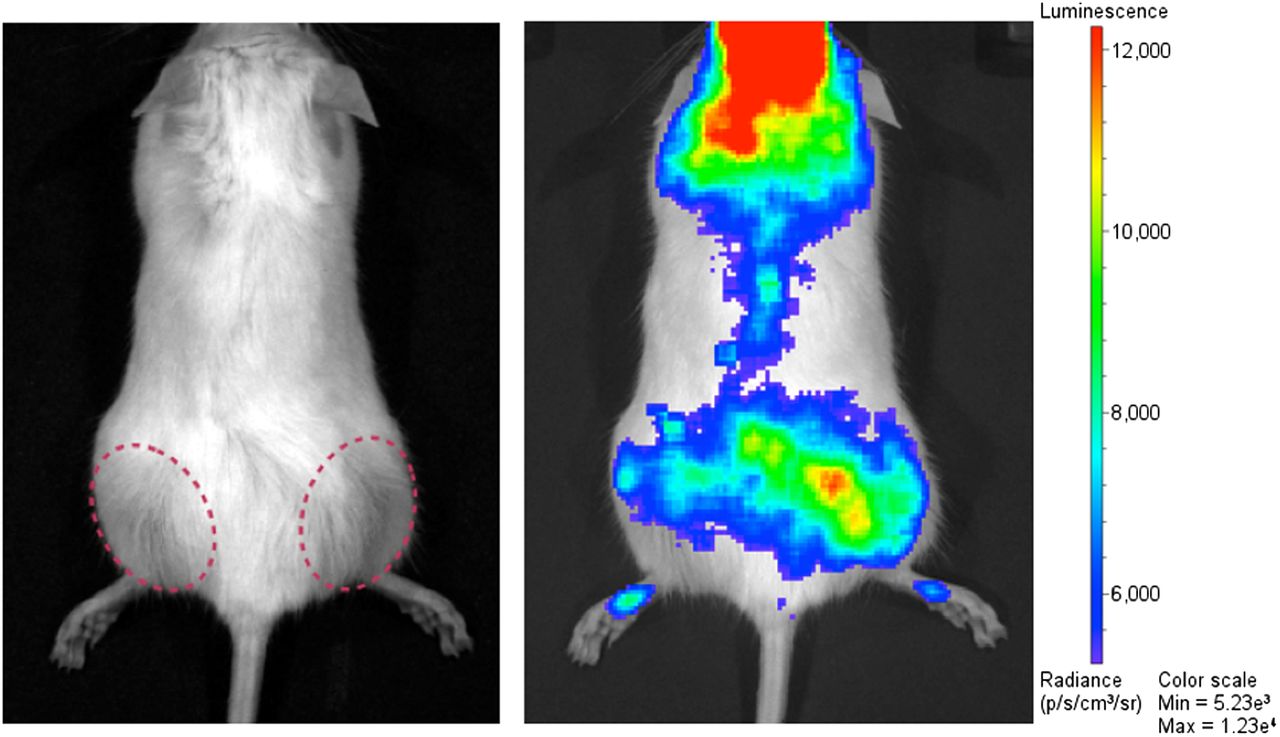
Optical signal through tissue from the Cerenkov spectral domain is strongly attenuated, thus making Cerenkov imaging challenging. We did not, however, experience an issue with the sparse axial hair in this patient, and we were able to detect the low-intensity Cerenkov light. We furthermore tested this issue in a mouse bearing 2 LNCaP tumors on the flanks. Cerenkov imaging was possible without removing the hair (Fig. 1). Although in this case the fur was white, it was certainly much denser than the sparse axillary hair in our example. The linear measurement in our Figure 1, which was criticized by the authors, was performed in a black box at camera and acquisition settings that were different from those of the clinical image, thus accounting for the different appearance of the images. The comparison of the signal-to-noise ratios and imaging performance of different camera types is complex. In contrast to the study of Spinelli et al. (2), we did not use an electron-multiplying charge-coupled-device camera but an intensified charge-coupled-device camera with different performance characteristics.

Cerenkov imaging through hair. Male white SCID mouse was implanted with LNCaP tumors in its flank (dotted red circles). After injection of 18.5 MBq and uptake time of 1 h, 5-min Cerenkov acquisition was performed on IVIS 200 optical in vivo imaging system (PerkinElmer). Cerenkov light is seen originating from tumors (more from larger tumor on right flank of animal; additional signal is originating from retroorbital injection side and bladder between tumors).
It is difficult to comment on the comparison of 18F-FDG and 131I uptake in patients. We were not comparing administered doses but the doses present at the imaged sites. Neither iodine uptake data nor thyroid volume is available for the 131I patient who underwent the Cerenkov scan in the study of Spinelli et al. (2). Assuming a 50% uptake in a hyperthyroid gland, 225 MBq would have been imaged in the thyroid gland. In our axillary lymph node case (Fig. 2 in our article (1)), for example, the node was 7 cm3 in volume (determined from the CT scan) and had an average uptake of 0.03 MBq, resulting in a total of 0.21 MBq. This is a 4-log difference in activity imaged and the order of magnitude we provided. If we account for the difference in β-particle energy introducing a factor of 2.5, we have a 3-log difference (log [110 MBq/0.21 MBq]). We disagree, however, with the statement that “the magnitude of the Cerenkov signal is almost comparable to the contralateral side” since despite the low signal intensity, we find a significant difference (P = 0.02) between the Cerenkov emissions from the PET-positive lymph nodes and the contralateral side (Fig. 2).

Box plot comparing Cerenkov emission (CLI) from pathologic, PET-positive lymph nodes vs. contralateral PET-negative control, demonstrating significantly higher signal from PET-positive side. This graph was included as Figure 3B in the final article.
We firmly believe that both reports of these early findings—the first Cerenkography report (2) and our study on clinical Cerenkov luminescence imaging (1)—complement each other and demonstrate the overall feasibility of clinical Cerenkov imaging with different clinically approved radiotracers, which is the important conclusion of these studies. Larger trials are certainly required to establish the value of this new method in the clinic and to optimize imaging parameters such as the wavelength window, the best radiotracer, and suitable clinical settings.
Footnotes
Published online Jan. 21, 2014.
- © 2014 by the Society of Nuclear Medicine and Molecular Imaging, Inc.


Jump to section
Related Articles
Cited By...
- No citing articles found.