


TO THE EDITOR: In their interesting research, Boktor et al. (1) report variabilities of widely used reference tissue standardized uptake values (SUVs). But underlying causes of these should also be important. A simple 2-random-processes model proposed below supplements the scope of these authors’ research. An excellent feature of the latter is having both same-patient paired data and serial data.
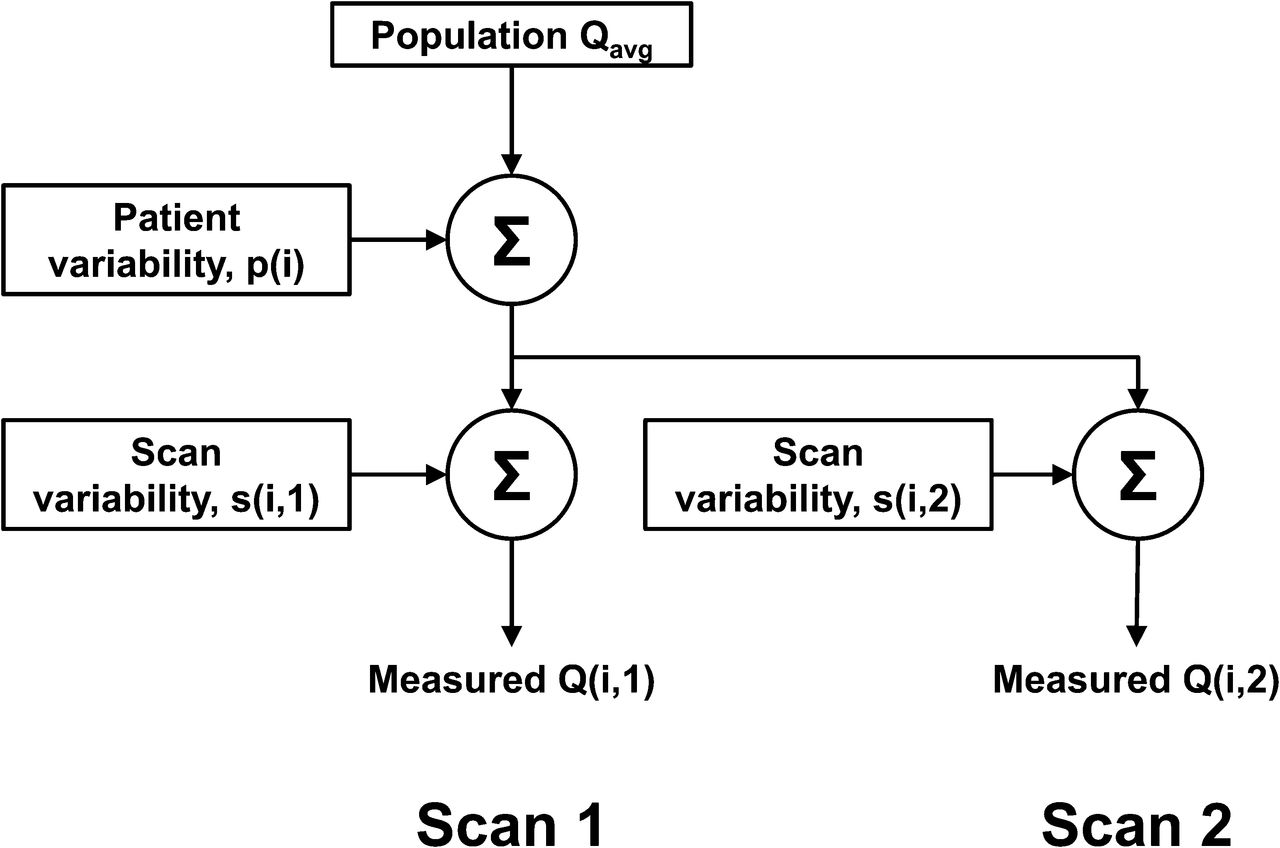
A series of paired (j = 1 and 2) reference tissue SUV measurements in patients i is modeled in Figure 1. Measured results can be algebraically represented as Q(i,j) = Qavg + s(i,j) + p(i). Here, random zero mean s(i,j) represents lumped scan-associated random processes encountered in obtaining the SUV. p(i) represents zero mean lumped patient-to-patient randomness—but having the same value for each within a pair of scans. In this model, the coefficient of variation (COV) for a group of measurements, such as Q(i,1) or Q(i,2), is  . For Q(i,2) − Q(i,1) paired measurements,
  since p(i) is the same in pair i.

Simplified measurement model for serial and paired scans. Scan 1 (or 2) pathway, alone as a sequence of separate patient scans, shows influences of both interpatient and intrapatient (i.e., scan) variability. But if same-patient, that is, paired, scans are also done, then its Q(i,2) − Q(i,1) is influenced only by scan variability.
This model may be applied to a reference blood-pool activity Q having several measurement noise sources. But a dominating one explored here is the variability caused by a substantial imaging time SD of 21.3 min (1) in a busy clinic. Just the scan-encountered variability of Q that this causes may be computed as SDs/Qavg = |dQ/dt| × (21.3 min) ÷ Qavg = |(dQ/dt/Q)| × (21.3 min) = 0.0125 × 21.3 = 0.266. Here, the 18F-FDG instantaneous clearance parameter (a fractional time–activity curve slope), 0.0125 min−1, is an available reported average (2) for a single exponential representation of Q centered on a time of 45 min after injection. Thus, a prediction for a pair of blood-pool scans is  . This may be compared with the direct measurement of Boktor et al. (1), though at an average time of 69.75 min, COVdif = (SD of 0.42)/(Qavg of 1.565) = 0.27.
An expected SDp/Qavg of 0.254 can be computed directly from analytic expressions for 18F-FDG blood-pool time–activity curves of 26 patients (2) evaluated at 69.75 min. This variability is a direct consequence of the fact that the 18F-FDG clearance differs somewhat among patients. Using this and the above SDs/Qavg leads to the expectation: COVgroup = [0.2662 + 0.2542]1/2 = 0.37. For comparison, Boktor et al. (1) directly measure COVgroup = (SD of 0.375)/(Qavg of 1.565) = 0.24.
Curiously, SDs/Qavg = 0.266 and SDp/Qavg = 0.254 are fortuitously almost equal in this example despite unrelated origins. The former depends on customs specific to an institution regarding allowable departures from a nominally desired scan time. The latter on the other hand depends on the average scan time experienced. These two protocol features are used in a model here also having 18F-FDG dynamic behavior parameters from another investigation (2). With customs at other institutions not the same as here, SDs/Qavg and SDp/Qavg would have different values from here.
Model results above would in fact be even slightly higher if other lesser scan measurement noise effects were included. But more importantly, the used 18F-FDG instantaneous clearance parameter at just 45 rather than 69.75 min after injection is known (2) to be significantly too large. Thus, the model overestimates COV as 0.37 versus the directly measured 0.24. A better understanding of variability influences must come from further research. The latter, investigating impacts of imaging time and other effects including scan measurement noise, would logically use appropriate scan durations, and on the same patient group, for all types of data required. Meanwhile, a normal liver reference tissue, also studied by Boktor et al. (1), has an advantage of a time–activity curve known to change very little over the time range in which 18F-FDG imaging typically occurs.
In summary, a simple measurement model is illustrated. When applied to a blood-pool example, important contributions to its SUV variability are imaging time variations regarded as scan effect and variations of the 18F-FDG clearance as an interpatient effect. Although these can have comparable influences, the more important at a particular institution can be determined from model evaluation using its average scan time and associated SD experienced. It is believed that model analyses, more extensive than here, explaining variability can be beneficial and possibly improve quantitative PET investigations. One motivation stems from a model’s ability to identify the dominant features in a protocol that affect a quantifier’s variability. Another could be identifying unimportant protocol features when it could be more economical or clinically convenient to be less stringent, yet with little effect on precision of results.
Footnotes
Published online Dec. 9, 2013.
- © 2014 by the Society of Nuclear Medicine and Molecular Imaging, Inc.


Jump to section
Related Articles
Cited By...
- No citing articles found.