


Abstract
Because of their involvement in growth and survival signaling cascades, the σ1 receptors (σ1Rs) represent a novel target for the treatment of cancer and several brain diseases such as depression and neurodegeneration. From a series of σ1R-specific 18F-fluoroalkylated spirocyclic piperidines, we have chosen 18F-fluspidine for detailed investigation of the in vivo kinetics of the (R)-(+)- and (S)-(–)-enantiomers to identify their potential for imaging in humans. Methods: Enantiopure tosylate precursors for radiolabeling were obtained using chiral preparative high-performance liquid chromatography and used for radiosynthesis of both 18F-fluspidine enantiomers by nucleophilic substitution with K-18F-F-Kryptofix 222-carbonate complex in a synthesis module. Brain pharmacokinetics were investigated by dynamic PET studies in piglets under baseline and blocking conditions using the highly selective σ1R agonist SA4503. Standardized uptake values (SUVs) were calculated for 24 MR-defined brain regions. Total distribution volume (VT) and binding potentials (k3′/k4) of (S)-(–)- and (R)-(+)-18F-fluspidine were estimated. Furthermore, VT values were estimated by graphical analysis using Logan plots. Results: The (S)- and (R)-tosylates were obtained in excellent enantiomeric purities (>98% and >96% enantiomeric excess, respectively). (S)-(–)- and (R)-(+)-18F-fluspidine were synthesized within approximately 70 min (radiochemical yield, 35%–45%; specific activity, 650–870 GBq/μmol; radiochemical purity, >99%). Both radiotracers displayed different brain uptake kinetics. Although the initial brain uptake was similar, the SUV at the end of the study differed significantly (P < 0.05), with (R)-(+)-18F-fluspidine showing about 60%–150% higher values. Administration of SA4503 reduced SUV almost equally for both radiotracers by approximately 65%. Furthermore, k3′ was significantly decreased under blocking conditions in almost all regions ((S)-(–)-18F-fluspidine, −90%–95%; (R)-(+)-18F-fluspidine, −70%–90%) whereas effects on k4 differed according to the particular brain region. VT estimated by both graphical analysis using Logan plots and full nonlinear kinetic analysis revealed significant inhibition for both radiotracers under blocking conditions. Conclusion: Both (S)-(–)- and (R)-(+)-18F-fluspidine appear to be suitable for σ1R imaging in humans. The different pharmacokinetics of (S)-(–)-18F-fluspidine and (R)-(+)-18F-fluspidine may have the potential for application in the diagnostics of different pathologic conditions.
The σ1 receptor (σ1R) is found in almost all tissues but predominantly expressed in the endocrine, immune, and nervous systems (1). Accordingly, there is evidence of σ1R agonists’ therapeutic potential in various neuropsychiatric diseases (supplemental data [available at http://jnm.snmjournals.org]), vascular diseases, and cancer (2).
Several brain-related pathologies are characterized by a decrease in the density of σ1Rs. A reduction of 26% in postmortem 3H-1, 3 di-o-tolylguanidine (DTG) binding studies was detected in the hippocampus of Alzheimer's patients (3), and in vivo 11C-SA4503 imaging studies demonstrated a reduction of at least 25% in the regions of interest in both Parkinson's and Alzheimer's patients (4,5). Also, σ1Rs might be implicated in the mechanisms of action of selective serotonin reuptake inhibitors. σ1Rs modulate depression-related processes such as the serotonergic neurotransmission in the dorsal raphe nucleus (6). Antidepressants such as fluoxetine, fluvoxamine, or imipramine present high to moderate affinity for the σ1R (affinity constant [Ki], 20–200 nM) (7). Repeated treatment with imipramine or fluoxetine and dl-pentazocine, a classic σ1R ligand, caused a decrease of σ1R density in the striatum, hippocampus, and cerebral cortex of rats (8,9).
The most widely investigated σ1R ligands for PET imaging belong to piperazines or piperidines such as 18F-1-(3-fluoropropyl)-4-[4-cyanophenoxy)methyl]piperidine (FPS), N-18F-4′-fluorobenzylpiperidin-4yl-(2-fluorophenyl) acetamide, 18F-fluoromethyl (FM)-SA4503, and 11C-SA4503 as well as 18F-labeled benzamides (references are provided in the supplemental data). 18F-FPS and 18F-FM-SA4503 were initially validated as suitable PET tracers; however, the uptake of 18F-FM-SA4503 radiometabolites in the brain and the unfavorable brain pharmakokinetics of 18F-FPS hinder evaluation of central σ1Rs. Accumulation of radioactivity in the skull of squirrel monkeys indicates unfavorable defluorination of the novel 18F-labeled benzothiazolone 18F-6-(3-fluoropropyl)-3-(2-(azepan-1-yl)ethyl)benzo[d]thiazol-2(3H)-one (FTC)-146 (10).
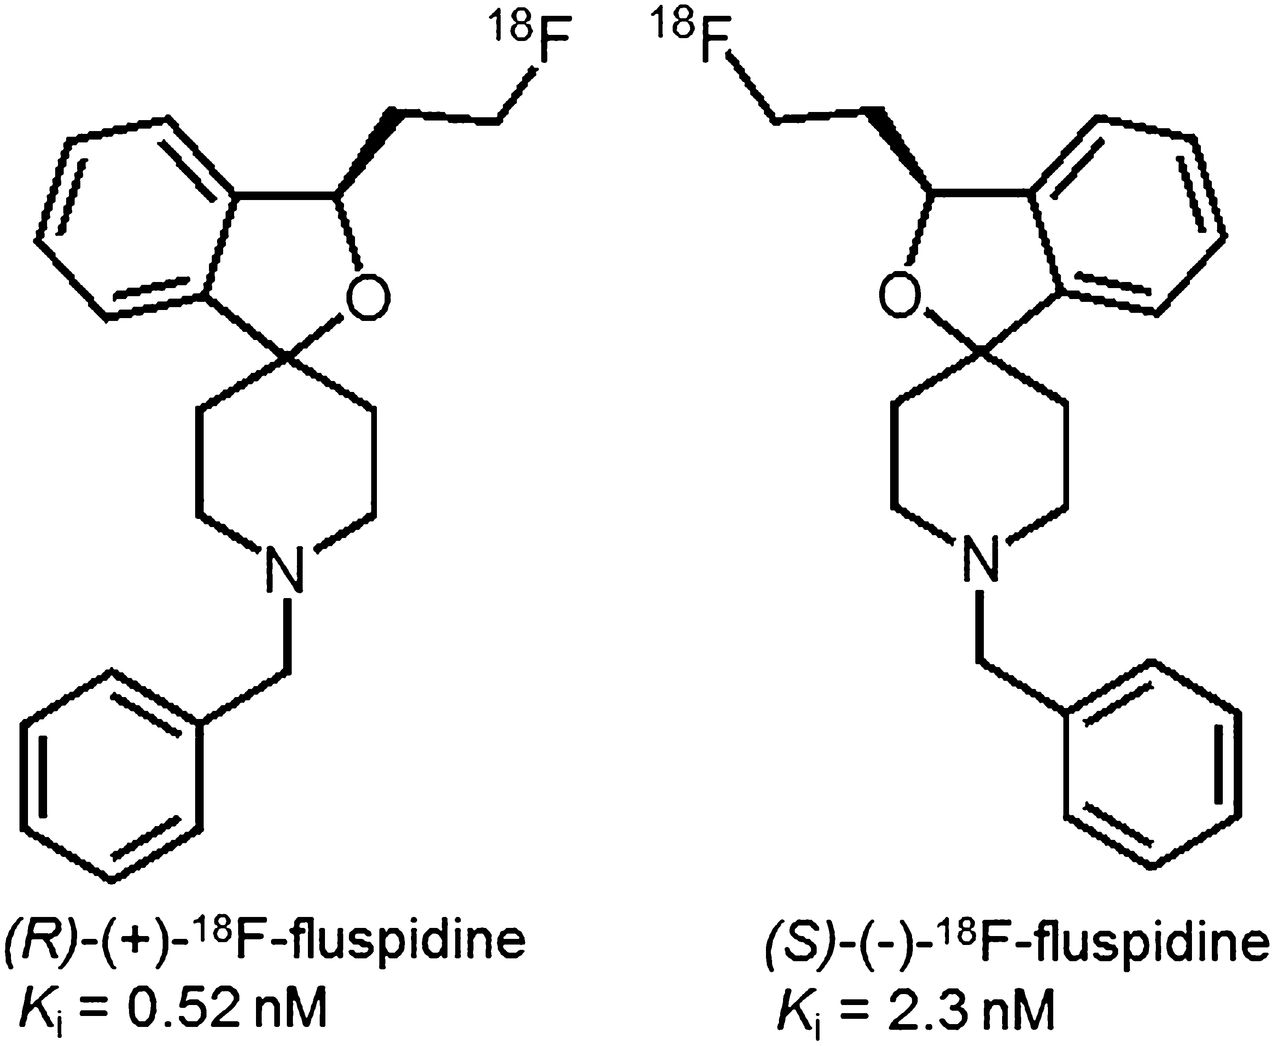
We have recently synthesized 4 series of spirocyclic benzofurans (11–14) and selected 4 derivatives (Ki = 0.59–1.4 nM) for 18F labeling and evaluation as PET tracers (13–16). Although all appear to be applicable for neuroimaging of σ1Rs, a 2-fluoroethyl homolog, named 18F-fluspidine, was most suitable (2). For further preclinical evaluation, an automated synthesis has been developed (17). Racemic fluspidine has been separated, and although the (R)-(+)-enantiomer (Ki = 0.57 nM) showed higher affinity than the (S)-enantiomer (Ki = 2.3 nM), the (S)-(–)-enantiomer appeared to be metabolically more stable (18). To test the hypothesis that both 18F-fluspidine enantiomers are suitable for neuroimaging of σ1Rs with PET, we comparatively assessed brain pharmacokinetics and specific binding of (R)-(+)- and (S)-(–)-18F-fluspidine in the brain by dynamic PET studies in piglets under control and blocking conditions.
MATERIALS AND METHODS
Synthesis of Radiotracers
The radiosynthesis of (R)-(+)- and (S)-(–)-18F-fluspidine (later termed (R)- and (S)-18F-fluspidine; Fig. 1) was performed on a TRACERlab FX F-N synthesizer (GE Healthcare) according to a recently established procedure (17). Briefly, (R)- and (S)-18F-fluspidine were radiolabeled in 15 min at 85°C starting from the corresponding enantiopure tosylate precursor obtained by separation of the racemic tosylate precursor by semipreparative chiral high-performance liquid chromatography (HPLC) on immobilized cellulose-tris-(3,5-dimethylphenyl)-carbamate as stationary phase. Radiotracers were purified by semipreparative reversed-phase HPLC and finally formulated via solid-phase extraction (specific activity, 650–870 GBq/μmol).

Chemical structures of the two enantiomers of 18F-fluspidine.
Confirmation of the enantiomeric purity is provided in the supplemental data.
PET
All procedures involving animals were performed following national regulations for animal research (Landesdirektion Sachsen, TVV 22/10). Twelve female piglets (Naima × Pietrain [Agrargenossenschaft Grossdalzig], 14 ± 1 kg, 6 wk) were used. They were deprived of food but not water 24 h before delivery to the laboratory. Animals were prepared and anesthetized as described in the supplemental data.
Each radiotracer ((R)-18F-fluspidine, 333 ± 47 MBq, n = 3; (S)-18F-fluspidine, 353 ± 57 MBq, n = 3) was infused as a smooth bolus of 10 mL of saline into the left jugular vein over 2 min. Additional animals (n = 3 per tracer) received an administration (3 mg/kg at 10 min before radiotracer + 1 mg/kg/h intravenously) of the highly selective σ1R agonist SA4503. Dynamic PET imaging (240 min; 39 frames) was performed with an ECAT EXACT HR+ (CTI/Siemens) scanner (supplemental data). Arterial blood samples (∼50) were collected in intervals between 15 s and 30 min, plasma was obtained by centrifugation (15,000 rpm), and aliquots were counted in a cross-calibrated γ counter (1470 Wizard; PerkinElmer). Eight additional plasma samples were obtained for HPLC analysis of radiometabolites (details are provided in the supplemental data).
Data Analysis and Model Description
Standard procedures were used for data analysis and compartmental modeling (details are provided in the supplemental data). Because the F test and Akaike information criterion clearly revealed the preference of the 2-tissue- over the 1-tissue-compartment model, only the former data are reported. The rate constants K1, k2′, k3′, and k4 were estimated, and the total distribution volume (VT = [K1/k2′][1 + k3′/k4]) = nondisplaceable distribution volume (VND) + specific distribution volume (VS), the VS (= [K1/k2′][k3′/k4]), and the binding potential (BPND) (=k3′/k4) were calculated. The graphical analysis was obtained by Logan plot using metabolite-corrected plasma data with t* values fixed at 15 min for (S)- and 70 min for (R)-18F-fluspidine. Data from enantiomer-specific control and blocking studies were compared and statistical significance taken as a P value of less than 0.05 (Student t test, two-tailed, unpaired).
RESULTS
Coronal, transversal, and sagittal PET images of two porcine brains acquired at 20 min after injection of (S)-18F-fluspidine are presented in Figure 2. Activity distributions without (control; upper) and with the coadministration of SA4503 (blocking; lower) are represented in the figure. The decrease of standardized uptake values (SUVs) under blocking conditions (∼50%) throughout the whole brain indicates almost ubiquitous expression of σ1Rs.
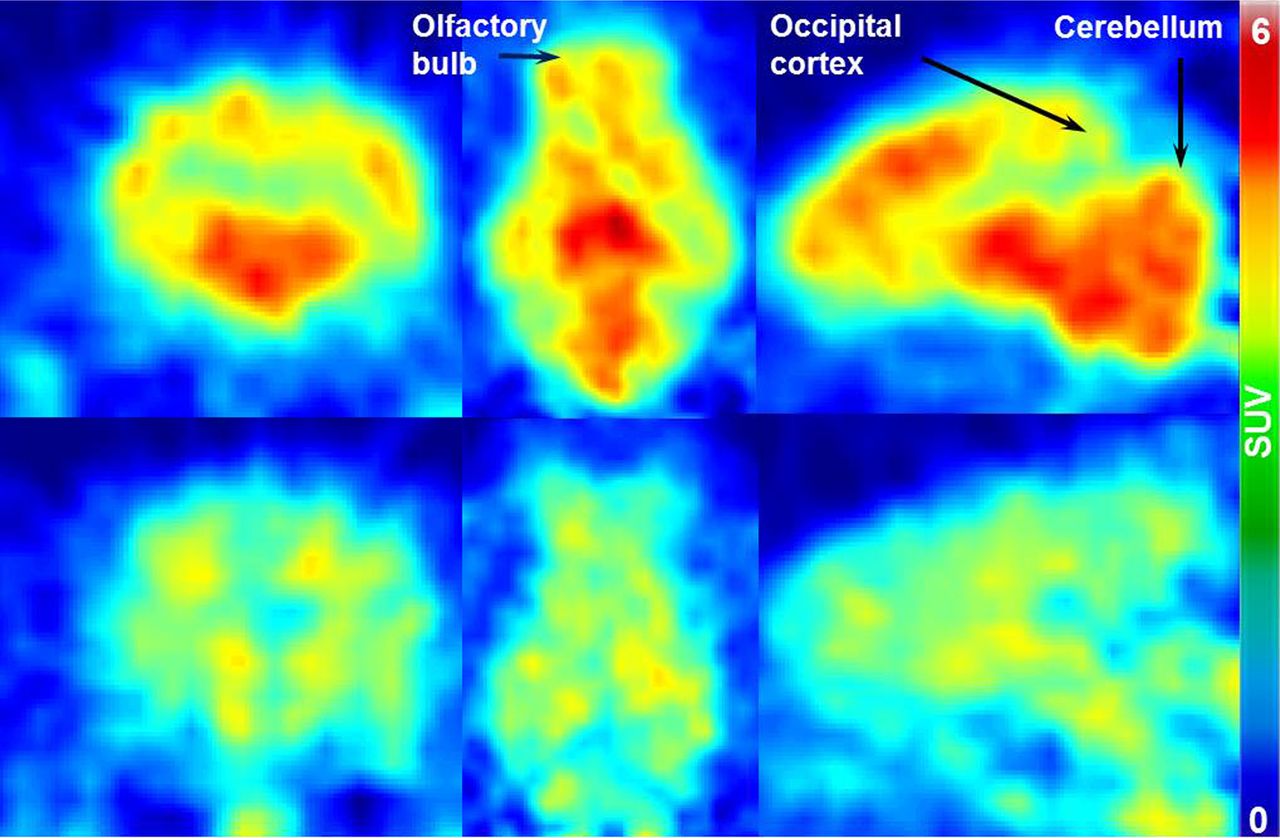
Coronal, transversal, and sagittal (left to right) PET images of two porcine brains, showing distribution of (S)-18F-fluspidine in baseline (upper) and blocking conditions with SA4503 (lower) at 20 min after injection.
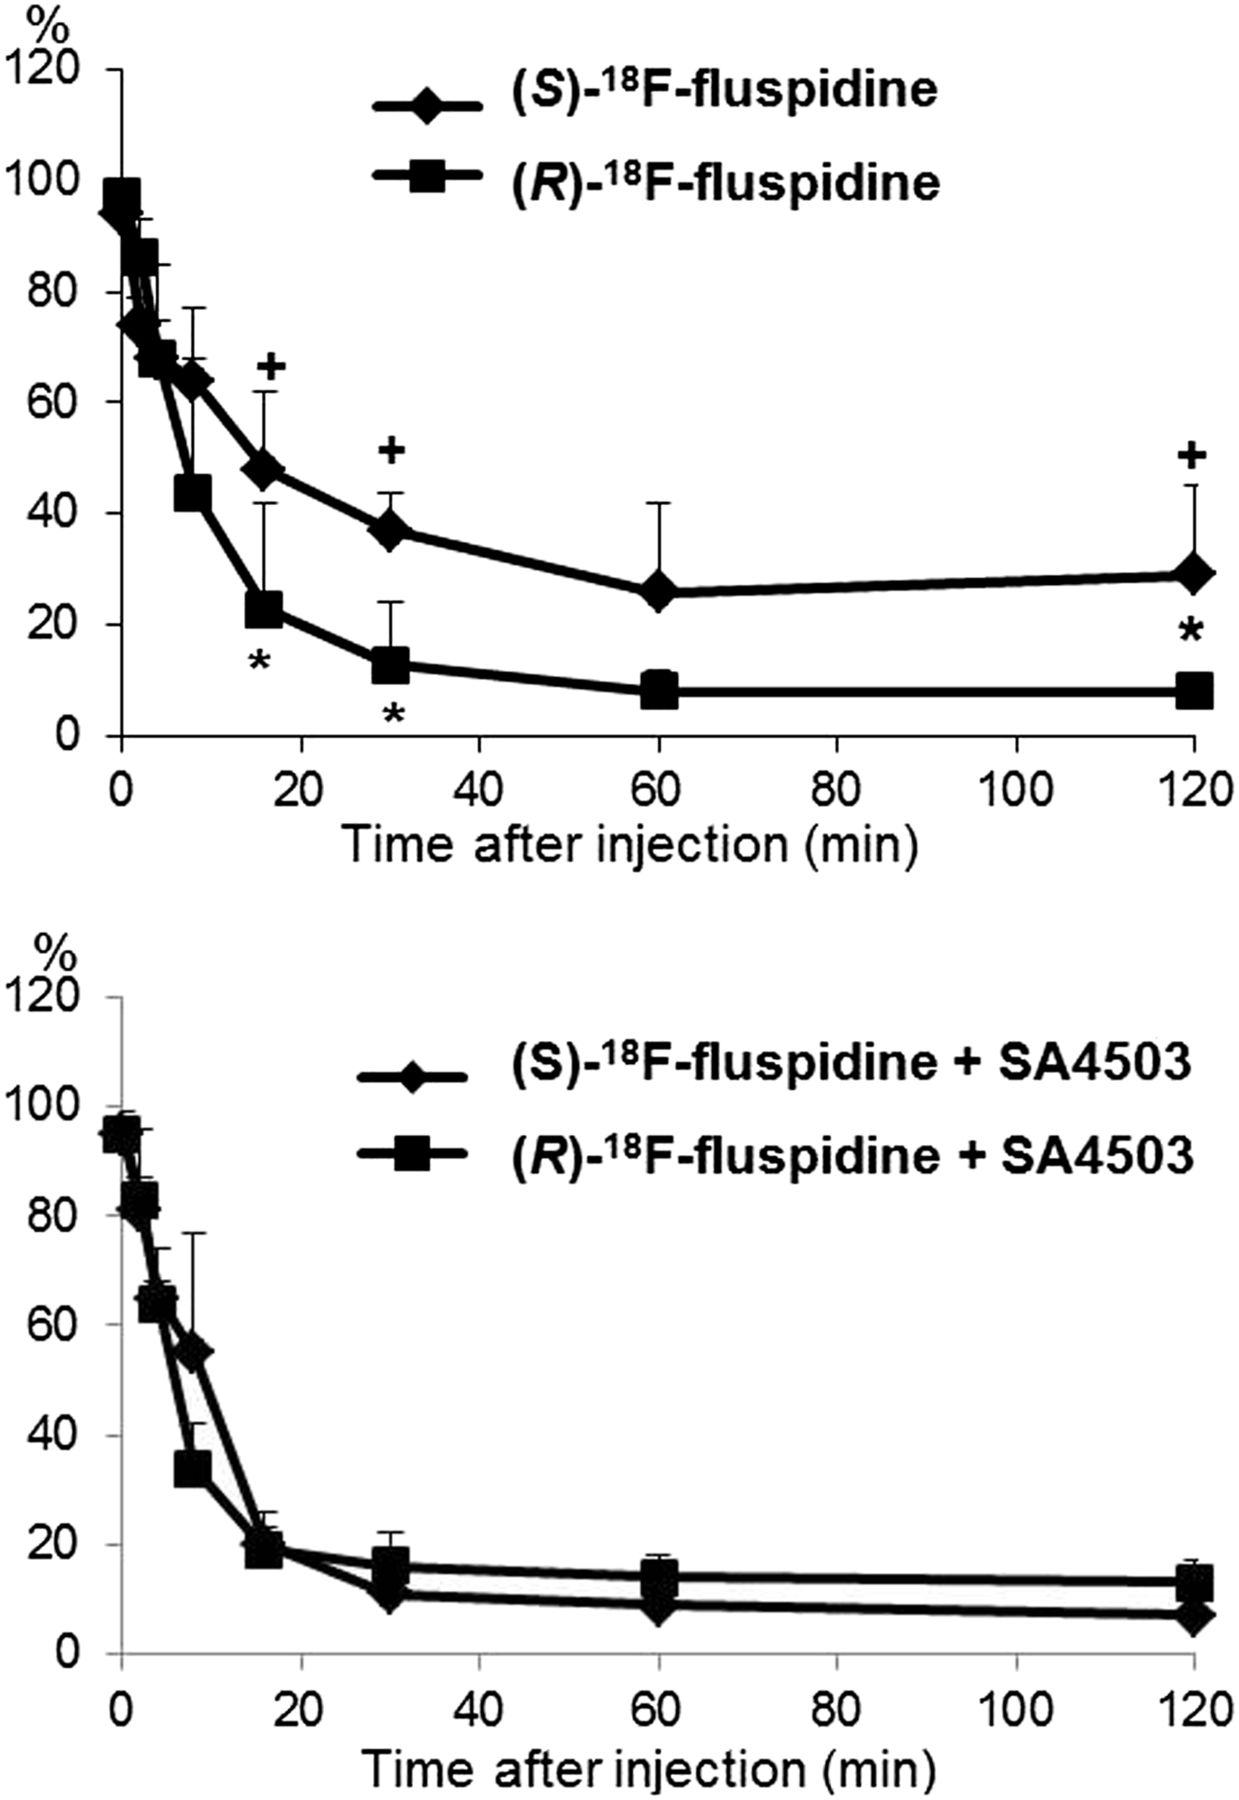
The metabolic profiles of both radiotracers are similar, and no evidence for lipophilic radiometabolites was obtained (Supplemental Fig. 3). The metabolism of (S)-18F-fluspidine is significantly slower than that of (R)-18F-fluspidine (Fig. 3), which explains at least partially the significant differences in the plasma input functions (Supplemental Fig. 1). Furthermore, in contrast to (R)- the metabolism of (S)-18F-fluspidine was significantly accelerated after administration of SA4503.

Metabolism of parent compounds. Percentage of unchanged (S)-18F-fluspidine and (R)-18F-fluspidine in porcine plasma dependent on time after injection under baseline (upper) and blocking conditions with SA4503 (bottom) (mean ± SD; *P < 0.05 (S)-18F-fluspidine vs. (R)-18F-fluspidine; +P < 0.05 (S)-18F-fluspidine + SA4503 vs. (S)-18F-fluspidine).
The time–activity curves obtained after administration of (S)-18F-fluspidine and (R)-18F-fluspidine reveal enantiomer-related differences in brain uptake kinetics (Fig. 4). Although the initial brain uptake is similar for both enantiomers, the SUVs at the end of the study differ significantly, with (R)-18F-fluspidine having about 60%–150% higher values in various regions. The administration of SA4503 significantly reduced these SUVs, almost equally for both radioligands (~65%). This finding is confirmed by the results of the kinetic modeling.
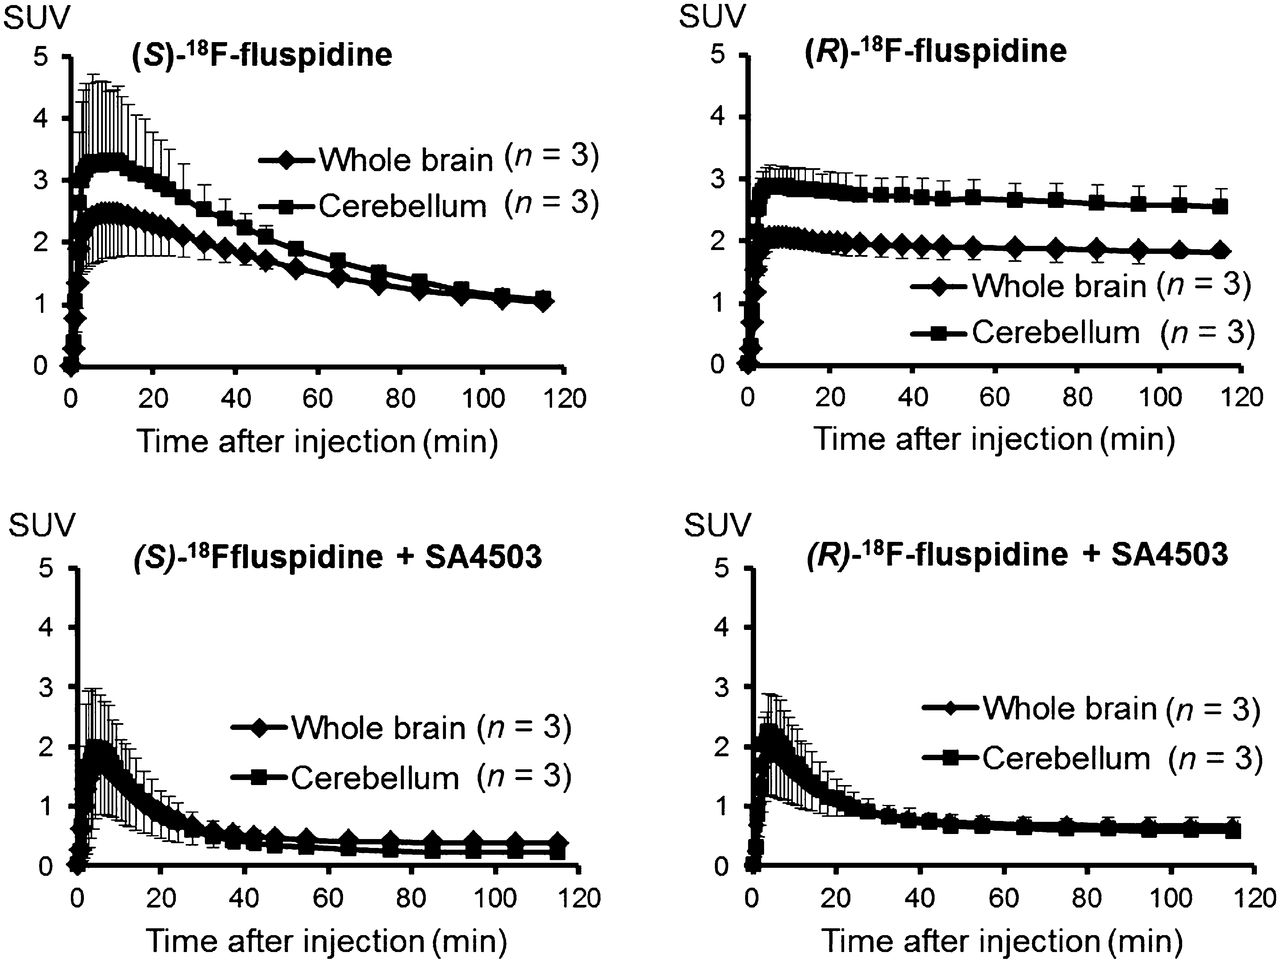
Time–radioactivity curves obtained for whole brain and cerebellum. Data represent SUVs obtained at different times after injection of (S)-18F-fluspidine or (R)-18F-fluspidine under baseline (upper) and blocking conditions with SA4503 (bottom) (mean ± SD).
The rates of blood–brain transfer for (S)- and (R)-18F-fluspidine are shown in Tables 1 and 2. The influx rate constant K1 and the clearance rate constant k2′ of both enantiomers do not differ significantly under control conditions. Surprisingly, the administration of SA4503 significantly reduced the K1 of (S)-18F-fluspidine by about 33%–56% in various regions, whereas the K1 of (R)-18F-fluspidine was similarly reduced but did not reach the level of significance because of large interindividual variability.
Comparison of K1 and k2′ of (S)-18F-Fluspidine Under Control and Blocking Conditions
Comparison of K1 and k2′ of (R)-18F-Fluspidine Under Control and Blocking Conditions
Tables 3 and 4 show the BPND values calculated for (S)- and (R)-18F-fluspidine without and with the administration of SA4503. Although the mean BPND of (S)-18F-fluspidine is about 80%–90% lower than that of (R)-18F-fluspidine, significant differences were detected only in the frontal cortex, olfactory bulb, and colliculi. Notably, the difference in BPND of both radiotracers is mainly determined by a highly significant difference in k4. In comparison to (R)-18F-fluspidine, the k4 of (S)-18F-fluspidine is about 20-fold higher, whereas k3′ is only about 3-fold higher. SA4503 significantly decreased k3′ in almost all investigated regions ((S)-18F-fluspidine, −90%–95%; (R)-18F-fluspidine, −70%–90%), but the effects on k4 depended on the particular brain region. For both enantiomers, subcortical regions were considerably less affected ((S)-18F-fluspidine, −90%; (R)-18F-fluspidine, −30%–60%) than cortical regions ((S)-18F-fluspidine, −30%–60%; (R)-18F-fluspidine, +0%–100%). Accordingly, significant decreases in BPND of both enantiomers were found only in subcortical regions such as the striatum, thalamus, colliculi, and midbrain.
BPND (=k3′/k4) of (S)-18F-Fluspidine Under Control and Blocking Conditions
BPND (=k3′/k4) of (R)-18F-Fluspidine Under Control and Blocking Conditions
Table 5 presents the whole-brain distribution volumes of the various compartments for all investigated conditions. In accordance with the previous findings, VT of (S)-18F-fluspidine is significantly lower than that of (R)-18F-fluspidine, and VT of (R)-18F-fluspidine was significantly inhibited by SA4503.
Distribution Volumes of (S)-18F-Fluspidine and (R)-18F-Fluspidine in Whole Brain
Highly significant correlations were observed between the VT values for (S)- and (R)-18F-fluspidine obtained by Logan plot (Supplemental Table 1) and nonlinear analyses (Fig. 5).
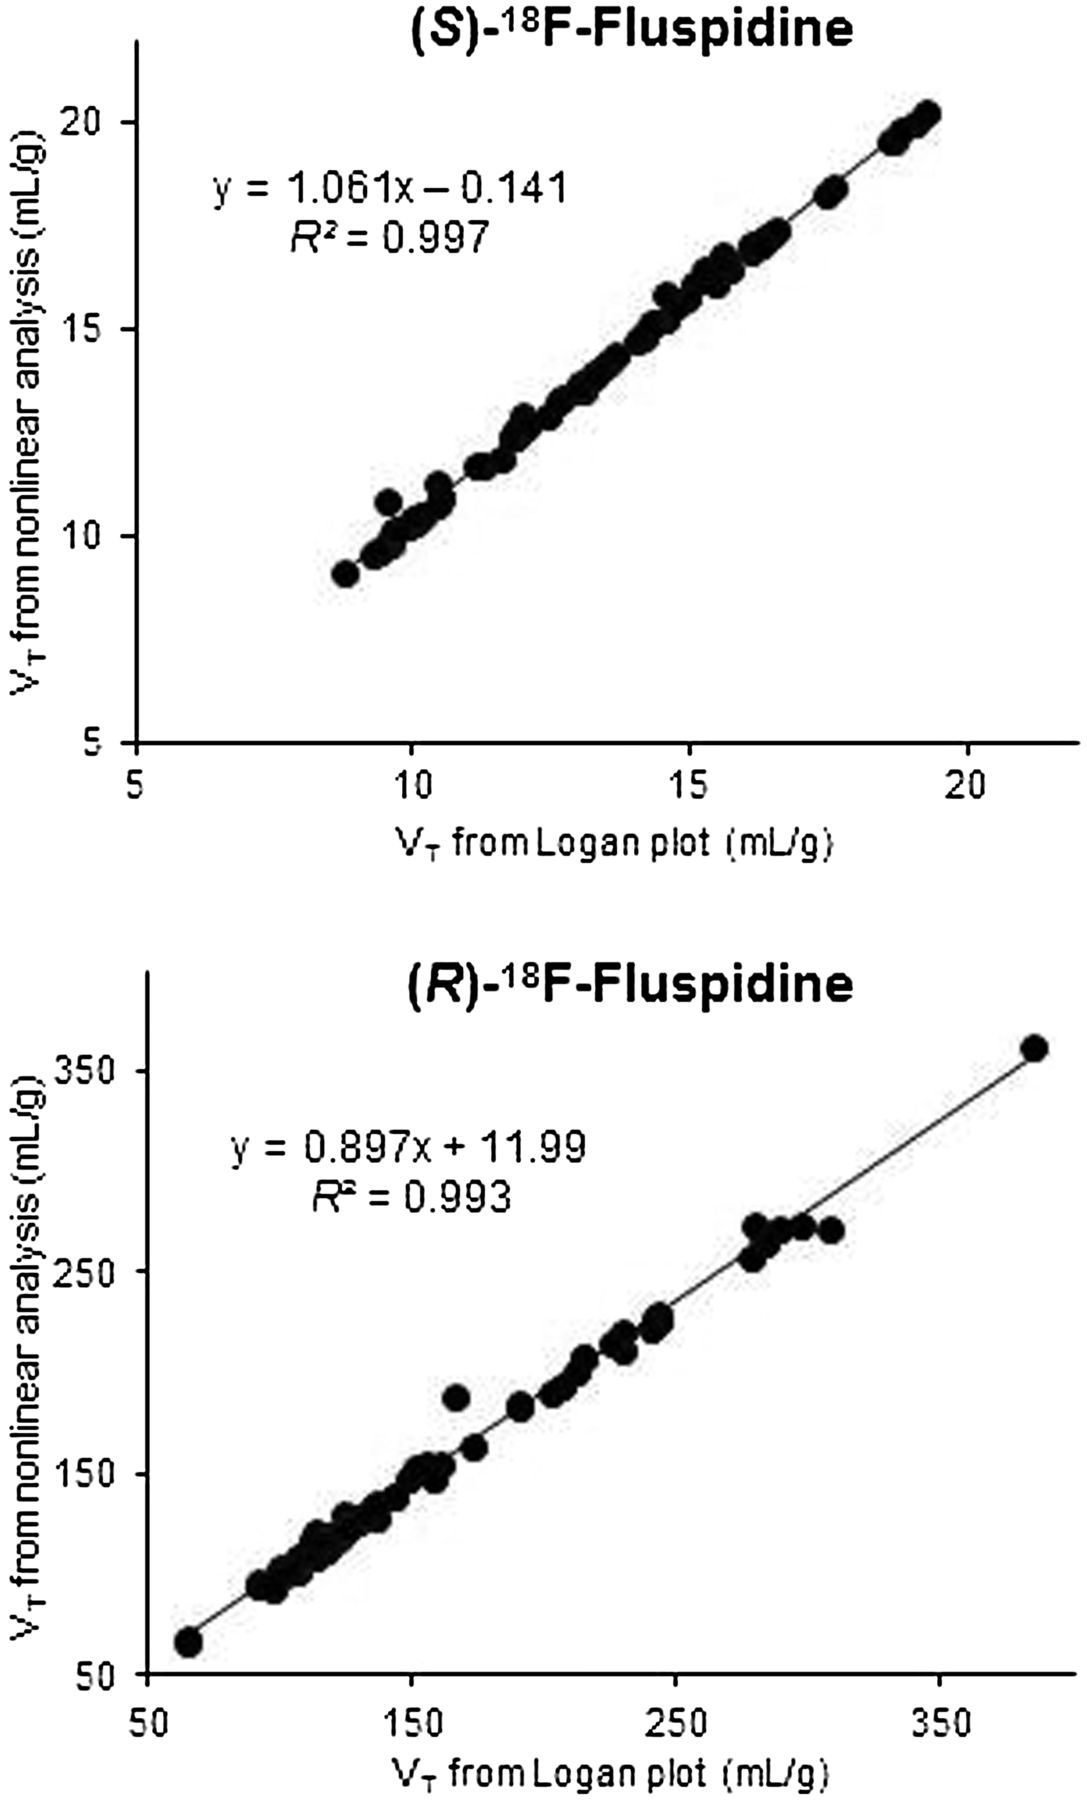
Linear correlation of values of VT estimated for (S)-18F-fluspidine (upper) and (R)-18F-fluspidine (bottom) by compartment model analysis and Logan plot analysis. Values from all control subjects for all regions of interest are plotted.
DISCUSSION
The current study demonstrates the suitability of both (S)-18F-fluspidine and (R)-18F-fluspidine to specifically detect σ1Rs in porcine brain by PET, thus offering two novel 18F-labeled radioligands with potential to assess σ1Rs also in humans.
This conclusion is derived from the following observations: both radioligands show a pattern characteristic for brain distribution of σ1Rs; sufficiently high-activity uptake in the brain (SUV ∼3–4), which can be blocked by the specific σ1R ligand SA4503 by about 65%; and SA4503-induced inhibition of the association rate constant k3′ of receptor binding by more than 70%.
Racemic 18F-fluspidine shows a high selectivity for the σ1R over the σ2R (1,300-fold), the vesicular acetylcholine transporter (2,400-fold), the emopamil binding protein (360-fold), and further off-target proteins (>600-fold) (16). By contrast, nonnegligible affinity (50 nM) of SA4503 to the vesicular acetylcholine transporter has been observed (19). Considering the importance of cholinergic innervation in the regulation of cerebral circulation, we assume an anticholinergic effect of SA4503 on cerebral blood flow to explain the reduced blood–brain transfer (K1) of (S)-18F-fluspidine and (R)-18F-fluspidine in porcine brain detected under blocking conditions.
Fast metabolism of 11C-SA4503 (74% metabolized at 15 min after injection in cats) (20) was originally regarded as a disadvantage. The present study shows that (R)-18F-fluspidine is metabolized in pigs to almost the same extent (∼77% metabolized at 16 min after injection). However, (S)-18F-fluspidine is significantly more stable (52% metabolized at 16 min after injection), suggesting stereospecific metabolism as previously shown for other drugs (21). Furthermore, metabolism in humans may differ from animals, as reflected by a considerably lower metabolism of (+)-18F-FMe-McN5652 in humans in comparison to pigs (22).
In conformity with various kinetic models used to quantify σ1R availability by 11C-SA4503 PET (2), we applied full kinetic analysis for fitting a 2-tissue-compartment model to the dynamic PET data to determine BPND and VT of (S)-18F-fluspidine and (R)-18F-fluspidine. The reference tissue model is not applicable because σ1Rs are present in all brain regions (23).
In comparison to the values reported for 11C-SA4503 in humans (24), (S)-18F-fluspidine possesses lower and (R)-18F-fluspidine higher BPND and VT values. Regarding the two novel tracers, VT values obtained from full kinetic and Logan plot analyses are highly correlated, indicating the applicability of both radioligands for clinical imaging, although graphical analysis points to differences in t* as start time for linearization (25). A shorter equilibration period of (S)-18F-fluspidine and significantly higher k4 values in comparison to (R)-18F-fluspidine support the clinical applicability of (S)-18F-fluspidine due to shorter scanning times. We would like to point out the differences in BPND, a function of the affinity constant of the PET tracer (KD), and the receptor density (Bmax), with 5- to 10-fold higher values of the (R)-enantiomer in comparison to the (S)-enantiomer. As Bmax of a particular receptor has to be assumed to be independent from the receptor-specific PET tracer under investigation, this discrepancy may be related at least partially to the 4-fold-higher affinity toward σ1R of (R)-fluspidine in comparison to (S)-fluspidine (18). Besides, endogenous compounds interacting with the steroid-binding component of σ1Rs (details are provided in the supplemental data) could affect the lower-affine (S)-18F-fluspidine more than the higher-affine (R)-18F-fluspidine.
Highly specific binding of both tracers as demonstrated by inhibition of the PET signal with SA4503 (64% and 89% for (S)- and (R)-18F-fluspidine, respectively) indicates that both (S)-18F-fluspidine and (R)-18F-fluspidine have potential for quantitative neuroimaging of σ1Rs in human studies. For example, comparison of BPND for σ1Rs by 11C-SA4503 PET revealed a 55% reduction in the thalamus of patients with Alzheimer's disease in comparison to healthy controls (4) and a 30% reduction in the more affected than in the less affected side of the anterior putamen in patients with Parkinson's disease (5) (further details are provided in the supplemental data). Besides, (S)-18F-fluspidine is assumed to be applicable in receptor occupancy studies investigating, for example, the binding of selected selective serotonin reuptake inhibitors toward σ1Rs such as recently shown by PET studies in humans using fluvoxamine. At therapeutic doses, this drug decreased regional BPND values of 11C-SA4503 by up to 35% of the control and occupied up to 60% of the available σ1Rs. This result not only implicates an activity of fluvoxamine at σ1Rs in the mechanisms of the action of this particular selective serotonin reuptake inhibitor (26) but also demonstrates the significance of PET imaging of σ1R in humans for improved understanding of depressive disorders (2).
Altogether, the current preclinical data obtained by comparative PET studies using (S)- and (R)-18F-fluspidine indicate the general suitability of both tracers because specific binding seems to be sufficient to assess the expected changes in receptor availability in different brain diseases. (R)-18F-fluspidine possesses a 4-fold-higher affinity in vitro, which is translated into higher BPND values in vivo; however, longer equilibration periods require longer scanning times. The higher metabolic stability of (S)-18F-fluspidine results in a more reliable estimate of the metabolite-corrected plasma input function required for kinetic modeling of PET tracers for central σ1Rs due to the lack of a receptor-free reference region. For measuring σ1R occupancy by either administered drugs or endogenous ligands, the lower-affine and thus faster dissociating (S)-18F-fluspidine also seems to be more appropriate because of a higher susceptibility to the competitive compounds.
Although (S)-18F-fluspidine is the more suitable enantiomer for imaging of central σ1Rs, for the selection of one enantiomer for diagnostic imaging of peripheral changes in σ1Rs related to pathologic processes, further data on pharmacokinetics in, for example, cancerous tissue may be required.
The concept of in vivo targeting of σ1Rs by molecular imaging with PET has the potential for both drug development and evaluation of potential therapeutics (27), as well as for pathogenesis research and clinical diagnosis.
CONCLUSION
The results of our preclinical study suggest that with (S)-18F-fluspidine and (R)-18F-fluspidine, two novel PET tracers for the noninvasive visualization and quantification of σ1Rs are available. Further experimental data will be required to support the selection of the most appropriate enantiomer of 18F-fluspidine for particular human translation.
DISCLOSURE
The costs of publication of this article were defrayed in part by the payment of page charges. Therefore, and solely to indicate this fact, this article is hereby marked “advertisement” in accordance with 18 USC section 1734. Financial support was obtained from German Research Council (DFG) (STE 601/10-2, WU 176/7-2) and NIH (T32 EB004822). No other potential conflict of interest relevant to this article was reported.
Footnotes
↵* Contributed equally to this work.
Published online Jul. 28, 2014.
- © 2014 by the Society of Nuclear Medicine and Molecular Imaging, Inc.
REFERENCES
- Received for publication January 27, 2014.
- Accepted for publication April 22, 2014.


