


Abstract
Olfactory dysfunction is an early feature of Alzheimer disease. This study used multimodal imaging of PET and 18F-FDG combined with diffusion tensor imaging (DTI) to investigate the association of fiber tract integrity in the olfactory tract with cortical glucose metabolism in subjects with mild cognitive impairment (MCI) and normal controls. We hypothesized that MCI subjects would show loss of olfactory tract integrity and may have altered associations with glucose metabolism. Methods: Subjects diagnosed with amnestic MCI (n = 12) and normal controls (n = 23) received standard brain 18F-FDG PET and DTI with 32 gradient directions on a 3-T MR imaging scanner. Fractional anisotropy (FA) maps were generated. Voxelwise correlation analysis of olfactory tract FA values with 18F-FDG PET images was performed. Results: Integrated analysis over all subjects indicated a positive correlation between white matter integrity in the olfactory tract and metabolic activity in olfactory processing structures, including the rostral prefrontal cortex, dorsomedial thalamus, hypothalamus, orbitofrontal cortex, and uncus, and in the superior temporal gyrus, insula, and anterior cingulate cortex. Subjects with MCI, compared with normal controls, showed differential associations of olfactory tract integrity with medial temporal lobe and posterior cortical structures. Conclusion: These findings indicate that impairment of axonal integrity or neuronal loss may be linked to functional metabolic changes and that disease-specific neurodegeneration may affect this relationship. Multimodal imaging using 18F-FDG PET and DTI may provide better insights into aging and neurodegenerative processes.
Olfactory dysfunction is an early clinical and pathologic feature of Alzheimer disease (AD) and other neurodegenerative diseases such as Parkinson (1–5). In AD, neurofibrillary tangles and neuropil threads appear in the olfactory tract (OT) as early as they do in the entorhinal cortex (6–10). We have published previously age-related axonal transport reductions in the OT using manganese-enhanced MR imaging in rats and in mice with brains transgenically altered to produce AD pathology (11,12). Alterations in axonal integrity of the OT in mild cognitive impairment (MCI) have been described (13); however, it is not known if loss of fiber tract integrity has an association with higher-order cortical neuronal dysfunction nor if specific disease processes such as those found in AD may affect this relationship.
Cortical hypometabolism in AD as imaged by PET and 18F-FDG is a well-characterized feature, which is often referred to as the AD-typical pattern of metabolic deficits (14). In the early 1990s, 18F-FDG PET imaging combined with quantitative voxel-based analytic methods depicted this distinct pattern, including the indication of hypometabolism in the posterior cingulate cortex–precuneus region (15). This AD pattern also includes metabolic deficits of the lateral parietotemporal association cortices and in the frontal cortex, with relative sparing of the primary cortices and subcortical structures. Many researchers have confirmed these findings and have found indications of this metabolic signature before the onset of clinical dementia (16), leading to the conclusion that hypometabolism, particularly in the posterior cingulate cortex, is an early biomarker of AD pathophysiology.
Another key question involves the association between fiber tract integrity and neuronal activity and metabolism. Diffusion tensor imaging (DTI) evaluates the directional diffusion of water molecules in tissue. Within intact white matter tracts, water molecules diffuse more readily along the direction of axonal fibers, and movement is more restricted in the transaxonal directions. Fractional anisotropy (FA) is a measure of the relative diffusion along versus across fiber tracts derived from diffusion tensor images for a particular tract, where values of 0 mean completely isotropic diffusion and, hypothetically, values approaching 1 represent diffusion restricted to just 1 direction (17). Decreased FA values reflect a loss of tract integrity including disruption of axonal structure or myelin loss (18). Studies have indicated decreased FA of specific tracts in both patients with AD and subjects with MCI, possibly reflecting decreased membrane and cytoskeletal integrity before large-scale neuronal loss (19–21). This loss of integrity may result in impaired axonal transport processes, which in turn could result in decreased metabolic function and activity. Because 18F-FDG PET provides a measure of local neuronal activity, particularly at the synapse, loss of integrity in (22) white matter tracts could be associated with decreased 18F-FDG PET signal in connected cortical regions.
In this study, we hypothesized that decreased integrity of OT axons would correlate with hypometabolism in functionally and anatomically connected cortical regions involved in the processing of olfactory input. In addition, we expected that the FA in the OT would be decreased in subjects with MCI, as compared with normal controls, and that subjects with MCI may show differential pattern of hypometabolism associated with the loss of OT integrity.
MATERIALS AND METHODS
Subjects
Subjects were recruited from an ongoing, longitudinal study of aging from the University of Washington Alzheimer Disease Research Center. All subjects underwent clinical evaluations on a yearly basis, although the number of yearly follow-up visits varied across subjects. All normal control subjects (n = 23; 11 men; mean age ± SD, 61 ± 8.4 y) had a Mini-Mental State Examination score of 26–30; a clinical dementia rating score of 0; delayed verbal recall scores of greater than or equal to 1.5 SD below age-adjusted mean scores on the Weschler Memory Scale; and no change in social–occupational functioning that would suggest a decline in cognitive function. A subset of elderly 8 normal control subjects (68 ± 7.0 y) was used for comparisons with the MCI group. Amnestic MCI diagnoses were based on Petersen’s criteria (23). The MCI group was further stratified into 4 subgroups to evaluate OT integrity. The pre-MCI group had a clinical diagnosis that switched between normal and MCI over multiple follow-ups; however, the diagnosis was normal at time of scanning (n = 4; 3 men; mean age ± SD, 83 ± 4.9 y). The MCI group had a clinical diagnosis of MCI at time of scanning and remained MCI in clinical follow-up (n = 7; 6 men; mean age ± SD, 77 ± 7.7 y). There was 1 subject we labeled as MCI-AD who was diagnosed as MCI at time of scanning but progressed to an AD diagnosis on the subsequent clinical follow-up (1 man; age, 77 y). Two of these subjects in the MCI group were included only in the comparison of FA results and not used in the subsequent correlation analysis with the 18F-FDG PET imaging. No subjects had unstable medical conditions (i.e., heart disease, hypertension, diabetes, thyroid disease, cancer within past 2 y), neurologic conditions that could affect cognitive function (e.g., Parkinson disease, stroke, head injury with loss of consciousness over 30 min), or major psychiatric disorders (e.g., psychosis, alcohol or drug dependence, recurrent major depression). All procedures were performed with approval by the University of Washington Institutional Review Board, and all subjects provided written informed consent before enrollment into the study.
Imaging and Image Preprocessing
Standard 18F-FDG PET brain imaging (20-min emission scan and 25-min 68Ge transmission scan for attenuation correction) in an Advance scanner (GE Healthcare) was performed for each subject after the intravenous injection of 370 MBq of 18F-FDG and a 30-min uptake in a quiet room while patients rested with their eyes open. Images were reconstructed to in-plane resolution of approximately 6 mm (full width at half maximum).
Brain MR imaging was performed using a 3-T MR scanner (Achieva Dual Quasar gradient system; Philips) with an 8-channel sense head coil. Each subject underwent an imaging protocol that included T1-weighted scans with a 3-dimensional (3D) magnetization-prepared rapid gradient-echo imaging pulse sequence (repetition time/echo time/flip, 6.6 ms/3 ms/8; acquired voxel size, 1 mm3; inversion time, 850 ms; T1 recovery time, 3 s; sense factor, 2 in slice direction) and axial DTI of the whole brain with 32 gradient directions (voxel size, 10 mm3; b, 1,000s/mm2; repetition time/echo time/flip/number of excitations, 9.609 s/64 ms/90/1; sense factor, 2 in phase direction; echo planar imaging bandwidth, 1,870 Hz).
Diffusion tensor images were processed to generate FA maps (DTIstudio, version 2.30 software; Johns Hopkins University) (24). Resultant FA maps were inspected for eddy current artifacts and distortions (voxels with abnormally high intensity) within the volume of interest (VOI) (OT). Lastly, FA maps were coregistered to T1-weighted images to standardize image matrices and to correct for potential head motion. This step also allowed for more accurate selection of regions of interest (ROIs) on the higher-resolution T1-weighted images. Then, 18F-FDG PET images were anatomically standardized to the human brain atlas (25), pixel intensity was normalized to global cortical activity (set to 1,000), and images were smoothed with a gaussian kernel with σ = 2.25 mm (NEUROSTAT; University of Washington) (26). To detect and AD pattern of hypometabolic deficits, PET images from MCI subjects were processed using data extraction software, 3D stereotactic surface projections (3D-SSP) (27). In this processing step, images from each subject were compared with a standardized normal database of age-matched controls. Patterns of hypometabolism are projected to lateral and medial aspects of the brain for easier identification of specific hypometabolic patterns.
OT FA Values
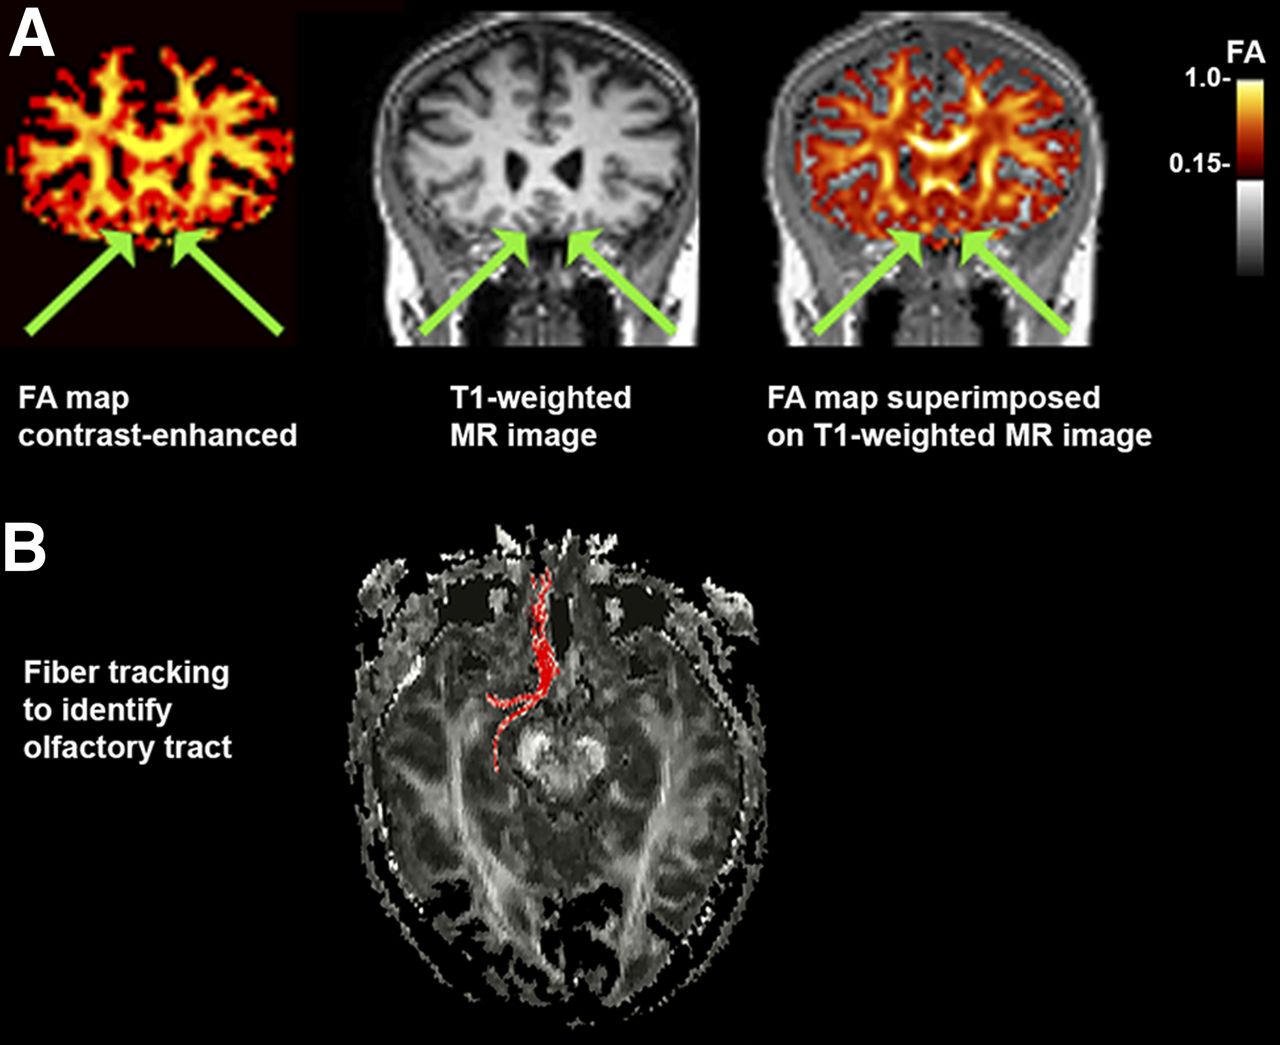
On FA maps, ROIs within the OT were selected manually on images oriented in the coronal plane. T1-weighted images were used to identify the tract, and fiber tracking on DTI was used to confirm that the voxel selection was within the OT (Fig. 1). Values for FA of the right and left OTs were averaged so that each subject had a single value representing OT integrity. Average FA values of the OTs of MCI groups versus normal controls were compared using a 2-sample t test and a general linear model controlling age and sex as covariates because these factors might affect the olfactory functions.

FA image registration and selection of OT ROIs. (A) Example of FA map (color-enhanced to orange scale for better viewing with superimposition) coregistered to T1-weighted MR image in coronal plane. OT is indicated with arrows. (B) In some cases, ROI placement was confirmed with fiber tracking using ROI coordinate as seed point.
Statistical Correlation Mapping
First, to evaluate the association of fiber tract integrity in the OT to cortical metabolism, individual FA values obtained from the ROI analysis were used in a voxelwise correlation analysis of the 18F-FDG PET images over the entire cohort (MCI plus normal controls). Correlation coefficients for each voxel were converted to z scores (Fisher transformation), and peak locations of significant correlations were mapped over the entire brain. Regional metabolic changes at structures depicted by this analysis were measured by VOI analysis and examined using a 2-sample t test and general linear model controlling age and sex as covariates for group differences. Second, we wished to investigate regional metabolic correlations to OT integrity of our normal controls, as compared with MCI subjects with early AD changes. Because the MCI diagnosis was based on clinical evaluation, we would expect a certain degree of heterogeneity of the underlying disease mechanism, and we wished to examine AD-specific correlations of OT integrity with cortical metabolism. We used the 3D-SSP processing described above to generate individual 18F-FDG PET hypometabolic maps, as compared with an age-matched normal database. These maps were evaluated for the presence of known hypometabolic patterns, typical of early AD (hypometabolism in posterior cingulate/precuneous and parietotemporal cortices with relative preservation of primary sensorimotor cortices and subcortical structures). For the resulting pre-AD MCI group (n = 6) and normal controls (n = 23), FA values were correlated to 18F-FDG PET in independent comparisons to investigate AD-specific metabolic changes associated with loss of OT integrity. For all correlation analyses, peaks with z scores of 3.8 or greater were considered statistically significant, controlling the type I error rate approximately at a P value of 0.05 after correction for multiple comparisons based on image smoothness and voxel number (28).
Principal Component Analysis (PCA) Analysis of FA Values and VOI from 18F-FDG PET
To further examine the association of OT FA with posterior cortical metabolism as indicated in our correlation analysis of pre-AD MCI, a separate analysis was performed. Regions from a standardized VOI template for PET brain imaging were sampled in both the anterior and the posterior cingulate cortices of our pre-AD MCI and or normal control groups on individual 18F-FDG PET images and compared with OT FA values. Principal component analysis (PCA) was applied to explore the differential latent association between OT FA and hypometabolism in anterior versus posterior cingulate cortices between these groups using SPSS statistical software (IBM).
RESULTS
OT Integrity Correlated to Glucose Metabolism
We investigated the association between OT integrity (as measured by DTI FA) and cortical glucose metabolism across all subjects (MCI subjects plus normal controls) to reveal the relationship of fiber tract integrity to cortical activity, regardless of the presence of an underlying disease process. Integrated analysis over all subjects indicated a positive correlation between integrity in the OT and metabolic activity in cortical and subcortical structures including the rostral prefrontal cortex (PFC; z = 5.2), dorsomedial thalamus (TH(dm); z = 4.2), hypothalamus (z = 4.1), orbitofrontal cortex (OFC; z = 3.8), and uncus (z = 3.8) that are known to have anatomic connectivity to olfactory input as well as to the superior temporal gyrus (GTs; z = 4.5), insula (z = 4.5), and anterior cingulate cortex (z = 4.4) (Fig. 2). The observed pattern indicated on surface-rendered z score maps of correlated metabolism bears a striking resemblance to a schematic diagram of known OT connectivity (Fig. 3) (29). In addition, VOI analysis in selected structures revealed not only that there was a positive correlation of OT integrity to cortical metabolism but also that MCI subjects showed decreased regional glucose metabolism (mean ± SD, PFC: 1,128 ± 138 vs. 919 ± 92%–18.5%; GTs: 826 ± 121 vs. 686 ± 158%–17.0%; insula: 1,187 ± 117 vs. 1,015 ± 112%–14.5%; TH(dm): 659 ± 179 vs. 406 ± 90%–38.3%; hypothalamus: 604 ± 99 vs. 504 ± 61%–16.6%; OFC: 1,325 ± 83 vs. 1,196 ± 62%–9.7%) (percentage decrease of glucose uptake after global normalization for normal controls vs. MCI subjects, P < 0.05 corrected for multiple comparisons). When a subset of elderly normal controls (n = 8; mean age ± SD, 68 ± 7.0 y) whose age range was closer to that of the MCI group was examined using a multivariate test in a general linear model with age and sex as covariates, regional reductions were significant (P < 0.05), but the effects of age and sex did not reach significance (P = 0.22 and 0.47, respectively).
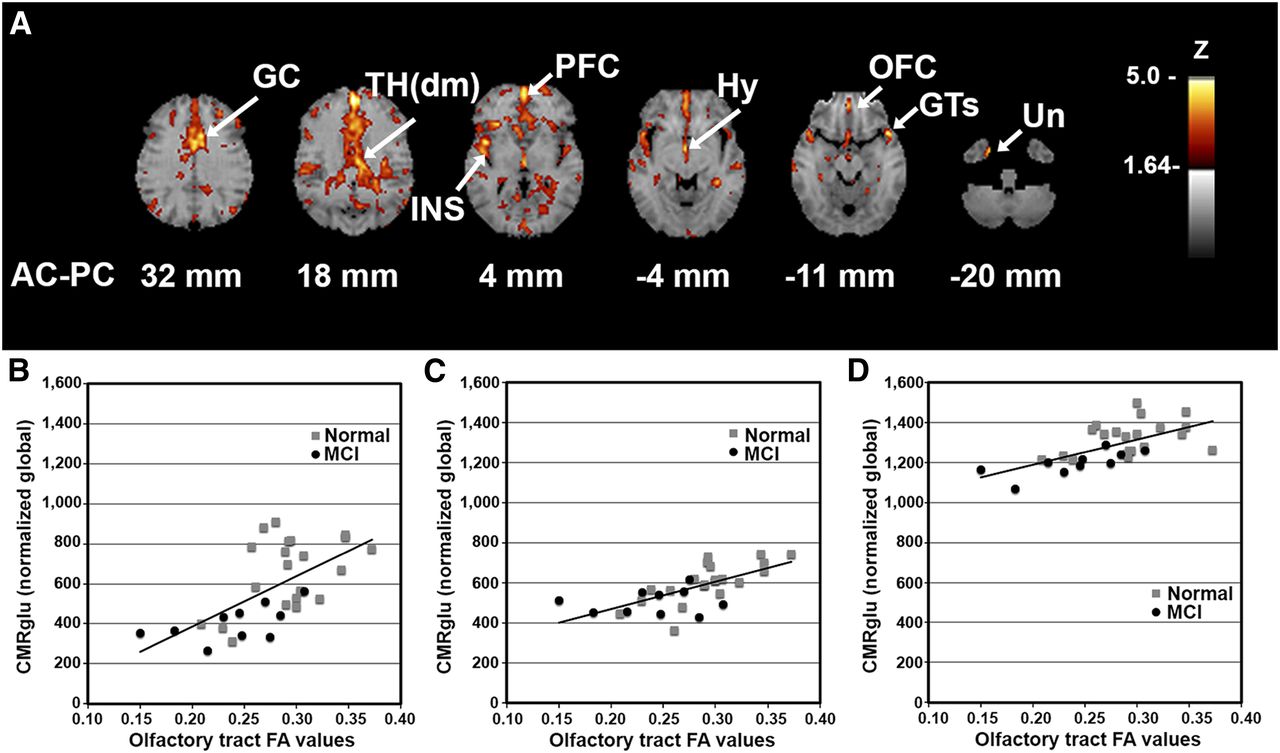
Cortical glucose metabolism associated with OT integrity. (A) Voxelwise linear regression of FA values in OT with 18F-FDG PET images across all subjects (n = 33) reveal significant peaks in structures with anatomic and functional connectivity to olfactory input. Correlation coefficients converted to z score maps and superimposed to structural MR imaging for better localization of peaks. Images are displayed in transverse plane with slice levels indicated according to atlas (25). Significant peaks are as indicated by arrows and labels. (B–D) Scatterplots of individual OT FA values versus regional glucose metabolism (CMRglu) normalized to global values are shown for selected structures: Th(dm) (B), Hy (C), and OFC (D). Although correlation analysis was performed across entire group, normal vs. MCI individual values are indicated by gray squares vs. black circles, respectively. Peaks with z scores ≥ 3.8 were considered statistically significant, controlling type I error rate approximately at P value of 0.05 after correction for multiple comparisons based on image smoothness and voxel number (28). Hy = hypothalamus; INS = insula; Un = uncus.

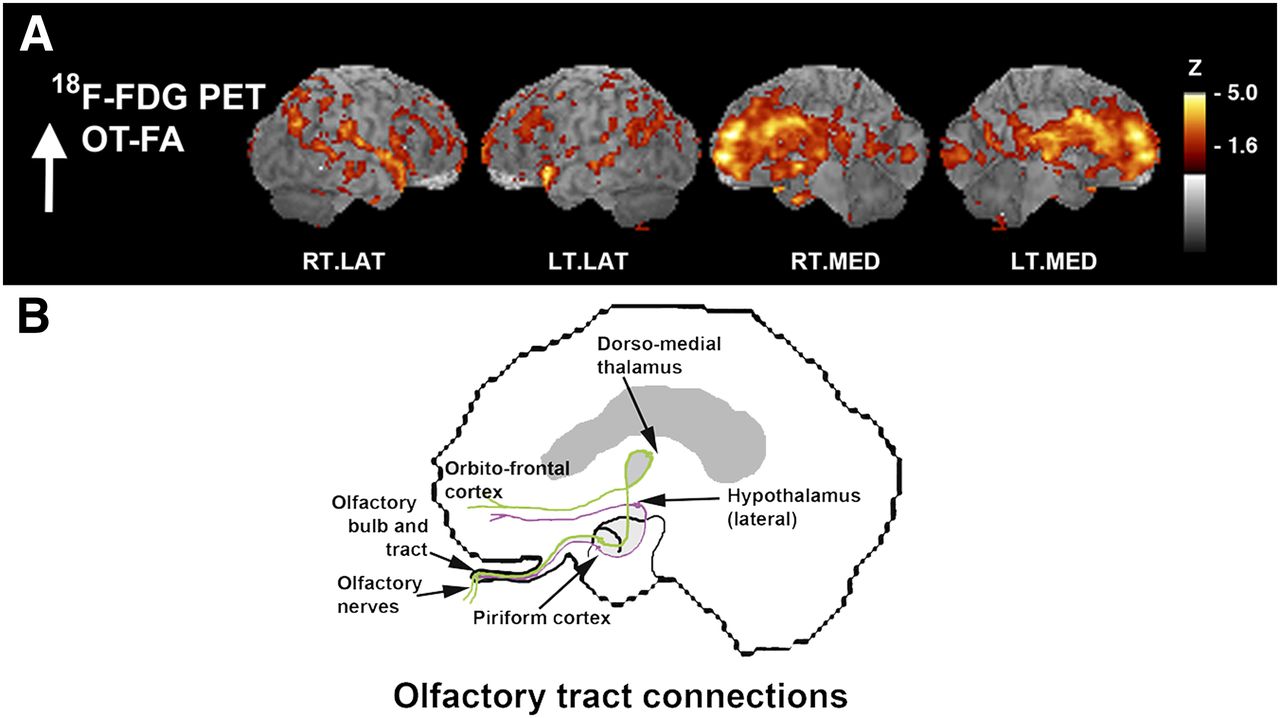
Surface-projected z score maps of glucose metabolism associated with OT integrity to illustrate agreement with olfactory connectivity. (A) Sagittal views, as indicated by z score maps, are superimposed onto structural MR image from analysis indicated in Figure 2. (B) OT connections are indicated in simplified schematic of olfactory system connectivity for reference purposes. Sagittal aspects are noted. RT.LAT = right lateral; LT.LAT = left lateral; RT.MED = right medial; LT.MED = left medial.
Decreased OT Fiber Integrity in MCI
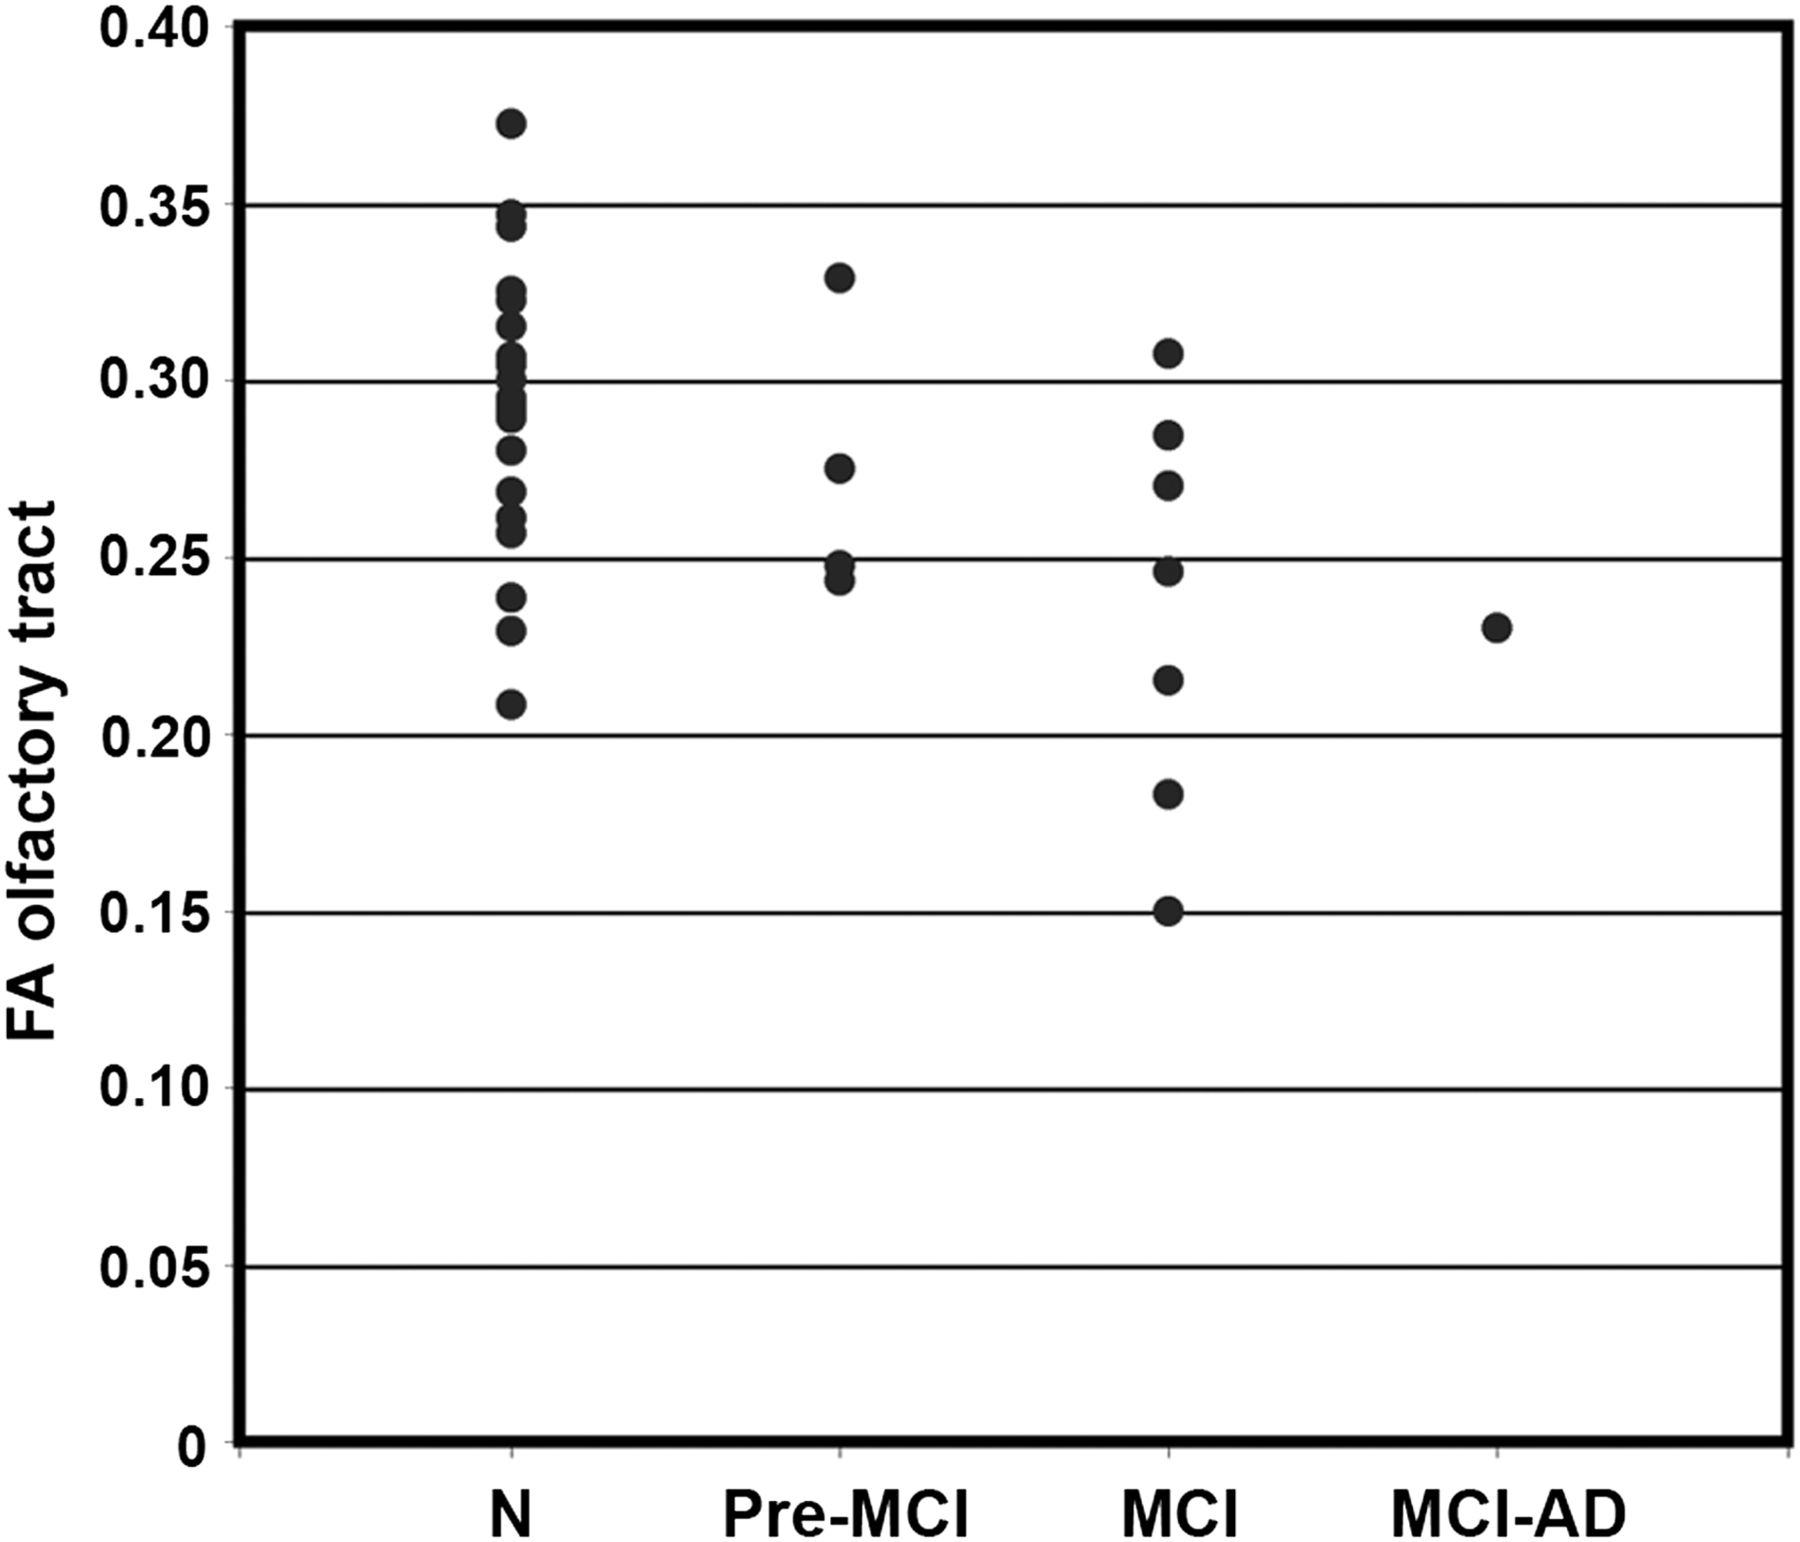
Group-averaged FA values for ROIs in the OT were decreased in MCI subjects, compared with all normal controls (FA, 0.24 ± 0.05 and 0.29 ± 0.05 for MCI and normal controls, respectively, P < 0.05). When a subset of elderly normal controls (n = 8; mean age ± SD, 68 ± 7.0 y) whose age range was closer to that of the MCI group was examined using a general linear model with age and sex as covariates, the group difference remained significant (P = 0.05), despite losing a power due to a smaller number of samples. Age also independently contributed to the difference (P = 0.05), whereas sex did not affect the group difference (P = 0.62). The subdivision of MCI subjects into groups with varying clinical diagnoses over time (pre-MCI, clinical diagnosis changed between normal and MCI over multiple follow-ups but was normal at time of scanning; MCI, clinical diagnosis of MCI at time of scanning; and MCI-AD, 1 subject, diagnosed as MCI at time of scanning progressed to AD on subsequent clinical follow-up) indicated an interesting downward stratification in OT integrity, possibly reflecting ongoing disease progression even within the heterogeneous MCI clinical diagnostic category (Fig. 4).

Scatterplot of FA in OT separated by diagnostic group. Groups are defined as follows: N = normal controls; Pre-MCI = clinical diagnosis changed between normal and MCI over multiple follow-ups but was normal at time of scanning; MCI = clinical diagnosis of MCI at time of scanning; and MCI-AD, 1 subject diagnosed as MCI at time of scanning who progressed to AD diagnosis on subsequent clinical follow-up.
Metabolic Correlates to OT Integrity in Pre-AD MCI
The clinical category of MCI can represent heterogeneous etiologies as very mild memory impairments that do not stratify easily into 1 type of dementia or another. However, we know from previous investigations that some subjects in any given MCI cohort will progress clinically to probable AD within a few years (30). Because of the early involvement of the OT in the development of AD pathology, we wished to investigate the association between OT integrity and cortical metabolic patterns that are specific to the early changes that are present in AD. After 18F-FDG PET 3D-SSP mapping against a standard normal database, we confirmed that 6 subjects of the original 12 MCI group (50% of initial MCI subjects involved in this study) showed hypometabolism typical of AD in posterior cingulate and parietal–temporal cortices (pre-AD MCI) (Fig. 5). Of the subjects with clinical diagnoses of amnestic MCI, 5 did not have a hypometabolic pattern indicating AD. Two subjects had mild decrease in the frontal and temporal cortices suggesting possible frontotemporal dementia, and 1 subject had decreases in the occipital and posterior parietal regions suggesting diffuse Lewy body disease. In fact, this subject later progressed to a clinical diagnosis of diffuse Lewy body. One subject had mild diffuse hypometabolism with no particular pattern but also had a large artifact, possibly a subarachnoid cyst, and 1 subject had normal PET scan results. The final MCI subject did not undergo an 18F-FDG PET scan and was included only in the olfactory FA values comparison. In our normal controls, the general pattern of metabolic regions that were correlated significantly with OT integrity was similar to that seen across the entire group. These structures included the PFC (z = 4.2), insula (z = 3.9), hypothalamus (z = 3.9), TH(dm) (z = 3.9), and hippocampus (z = 4.2). In contrast, our pre-AD MCI group alone indicated that OT integrity was associated with cortical metabolism in more medial temporal and posterior regions including the parahippocampal gyrus (z = 5.0), fusiform gyrus (z = 5.0), posterior cingulate cortex (z = 4.2), cerebellum (z = 4.1), uncus (z = 4.1), and lingual gyrus (z = 3.9) as well as the PFC (z = 4.1) and pre- and postcentral gyrus regions (z = 4.1) (Fig. 6).

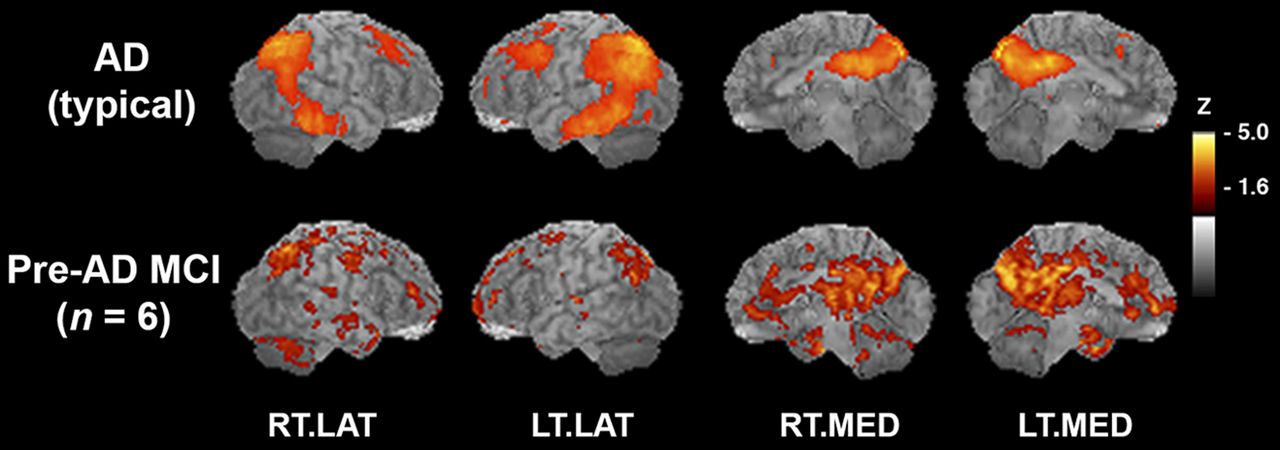
Six subjects with MCI show AD-typical pattern of hypometabolism. (Top) AD-typical pattern of hypometabolic deficits that was reanalyzed from previously published study (n = 37 probable AD vs. n = 22 normal controls) (15). In subjects with AD, 18F-FDG PET images were compared with those of normal controls in voxelwise subtraction analysis and P values converted to z scores. Resultant z score map was superimposed to anatomic MR image for better visualization of hypometabolic pattern. (Bottom) Hypometabolic pattern from pre-AD MCI subjects in current study, as compared with normal controls in voxelwise subtraction analysis with P values converted to z scores. Sagittal aspects are noted. RT.LAT = right lateral; LT.LAT = left lateral; RT.MED = right medial; LT.MED = left medial.

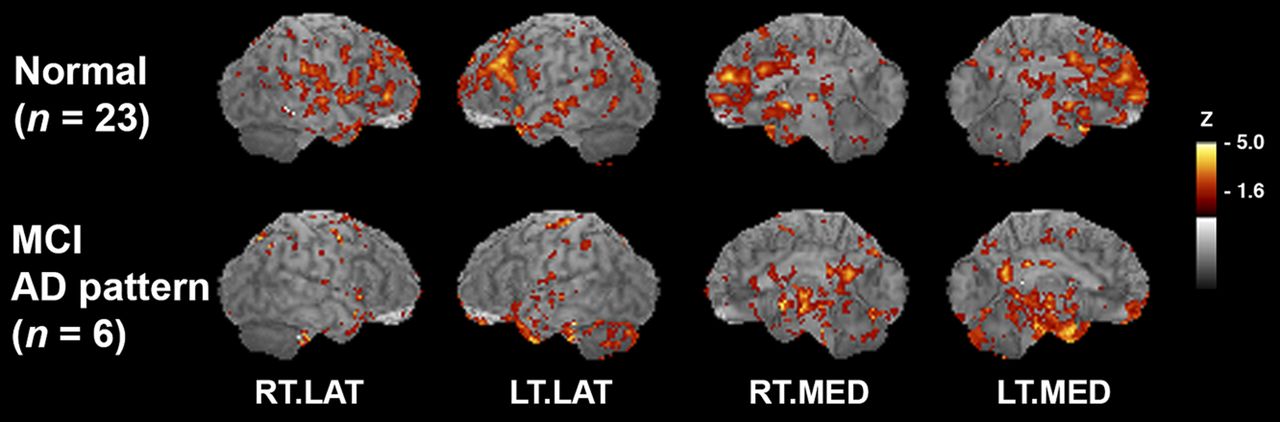
OT integrity shows differential association between MCI and normal controls. Voxelwise correlation maps of OT integrity to glucose metabolism with correlation coefficients converted to z scores and resultant z score maps superimposed on structural MR image for peak localization. Normal control group in comparison to group of pre-AD MCI subjects on bottom row. As compared with normal controls, pre-AD MCI shows additional association of OT integrity with medial temporal lobe and posterior cortical metabolism. Sagittal aspects are noted. RT.LAT = right lateral; LT.LAT = left lateral; RT.MED = right medial; LT.MED = left medial.
Differential Anterior Versus Posterior Relationship for MCI Subjects and Normal Controls
Principal component analysis (PCA) was used to explore further the latent associations between OT integrity and cortical metabolism in the anterior and posterior cingulate regions in pre-AD MCI subjects versus normal controls (Table 1). In normal controls, only 1 component with an eigenvalue greater than 1 was found (49% of variance explained), and it was a latent correlation between OT FA changes and glucose metabolic changes in the anterior cingulate cortex as was indicated by our previous voxelwise analysis. In pre-AD MCI subjects, the first component with an eigenvalue greater than 1 indicated an association of OT integrity with metabolism in the posterior cingulate cortex (49% of variance), and a second component indicated the positive association with the anterior cingulate cortex (48% of variance). In the pre-AD MCI subjects, a positive correlation between OT integrity and the anterior cingulate was seen in the second component, whereas the first component indicated additional association between OT integrity and posterior cingulate metabolism (Fig. 7).
OT Integrity Differentially Associated with Posterior Cingulate Metabolism in pre-AD MCI
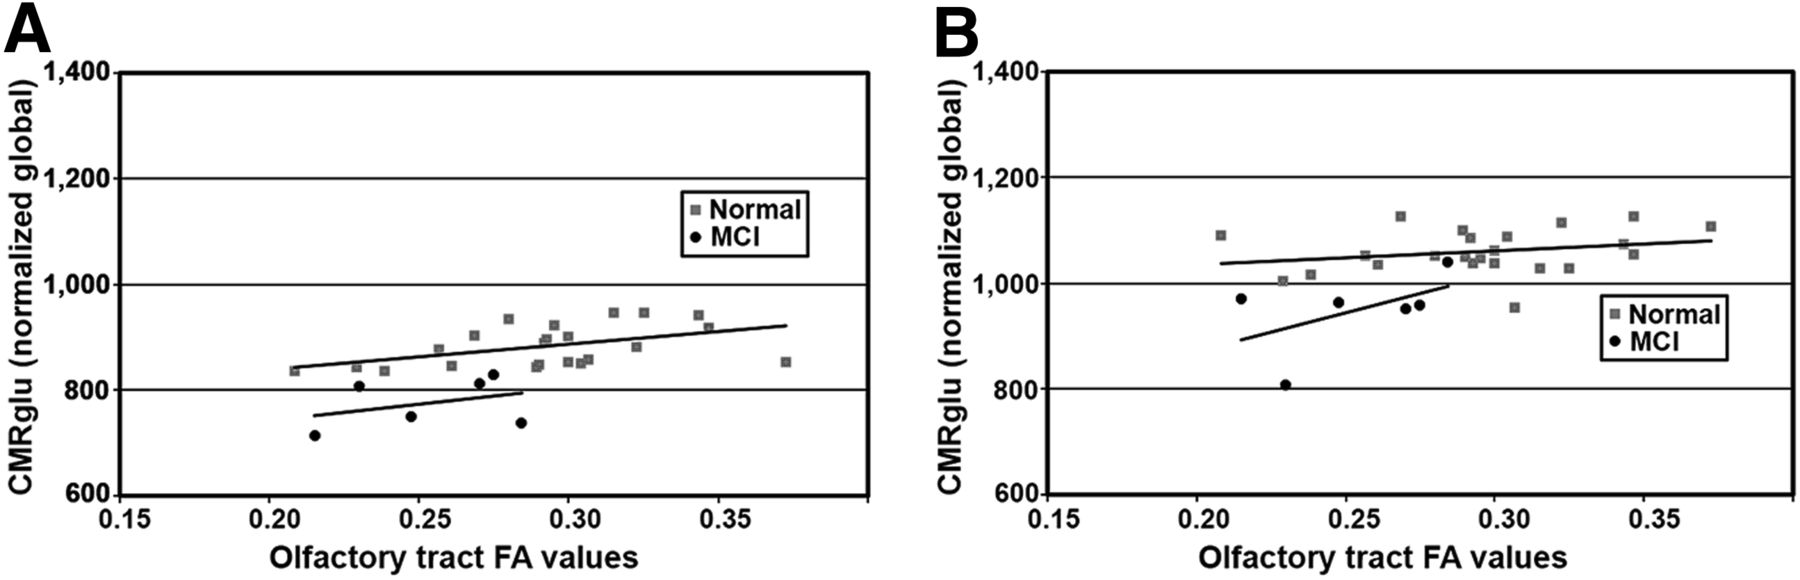
Scatterplots comparing OT integrity to glucose metabolism in anterior and posterior cingulate cortices. (A) Trend lines indicate nearly parallel association for both groups in anterior cingulate. (B) However, in posterior cingulate cortex association was correlated differentially, possibly reflecting underlying disease processes.
DISCUSSION
Our results indicate that the degree of fiber tract integrity is associated with glucose metabolism in functionally related cortical processing regions using a multimodal imaging approach, which, to our knowledge, has not been reported previously. In this investigation, the integrity of the OT correlated to the glucose metabolic function of cortical regions with known olfactory input and processing, which included the prefrontal cortex, dorsomedial thalamus, hypothalamus, uncus, and orbitofrontal cortex. This association was found regardless of the presence of underlying neurodegenerative disease in a group that included subjects with MCI as well as normal controls. The OT is an ideal structure for this type of investigation in that it receives excitatory input only from the olfactory nerve, it is easily delineated on MR imaging structural images, and cortical regions that are structurally and functionally connected are well defined. In addition, for the purposes of this investigation, the OT is known to be affected early in dementing disorders, in particular with AD (6–10), and therefore we expected to find loss of fiber tract integrity in our MCI subjects at a very early stage in the AD pathophysiologic cascade.
Our MR imaging results are consistent with previous investigations that OT white matter changes are an early feature of AD. Using voxel-based morphometry of MR images, Thomann et al. found significant atrophy in the olfactory bulb and tract of subjects with MCI, corresponding to loss of gray matter density in the medial temporal lobe bilaterally (13). Using MR imaging and 18F-FDG PET, our study found that in the pre-AD MCI cohort, decreased integrity in the OT corresponded to a reduced metabolism in regions that included the medial temporal lobe structures such as the parahippocampal gyrus, fusiform gyrus, and uncus, which could be related to an overall loss of gray matter density as seen in the previous publication. However, our results also indicated that the level of OT integrity was associated with metabolic activity in the posterior cingulate cortex, which has not been reported previously. In fact, this association with OT integrity was confirmed in a secondary analysis using VOIs of the glucose metabolism in the anterior versus posterior cingulate cortices and explored by PCA between our normal and pre-AD MCI cohorts. Although PCA confirmed the association between OT integrity and anterior cingulate metabolism in our normal control subjects, the primary association for pre-AD MCI was found with the posterior cingulate cortex. This association is not likely related to decreased neuronal excitatory input directly from the OT to the posterior cortical regions because such direct pathways are not identified in the olfactory system. Rather, it likely reflects simultaneous processes related to AD neurodegeneration that affect both OT integrity and neuronal activity in the posterior cingulate cortex concurrently. However, given the small sample size in the current study and the exploratory nature of the PCA, further confirmatory investigation of the pathophysiologic relationship concerning olfactory degeneration and other cortical degeneration requires additional longitudinal studies involving a larger number of early AD patients.
The mechanistic relationship between fiber tract integrity and decreased regional glucose metabolism is not understood fully. Decreased FA values reflect a loss of fiber tract integrity including disruption of axonal structure or myelin loss (31). Loss of integrity may result in impaired axonal transport processes, and disruption or loss of myelination may hamper excitatory neuronal activation of cortical projection neurons. In neurons, glucose consumption was shown to occur in the vicinity of synapses, and 18F-FDG PET is considered a general marker of neuronal activity, particularly at the synapse (22). Therefore, axonal integrity could affect metabolic activity at the level of individual neurons. Also, on a more macroscopic level, DTI FA values reflect the overall level of integrity for a particular white matter bundle, in our case the OT. Neuronal loss from aging and disease as indicated by decreased white matter FA values on DTI could cause loss of cortical gray matter density and thus loss in the overall number of synapses, which would also result in a decrease in metabolic activity for a particular region. Previously, we showed that deafferentation of the medial temporal lobe after resection in epilepsy patients resulted in posterior cingulate metabolic deficits (32). A combination of these factors may underlie the findings of our present study, and further investigation is needed to evaluate the overall contributions to the relationship between fiber tract integrity and metabolic function.
CONCLUSION
This study found that OT degeneration was associated with metabolic changes in the central olfactory system with progressive and differential loss of OT integrity in MCI, indicating involvement of OT in early AD pathophysiology. In normal controls, changes in FA values in the OT correlated with glucose metabolism in connected anterior cerebral structures. In pre-AD MCI subjects, the results indicated more medial temporal lobe and posterior cortical associations with OT integrity. Multimodal imaging using 18F-FDG PET and DTI may provide better insights into aging and neurodegenerative processes.
DISCLOSURE
The costs of publication of this article were defrayed in part by the payment of page charges. Therefore, and solely to indicate this fact, this article is hereby marked “advertisement” in accordance with 18 USC section 1734. This study was supported by NIH R01 NS045254, NIA grant P50AG005136, and the VA Puget Sound Mental Illness Research, Education and Clinical Center (MIRECC). No other potential conflict of interest relevant to this article was reported.
Acknowledgments
We acknowledge Barbara Lewellen, Jeff Stevenson, and James Valez for their technical support of this study.
Footnotes
Published online Jun. 26, 2013.
- © 2013 by the Society of Nuclear Medicine and Molecular Imaging, Inc.
REFERENCES
- Received for publication October 31, 2012.
- Accepted for publication February 12, 2013.


Jump to section
Related Articles
Cited By...
- Hypothalamic structure and function in Alzheimers disease and Lewy-body dementia: a systematic review and meta-analysis
- Neuropathological stage-dependent proteome mapping of the olfactory tract in Alzheimes disease: From early olfactory-related omics signatures to computational repurposing of drug candidates
- Association of Olfaction and Microstructural Integrity of Brain Tissue in Community-Dwelling Adults: Atherosclerosis Risk in Communities Neurocognitive Study
- Role of sex and high fat diet in metabolic and hypothalamic disturbances in the 3xTg-AD mouse model of Alzheimers disease