


Abstract
PET-based treatment response studies typically measure the change in the standardized uptake value (SUV) to quantify response. The relative changes of different SUV measures, such as maximum, peak, mean, or total SUVs (SUVmax, SUVpeak, SUVmean, or SUVtotal, respectively), are used across the literature to classify patients into response categories, with quantitative thresholds separating the different categories. We investigated the impact of different SUV measures on the quantification and classification of PET-based treatment response. Methods: Sixteen patients with solid malignancies were treated with a multitargeted receptor tyrosine kinase inhibitor, resulting in a variety of responses. Using the cellular proliferation marker 3′-deoxy-3′-18F-fluorothymidine (18F-FLT), we acquired whole-body PET/CT scans at baseline, during treatment, and after treatment. The highest 18F-FLT uptake lesions (∼2/patient) were segmented on PET images. Tumor PET response was assessed via the relative change in SUVmax, SUVpeak, SUVmean, and SUVtotal, thereby yielding 4 different responses for each tumor at mid- and posttreatment. For each SUV measure, a population average PET response was determined over all tumors. Standard deviation (SD) and range were used to quantify variation of PET response within individual tumors and population averages. Results: Different SUV measures resulted in substantial variation of individual tumor PET response assessments (average SD, 20%; average range, 40%). The most extreme variation between 4 PET response measures was 90% in individual tumors. Classification of tumor PET response depended strongly on the SUV measure, because different SUV measures resulted in conflicting categorizations of PET response (ambiguous treatment response assessment) in more than 80% of tumors. Variation of the population average PET response was considerably smaller (average SD, 7%; average range, 16%), and this variation was not statistically significant. Differences in tumor PET response were greatest between SUVmean and SUVtotal and smallest between SUVmax and SUVpeak. Variations of tumor PET response at midtreatment and posttreatment were similar. Conclusion: Quantification and classification of PET-based treatment response in individual patients were strongly affected by the SUV measure used to assess response. This substantial uncertainty in individual patient PET response was present despite the concurrent robustness of the population average PET response. Given the ambiguity of individual patient PET responses, selection of PET-based treatment response measures and their associated thresholds should be carefully optimized.
PET-based treatment response assessment studies typically measure the relative change in the standardized uptake value (SUV) to quantify response. SUV is the ratio of the tissue radioactivity concentration to the total injected activity per patient mass, lean body mass, or body surface area. Most studies measure the change in either the maximum SUV (SUVmax) (1–3) or the mean SUV (SUVmean) (4,5) of the tumor following the recommendations of the European Organization for Research and Treatment of Cancer (EORTC) (6) and the Cancer Imaging Program of the National Cancer Institute (7). Others quantify the change in the peak SUV (SUVpeak) (8–10) as suggested by Wahl et al. in the recent recommendations for PET Response Criteria in Solid Tumors (PERCIST) (11), the most comprehensive criteria to date. Fewer SUV-based response studies measure the change in the total SUV (SUVtotal), which is associated with the total metabolic burden in 18F-FDG PET (4,12,13).
The relative change in SUV can be used to classify patients into different PET-based treatment response categories: PET complete response, PET partial response (PR), PET stable disease, and PET progressive disease (PD), with quantitative thresholds separating the different response categories (e.g., greater than 30% increase in SUVpeak for PET PD using PERCIST). Such response classifications are often used to guide subsequent treatment decisions and can be predictive of clinical outcome (1,14,15).
The SUV measure used for treatment response assessment may significantly affect the quantification of PET response. Studies have revealed minimal differences in PET-based response quantification averaged over many patients using different SUV measures (8,16). However, these studies have not examined differences in the quantification of PET response within individual patients using multiple SUV measures. It has been already demonstrated that inconsistent definition of a single SUV measure (SUVpeak) results in substantial variation (≤50%) of individual tumor PET response (17). Therefore, it is highly likely that multiple SUV measures could result in different quantifications and classifications of PET response. For example, a patient’s response might be classified as PET PD using SUVmax but as PET PR using SUVmean, even though both measures are recommended by the EORTC. Such ambiguities could cast confusion on subsequent treatment decisions. Furthermore, the quantitative thresholds governing PET-based response categorization may strongly depend on the SUV measure used to gauge response, with different thresholds applying to different measures. The sensitivity of PET-based response assessment to different SUV measures could have significant clinical implications regarding the use of PET for quantification of treatment response. Consequently, we investigated the impact of different SUV measures on quantification and classification of PET-based treatment response.
MATERIALS AND METHODS
Treatment and Imaging
Sixteen patients with advanced solid malignancies were treated with sunitinib malate (Sutent; Pfizer), a multitargeted receptor tyrosine kinase inhibitor. Sunitinib has been demonstrated to increase objective response rate and progression-free survival (PFS) in patients with renal cell carcinoma (18) and gastrointestinal stromal tumors (19) and has shown significant antitumor activity in patients with metastatic breast cancer (20), non–small cell lung cancer (21), and neuroendocrine tumors (22). Malignancies in this study included a diverse range of tumor types: renal cell carcinoma (n = 7), esophageal (n = 2), hepatocellular (n = 2), prostate (n = 1), sarcoma (n = 1), small cell lung (n = 1), thymus (n = 1), and uterine carcino-sarcoma (n = 1). Response to therapy was measured using the PET radiotracer 3′-deoxy-3′-18F-fluorothymidine (18F-FLT). As a surrogate of cellular proliferation, 18F-FLT is emerging as a promising candidate for chemotherapy response assessment as demonstrated in patients with lymphoma, breast cancer, and glioma (23–25). Patients were injected intravenously with approximately 240 MBq (6.5 mCi) of 18F-FLT and underwent whole-body PET/CT scans at baseline (pretreatment), during treatment, and after treatment using a Discovery LS PET/CT scanner (GE Healthcare). 18F-FLT was synthesized following the method described by Martin et al., with slight modifications (26). PET/CT imaging began 47 ± 4 min after injection and extended inferiorly from the base of the skull to the distal femora. Acquisition mode was 2-dimensional, and acquisition time was 10 min per bed position to minimize image noise. PET images were reconstructed on a 128 × 128 grid over a 50-cm field of view using the ordered-subset expectation maximization algorithm with 2 iterations, 28 subsets, 5-mm gaussian loop (interiteration) filter, 3-mm gaussian postprocessing filter, and CT attenuation correction. On average, patient weight changed only 1.5% between the 2 PET scans.
The study protocol was approved by the University of Wisconsin (UW) Health Sciences Institutional Review Board, the Scientific Review Board of the UW Carbone Comprehensive Cancer Center, and the UW Radiation Drug Research Committee. All patients signed a written informed consent form before enrollment in the study.
Quantification of Tumor PET Response
PET activity concentrations (MBq/mL) were converted to SUVs by normalizing by the decay-corrected injected activity per patient mass. 18F-FLT–avid lesions (∼2/patient) were segmented on PET images by an experienced nuclear medicine physician. Lesion boundaries were delineated on transverse images where uptake level was visually elevated above background. These segmentations were used to generate a 3-dimensional volume of interest (VOI) for each lesion. The location and number of lesions were as follows: lung, 11; mediastinum, 5; liver, 3; abdomen, 3; adrenal, 1; gastrointestinal, 2; pelvis, 1; gluteus, 1; uterus, 1; and arm, 1. Tumor volumes ranged from 1 to 530 mL, with an average volume of 66 mL.
For an individual lesion (n), SUVtotal, SUVmean, and SUVmax were defined as follows:
Here, n is an individual tumor,
SUVmax, SUVpeak, SUVmean, and SUVtotal were calculated for individual tumors. SUVpeak was determined automatically using an in-house MATLAB (The MathWorks, Inc.) script that computed the average SUV within a 1 cm3 sphere centered in the highest uptake region of the tumor VOI. 18F-FLT PET–based tumor proliferative responses at time point t (mid- or posttreatment) were quantified by the change in each SUV measure relative to baseline (Eqs. 4–7).
Here, n is an individual tumor,
The 4 different SUV measures (SUVmax, SUVpeak, SUVmean, and SUVtotal) yielded 4 different PET responses for each tumor at midtreatment and at posttreatment. At each time point, a mean PET response for each tumor was determined (mean intratumor PET response, Eq. 8), and the variation of the 4 PET responses about the mean PET response was quantified using SD and range.
Here, n is an individual tumor and
In addition, a population average PET response (Eqs. 9–12) was determined for each SUV measure by averaging the PET responses of all tumors at midtreatment or at posttreatment.
Here, n is an individual tumor, N is the total number of tumors, and
One-way ANOVA was used to test whether the changes in the different SUV measures resulted in statistically significant differences in tumor PET responses. Means were compared using Tukey honestly significant difference test. Differences were considered statistically significant at an α-level less than 0.05, after adjustment for multiple comparisons. Correlations between the variation of tumor PET response and other tumor characteristics were tested using the Pearson correlation coefficient (r) and considered statistically significant at an α-level less than 0.05.
Association of PET Response with Clinical Endpoint
A Cox proportional hazards survival regression was used to associate the change in each SUV measure at each imaging time point (mid- and posttreatment) with the clinical endpoint, PFS. PFS was defined as the time to disease progression, either radiographic progression on CT or clinical progression of symptoms related to disease. Time to disease progression ranged from 2 to 22 mo, with a mean of 7.3 mo. Hazard ratio, covariate coefficient, and survivor function along with χ2 statistic and P value were determined for each SUV measure at each imaging time point. Statistical significance was achieved at an α-level less than 0.05.
RESULTS
Individual Tumors
PET responses of individual tumors were sensitive to the SUV measure used to quantify the response. On average, different SUV measures resulted in substantial variation of individual tumor PET response (average SD, 20%; average range, 40%; Figs. 1–3). In individual tumors, the most extreme variation between SUV response measures was 90% (largest SD, 44%). On average, differences in tumor PET response were greatest between SUVmean and SUVtotal (average difference, 28%) and smallest between SUVmax and SUVpeak (average difference, 13%). Results at midtreatment and at posttreatment were similar (Figs. 2 and 3).

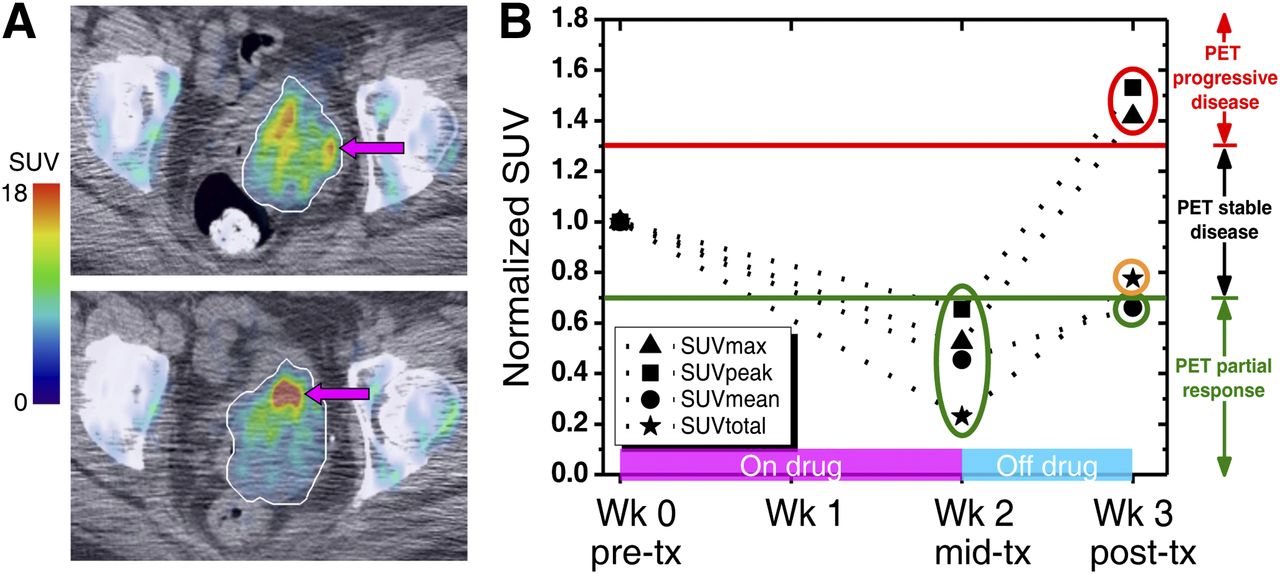
Variation of individual tumor PET response using different SUV measures. (A) 18F-FLT PET/CT images of uterine tumor (white outline), pretreatment (top), and posttreatment (bottom). After treatment, SUVmax (arrows) increased by 40% whereas SUVmean decreased by 35%. (B) SUV measures (normalized to baseline) changed throughout therapy. Midtreatment, decreases of SUV measures varied but all measures indicated partial PET response (below –30%, green line). Posttreatment, wide variation of changes of SUV measures resulted in multiple, ambiguous PET response classifications, including PET PR, PET stable disease, and PET PD (above +30%, red line). mid-tx = midtreatment; post-tx = posttreatment; pre-tx = pretreatment; wk = week.

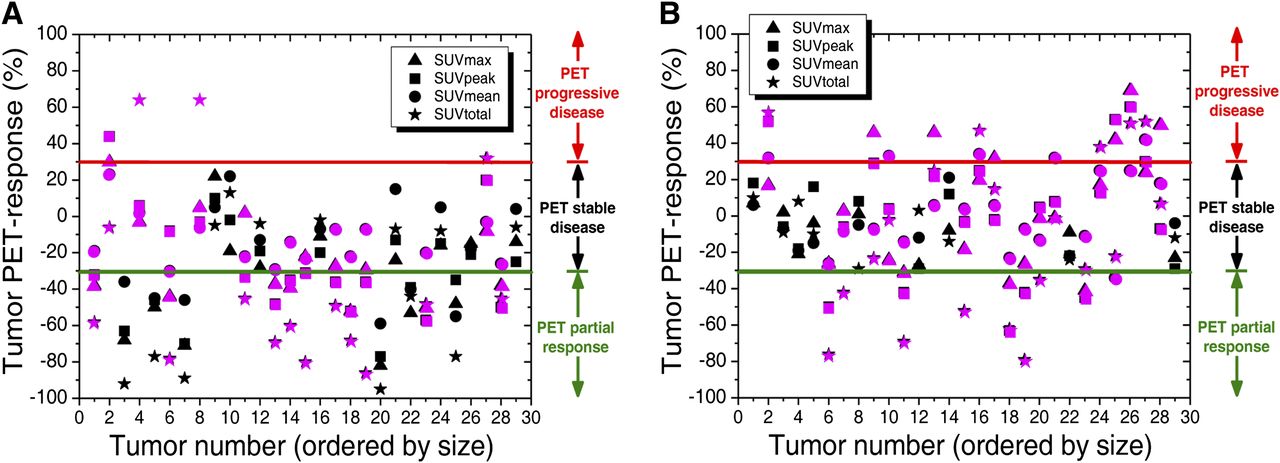
Variation of individual tumor PET responses pre- to midtreatment (A) and pre- to posttreatment (B) using different SUV measures. Substantial variation of PET response quantification resulted in classification of individual tumors into multiple response categories (green line, PET PR/PET stable disease cutoff, –30%; red line, PET PD/PET stable disease cutoff, +30%). Such ambiguous PET response categorization (magenta) occurred in more than 80% of tumors in this study.
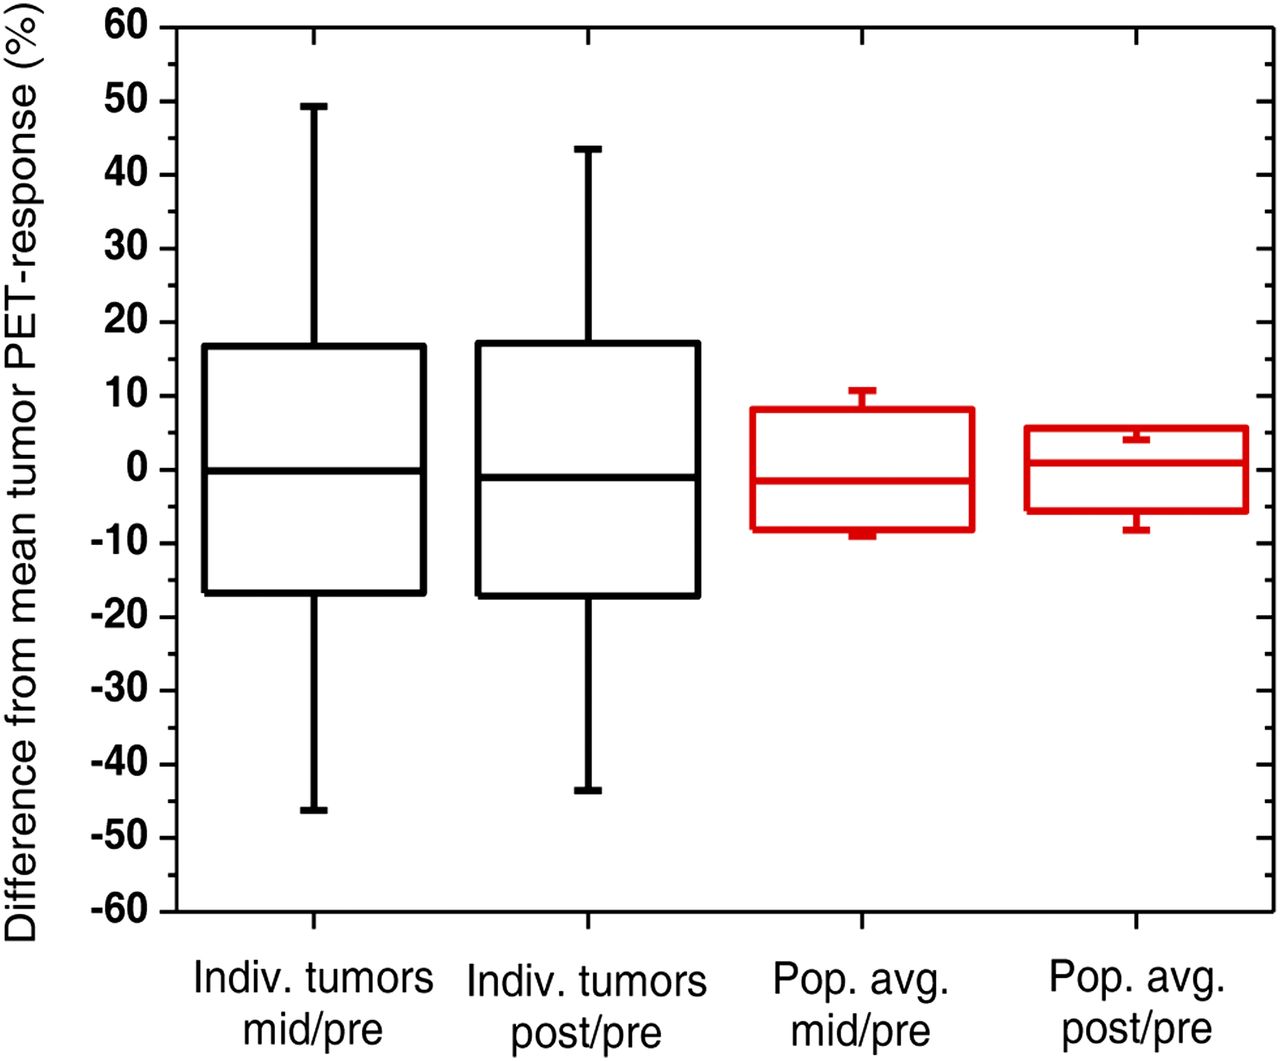
Variation of individual tumor PET responses (black) and population average PET responses (red) at mid- and posttreatment arising from different SUV measures. There is substantial variation of individual tumor PET response but much smaller variation of population average PET response, which is expected to be further reduced as more tumors are included in average. Boxes represent SD, whiskers show range, and solid lines depict median. Indiv = individual; mid = midtreatment; pop avg = population average; post = posttreatment; pre = pretreatment.
Variation of individual tumor PET response is highlighted for a uterine tumor in Figure 1. Pre- to midtreatment, all 4 SUV measures decreased by different amounts (
There was no significant correlation between tumor size and the variation of individual tumor PET response (Fig. 2, tumors ordered by size). Furthermore, there was no significant correlation between the degree of PET response (i.e., PET PD, PET stable disease, or PET PR) and the variation of individual tumor PET response.
For each SUV measure at each response time point, individual tumor PET responses were tested for strength of association with the clinical endpoint of PFS (Table 1). PET response determined posttreatment using SUVtotal (
Association of SUV Response Measures with PFS
Population Average
The use of different SUV measures resulted in small variation of the population average PET response (average SD, 7%; average range, 16%; Figs. 3 and 4). There was slightly greater variation of the population average PET response at midtreatment (SD, 8%; range, 20%) than at posttreatment (SD, 6%; range, 12%). Differences in population average PET responses were greatest between SUVmean and SUVtotal (average difference, 16%) and smallest between SUVmax and SUVpeak (average difference, 2%). Differences between the populations of PET response associated with each SUV measure were not statistically significant.

Quantification of population average PET response using different SUV measures. Both at mid- and posttreatment, there was minimal variation of changes of different SUV measures averaged over all tumors (normalized to baseline), and almost all measures indicated PET stable disease. PET response category thresholds are indicated by green line (–30%, PET PR/PET stable disease cutoff) and red line (+30%, PET PD/PET stable disease cutoff). mid-tx = midtreatment; post-tx = posttreatment; pre-tx = pretreatment.
The minimal variation of the population average PET response is shown in Figures 3 and 4. Pre- to midtreatment, all 4 SUV measures decreased by similar amounts (
DISCUSSION
The SUV measure used to determine treatment response had a dramatic effect on the quantification of PET response. On average, different SUV measures caused a 20% variation of individual tumor PET response, and this variation ranged as high as 90%. Large variation can lead to different categorizations of PET response using established response criteria where fixed thresholds separate different PET response categories (e.g., EORTC response criteria (6) or PERCIST (11)). One such case is illustrated in Figure 1 where the posttreatment PET response (week 3) was classified either as PET PD, PET stable disease, or PET PR, depending on the SUV measure used to quantify the response. Such ambiguous PET response categorizations arose in more than 80% of the tumor PET responses assessed in this study (Fig. 2). These ambiguities remained using either the EORTC or PERCIST thresholds (which are slightly different) that separate the different PET response categories. This sensitivity of PET response quantification to the SUV measure reveals the need to optimize PET imaging metrics for quantitative response assessment in individual patients.
Ambiguous PET-based treatment response categorization of individual tumors illustrates the shortcomings of relying on a single SUV measure to quantify response as well as the somewhat arbitrary thresholds to categorize the response. These problems are even more alarming because these PET response classifications are often used to guide subsequent treatment decisions. Ambiguous PET response assessment could muddle the intricate process of determining the need for further therapy. Assessment of treatment response using multiple SUV measures may offer a more complete characterization of response. Moreover, it is likely that some combination of SUV measures may provide a more comprehensive picture of treatment response and would be more informative and potentially more predictive of clinical outcome.
Differences in tumor PET response between SUVmean and SUVtotal were approximately twice as large as those between SUVmax and SUVpeak. These larger differences are likely due to the inherent variability associated with manual VOI tumor delineation, even by an experienced nuclear medicine physician, which strongly affects SUVmean (normalized by tumor volume) and SUVtotal (integrated over tumor volume). Automated approaches to VOI tumor definition would reduce variability and improve the reproducibility and objectivity of tumor PET response using volume-sensitive metrics such as SUVmean and SUVtotal. This improvement is illustrated by the smaller differences in tumor PET response between SUVmax and SUVpeak, both of which were determined in an automated manner.
Variation of PET response within individual tumors is not surprising because different SUV measures assess different tumor characteristics. In PET imaging, SUVmax and SUVpeak measure the tumor region of most intense proliferation using 18F-FLT (or most intense metabolism with 18F-FDG) whereas SUVmean and SUVtotal assess overall proliferation in the tumor. Tumors tend to be heterogeneous so the average response of the entire tumor may be different from the response of one particular subregion. The uterine tumor in Figure 1 highlights this phenomenon. Posttreatment, SUVmean decreased by 35% whereas SUVmax increased by 40%, implying that overall tumor proliferation decreased despite an increase in the most intense proliferative activity of the tumor. Using SUV, the heterogeneity and complexity of such responses can be captured only with multiple SUV measures or histograms of tumor voxel SUV. It is also quite possible that alternative, non-SUV measures may be better suited for PET-based assessment of treatment response (27,28). Furthermore, complex responses reveal the risk of relying on one or even multiple SUV measures for PET response assessment. Visual readings of PET examinations by trained nuclear medicine physicians are vital to fully understand treatment response. Physicians examine changes in tumor size, extent, uptake, and other characteristics that may support or contradict SUV-based response assessment.
Different SUV measures assess different tumor characteristics. Consequently, it is likely that each SUV measure will have its own unique threshold for PET response classification. For example, the PET PR/PET stable disease threshold for the change in SUVmax may be different from that of SUVpeak. However, currently, the thresholds for PERCIST (±30% based on SUVpeak) and EORTC response criteria (±25% based on SUVmax and SUVmean) are quite similar even though these criteria use different SUV measures for response assessment. This study illustrates the danger of using a generic one-size-fits-all threshold for different SUV measures. Assessment of different aspects of the underlying tumor physiology will likely result in different response thresholds for different SUV measures. Furthermore, the study demonstrates that there are different uncertainties associated with different SUV metrics. For example, SUVmax is a single pixel value that is adversely affected by image noise whereas SUVmean is quite sensitive to the delineation of tumor volume (8,11,29–31). PET response thresholds specific to each SUV measure must account for the sensitivity of each measure to uncertainties due to image noise, partial-volume effects, tumor motion, tumor contouring, and other scan acquisition and reconstruction parameters. Clearly, the unique test–retest repeatability and underlying tumor physiology associated with each SUV measure should both factor into SUV measure–specific response thresholds.
The considerable variation of quantification of PET response of individual tumors using different SUV measures underscores the pressing need for systematic selection of those measures that are most effective for assessment of treatment response. Ideally, these measures should be predictive of clinical outcome and robust to imaging uncertainties. As an example, SUV response measures in this study were correlated with a clinical endpoint using a Cox proportional hazards model. Despite small patient numbers, the posttreatment change in SUVtotal was identified as significantly associated with PFS. Larger clinical trials are necessary to establish the superiority of specific PET measures (SUV or non-SUV) for quantification of response to therapy. These trials should determine and compare the correlation of different PET response measures with clinical outcome. Combinations of PET response measures could also be explored to ascertain whether they offer improved predictive power over individual measures. Furthermore, these trials should investigate the sensitivities of these measures to a variety of imaging factors including image noise, scan acquisition and image reconstruction parameters, partial-volume effects, tumor motion, and others. Ultimately, the most predictive and robust PET measures (or combination of measures) should be selected for quantification of treatment response.
Unlike individual tumors, the population average PET response was relatively insensitive to the SUV measure used to quantify the response. On average, different SUV measures caused only a 7% variation in the population average PET response. This is consistent with the findings of Krak et al. and Yap et al. who demonstrated a high correlation of PET-based treatment responses using different SUV measures averaged over many tumors and patients (8,16). Because of an averaging effect, this variation is expected to be further reduced as more tumors are included in the population average. The minimal variation resulted in almost all SUV measures categorizing the population average PET response as PET stable disease at mid- and posttreatment (Fig. 4). This robustness of the population average highlights the strength of PET imaging for quantification of the average response to therapy. Using large numbers of patients, the population average PET response could be applied to establish clinically validated thresholds for more accurate response classification.
18F-FLT, rather than 18F-FDG, was selected as a radiotracer in this study because of the antiproliferative nature of the molecule-targeted therapy. Furthermore, 18F-FLT may be more effective for PET-based assessment of treatment response than 18F-FDG (32–34). Imaging of tumors using both 18F-FLT and 18F-FDG has revealed somewhat higher SUV and broader SUV range with 18F-FDG than with 18F-FLT (23,35,36). Thus, compared with 18F-FLT, 18F-FDG is expected to result in similar if not greater variation of tumor PET response using different SUV measures.
PERCIST thresholds were applied to the 18F-FLT PET imaging response data in this study. However, PERCIST and EORTC response criteria are both based on 18F-FDG PET imaging studies. The PET response thresholds (percentage change in SUV measure) are slightly more stringent (larger) for PERCIST than for EORTC to better account for the uncertainties and variability associated with PET imaging (11,37). Minimally, PET response thresholds (e.g., percentage ± 30% in PERCIST) must be greater than these uncertainties for PET response data to achieve a meaningful level of significance. These uncertainties plague PET imaging regardless of the specific radiotracer being imaged (37). Consequently, in this study, the PERCIST thresholds were applied to the 18F-FLT PET imaging response data to account for the associated uncertainties and variability. Furthermore, uncertainties are likely to be similar for 18F-FDG PET and 18F-FLT PET because the 18F radionuclide is common to both radiotracers. In addition, PET response thresholds of ±30% (as in PERCIST) are supported by a variety of other 18F-FLT PET–based response assessment studies (25,38,39). Ultimately, future and more refined PET response criteria may depend on the specific response metric, disease, radiotracer, imaging time point, and other relevant factors.
In this study, all SUV measures were determined using body weight (
CONCLUSION
PET-based quantification of treatment response was affected substantially by the SUV measure used to assess response. Different SUV measures resulted in a 20% variation of individual tumor PET response, and this variation ranged as high as 90%. Consequently, classification of individual tumor PET response strongly depended on the SUV measure, because different SUV measures resulted in different categorizations of response in more than 80% of tumors. This substantial uncertainty in individual patient PET response was present despite the concurrent robustness of the population average PET response. Given these uncertainties, PET-based quantification of treatment response should be optimized for accurate response assessment in individual patients. Clinical trials are necessary to select the most predictive, robust SUV measures (or combinations of measures) and associated response thresholds that should be used for assessment of treatment response.
DISCLOSURE
The costs of publication of this article were defrayed in part by the payment of page charges. Therefore, and solely to indicate this fact, this article is hereby marked “advertisement” in accordance with 18 USC section 1734. This work was financially supported by NIH grant R01 CA136927. No other potential conflict of interest relevant to this article was reported.
Acknowledgments
We acknowledge the PET technologists Chris Jaskowiak and Mark McNall for scanning patients after hours as well as the UW Cyclotron Research Group for producing the 18F-FLT used in the study.
Footnotes
Published online Jun. 17, 2013.
- © 2013 by the Society of Nuclear Medicine and Molecular Imaging, Inc.
REFERENCES
- Received for publication August 30, 2012.
- Accepted for publication February 24, 2013.


Jump to section
Related Articles
Cited By...
- No citing articles found.