


Abstract
The adenosine triphosphate-binding cassette transporters P-glycoprotein (Pgp) and breast cancer resistance protein (BCRP) are 2 major gatekeepers at the blood–brain barrier (BBB) that restrict brain distribution of several clinically used drugs. In this study, we investigated the suitability of the radiolabeled Pgp/BCRP inhibitors 11C-tariquidar and 11C-elacridar to assess Pgp density in the human brain with PET. Methods: Healthy subjects underwent a first PET scan of 120-min duration with either 11C-tariquidar (n = 6) or 11C-elacridar (n = 5) followed by a second PET scan of 60-min duration with (R)-11C-verapamil. During scan 1 (at 60 min after radiotracer injection), unlabeled tariquidar (3 mg/kg) was intravenously administered. Data were analyzed using 1-tissue 2-rate-constant (1T2K) and 2-tissue 4-rate-constant (2T4K) compartment models and either metabolite-corrected or uncorrected arterial input functions. Results: After injection of 11C-tariquidar or 11C-elacridar, the brain PET signal corrected for radioactivity in the vasculature was low (∼0.1 standardized uptake value), with slow washout. In response to tariquidar injection, a moderate but statistically significant rise in brain PET signal was observed for 11C-tariquidar (+27% ± 15%, P = 0.014, paired t test) and 11C-elacridar (+21% ± 15%, P = 0.014) without changes in plasma activity concentrations. Low levels of radiolabeled metabolites (<25%) were detected in plasma up to 60 min after injection of 11C-tariquidar or 11C-elacridar. The 2T4K model provided better data fits than the 1T2K model. Model outcome parameters were similar when metabolite-corrected or uncorrected input functions were used. There was no significant correlation between distribution volumes of 11C-tariquidar or 11C-elacridar and distribution volumes of (R)-11C-verapamil in different brain regions. Conclusion: The in vivo behavior of 11C-tariquidar and 11C-elacridar was consistent with that of dual Pgp/BCRP substrates. Both tracers were unable to visualize cerebral Pgp density, most likely because of insufficiently high binding affinities in relation to the low density of Pgp in human brain (∼1.3 nM). Despite their inability to visualize Pgp density, 11C-tariquidar and 11C-elacridar may find use as a new class of radiotracers to study the interplay of Pgp and BCRP at the human BBB in limiting brain uptake of dual substrates.
The adenosine triphosphate–binding cassette (ABC) transporters P-glycoprotein (Pgp) and breast cancer resistance protein (humans: BCRP; rodents: Bcrp) act together as a team of gatekeepers at the blood–brain barrier (BBB) at the level of the luminal (blood-facing) membrane of vascular endothelial cells to protect the brain from the accumulation of mostly lipophilic xeno- and endobiotics (1). Various clinically used drugs, most notably several members of the family of tyrosine kinase inhibitors for cancer treatment (e.g., gefitinib, imatinib, and sorafenib), were shown to be dual substrates of Pgp and BCRP (1). It has been demonstrated that Pgp and BCRP form a cooperative drug efflux system at the BBB and that dual substrates gain brain access only when both transporters are genetically or chemically disrupted (2). Tariquidar and elacridar are potent third-generation inhibitors of Pgp that were later discovered to also inhibit BCRP, albeit at higher concentrations than Pgp (3). Based on the assumption that tariquidar and elacridar would bind to Pgp without being transported (4), 11C-tariquidar and 11C-elacridar were developed as PET tracers to visualize Pgp expression levels at the BBB as opposed to substrates, such as 11C-verapamil or 11C-N-desmethyl-loperamide, which visualize Pgp function (5). However, initial preclinical evaluation revealed that baseline brain uptake of 11C-tariquidar and 11C-elacridar was low in rats or mice and significantly increased in Pgp/Bcrp combination knockout mice or after pretreatment of animals with unlabeled tariquidar or elacridar (6–9). This “substratelike” in vivo behavior was subsequently confirmed in vitro by showing that both tariquidar and elacridar are avidly transported by Pgp and BCRP in nanomolar concentrations as used for PET (10,11). On the other hand, PET experiments in a low- and high-Pgp-expressing murine breast tumor graft model showed higher uptake of 11C-tariquidar in Pgp-overexpressing tumors, consistent with Pgp binding (12). Similarly, paired PET scans with 11C-tariquidar or 11C-elacridar and (R)-11C-verapamil in naïve rats, with an intravenous administration of tariquidar (3 mg/kg) before the (R)-11C-verapamil scan, revealed a significant negative correlation between regional brain distribution volumes (VTs) of 11C-tariquidar or 11C-elacridar and (R)-11C-verapamil, which also pointed to Pgp-specific binding of 11C-tariquidar and 11C-elacridar (13). Such a paired-scan protocol could in theory be used to independently assess Pgp expression and Pgp function in a single scan session.
The aim of this study was to investigate the suitability of 11C-tariquidar and 11C-elacridar for visualizing cerebral Pgp density in healthy human subjects. In analogy to a previous preclinical study (13) we performed paired PET scans with 11C-tariquidar or 11C-elacridar and (R)-11C-verapamil including a pharmacologic challenge with tariquidar (3 mg/kg).
MATERIALS AND METHODS
Subjects
The study was conducted in accordance with the Declaration of Helsinki and its amendments, registered with European Union Drug Regulating Authorities Clinical Trials (number 2010-020759-30), and approved by the Ethics Committee of the Medical University of Vienna. The study was conducted as a prospective single-center, randomized phase I study. All subjects provided written informed consent and were confirmed to be healthy on the basis of medical history, physical examination, routine laboratory tests, urine drug screening, electrocardiography, and vital signs. Eleven healthy men (mean age, 34 ± 8 y; mean weight, 76 ± 10 kg) were randomly assigned to receive either an 11C-tariquidar (n = 6) or an 11C-elacridar (n = 5) PET scan followed by an (R)-11C-verapamil PET scan (Fig. 1).
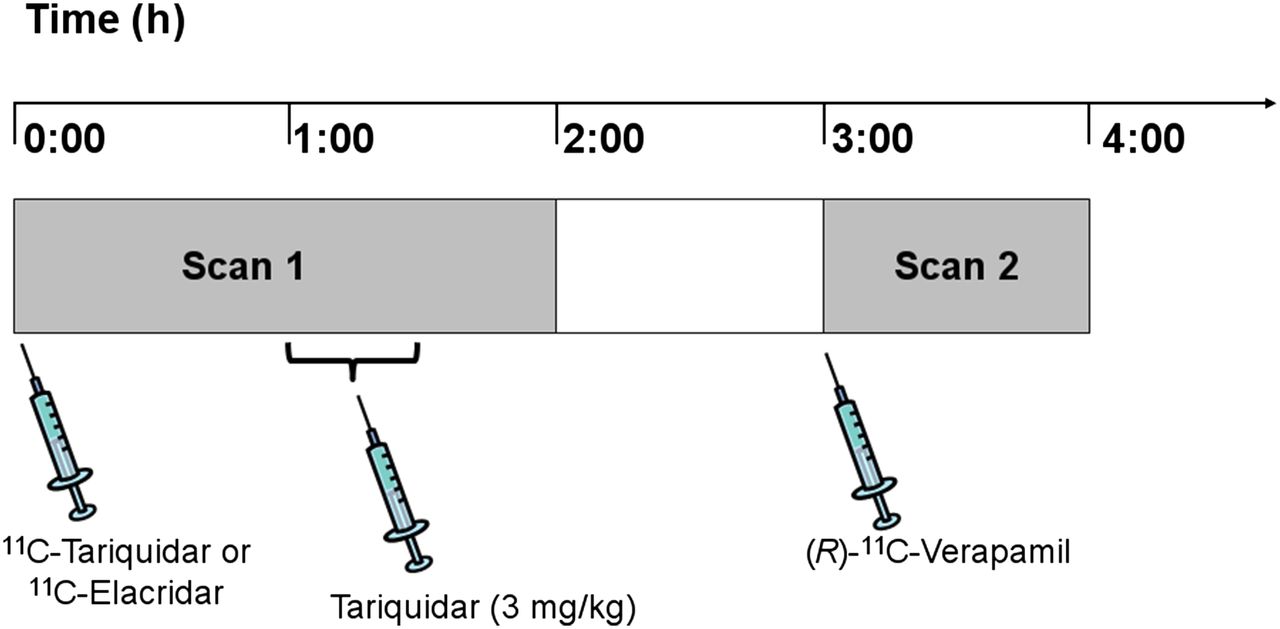
Diagram of study set-up. PET scan 1 with either 11C-tariquidar or 11C-elacridar over 120 min was followed by PET scan 2 with (R)-11C-verapamil over 60 min with interval of 60 min between the 2 scans. At 60 min after start of scan 1, unlabeled tariquidar was infused intravenously at dose of 3 mg/kg over 30 min.
Radiotracer Synthesis
11C-tariquidar, 11C-elacridar, and (R)-11C-verapamil were synthesized following previously published procedures (8,9,14) and formulated in 20-mL sterile 0.9% (w/v) aqueous saline solution/ethanol (9/1, v/v) (containing 1.4% [v/v] polysorbate-80 in the case of 11C-tariquidar and 11C-elacridar). Radiotracer solutions were sterilized by passage through sterile Millex-GV filters (0.22 μm) (Millipore). Polysorbate-80 was used as an excipient to prevent nonspecific binding of radiotracers to filter membranes. Polysorbate-80 has been reported to inhibit Pgp with a half-maximum inhibitory concentration of 24 μM (15). In a previous preclinical study, we administered polysorbate-80 at doses of up to 0.3 mmol/kg and failed to observe a Pgp inhibitory effect at the BBB (16). Specific activities at the time of injection were 19 ± 7, 42 ± 20, and 38 ± 18 GBq/μmol for 11C-tariquidar (6 batches), 11C-elacridar (5 batches), and (R)-11C-verapamil (10 batches), respectively. The radiochemical purity of all radiotracers was greater than 98%.
PET Study Protocol
The subjects underwent a first PET scan of 120-min duration with either 11C-tariquidar or 11C-elacridar followed by a second PET scan of 60-min duration with (R)-11C-verapamil, with 1 h between the 2 scans (Fig. 1). During scan 1 (at 60 min after tracer injection), tariquidar (AzaTrius Pharmaceuticals Pvt Ltd.) was administered at a dose of 3 mg/kg of body weight (3.6 μmol/kg) as an intravenous infusion over 30 min. For formulation of the infusion solution, a 7.5 mg/mL stock solution of tariquidar (free base) in 20% ethanol/80% propylene glycol was diluted in aqueous dextrose solution (5%, w/v) to a final volume of 250 mL.
PET Scans
All PET scans were obtained on an Advance scanner run in 3-dimensional mode (GE Healthcare). For scan 1, either 11C-tariquidar (5.0 ± 0.8 MBq/kg, corresponding to 0.3 ± 0.1 nmol of unlabeled tariquidar and 1.2 ± 0.8 μmol of polysorbate-80 per kilogram) or 11C-elacridar (5.0 ± 0.5 MBq/kg, corresponding to 0.2 ± 0.1 nmol of unlabeled elacridar and 0.5 ± 0.2 μmol of polysorbate-80 per kilogram) was intravenously injected over 30 s, and dynamic emission scans were acquired for 120 min in 26 frames of increasing duration from 15 s to 10 min. For scan 2, (R)-11C-verapamil (5.1 ± 0.7 MBq/kg, corresponding to 0.2 ± 0.1 nmol of unlabeled (R)-verapamil per kilogram) was injected over 30 s, and dynamic emission scans were acquired for 60 min in 20 frames of increasing duration from 15 s to 10 min. Before each radiotracer injection, a 5-min transmission scan using two 68Ge pin sources was recorded.
Safety Monitoring
All subjects were monitored for the safety parameters heart rate and blood pressure until they were discharged from the study ward the morning after the PET scan. In addition, clinical laboratory blood and urine tests were performed. Adverse events were recorded continuously, and the relationship to the study drugs was assessed.
Blood Analysis
To determine the arterial input function of 11C-tariquidar and 11C-elacridar, blood samples (2 mL each) were manually drawn from the radial artery at 7-s intervals for the first 2 min, followed by samples at 3.5, 5, and 10 min (9 mL each); at 20, 30, 40, and 60 min (18 mL each); and at 75, 90, 105, and 120 min (9 mL each) after radiotracer injection. Aliquots of blood and plasma were measured for radioactivity in a γ-counter, which was cross-calibrated with the PET camera. Plasma samples collected at 3.5, 5, 10, 20, 30, 40, and 60 min were analyzed for radiolabeled metabolites of 11C-tariquidar and 11C-elacridar using a previously developed solid-phase extraction (SPE) assay (8). In brief, plasma (2–4 mL) was diluted with water (2 mL), spiked with unlabeled elacridar or tariquidar (10 μL, 20 mg/mL in dimethylsulfoxide), acidified with 5 M aqueous hydrochloric acid (40 μL), and loaded on a Sep-Pak vac tC18 cartridge (Waters Corp.), which had been preactivated with methanol (3 mL) and water (5 mL). The cartridge was first washed with water (5 mL) and then eluted with methanol (2 mL) followed by aqueous ammonium acetate buffer (0.2 M, pH 5.0, 1.5 mL). Radioactivity in all 3 fractions (plasma, water, and methanol/buffer) was quantified in a γ-counter. Radioactivity in the plasma and water fractions contained polar radiolabeled metabolites, whereas unchanged 11C-tariquidar and 11C-elacridar were recovered in the methanol/buffer fraction. Recoveries of 11C-tariquidar and 11C-elacridar from the methanol/buffer fraction of the SPE assay ranged from 91% to 94%. The methanol/buffer fractions from 10-, 20-, 30-, 40-, and 60-min samples were further analyzed for radiolabeled metabolites of 11C-tariquidar and 11C-elacridar by reversed-phase high-performance liquid chromatography (HPLC) using a binary gradient system (Supplemental Fig. 2 shows HPLC conditions; supplemental materials are available at http://jnm.snmjournals.org). Plasma input functions of 11C-tariquidar and 11C-elacridar were constructed by multiplying total activity concentrations in whole blood (from 0 to 60 min) with the mean ratios of plasma to whole-blood activity (determined from 3.5-, 5-, 10-, 20-, 30-, 40-, and 60-min blood samples) with or without correcting for the fraction of polar radiolabeled metabolites, as determined by SPE, and by subsequent linear interpolation of the activity data. Blood sampling, metabolite analysis, and input function generation for the (R)-11C-verapamil scan were performed as described previously (14,17). In addition, 4 venous 4-mL blood samples were collected from each subject at the end of the tariquidar infusion, at the end of the first PET scan, and at the beginning and end of the second PET scan to measure tariquidar plasma concentration levels using a previously described liquid chromatography–tandem mass spectrometry assay (18).
Image Analysis
T1-weighted MR images, acquired with an Achieva 3.0-T scanner (Philips), and the corresponding PET data were processed with Analyze 8.0 (Biomedical Imaging Resource; Mayo Foundation) and SPM5 (Wellcome Department of Imaging Neuroscience; University College London) software as described previously (14). By using the Hammersmith n30r83 3-dimensional maximum probability atlas of the human brain (19), we were able to apply a template of preset volumes of interest to the PET images to extract time–activity curves for the following 7 gray matter regions: whole brain, hippocampus, cerebellum, caudate nucleus, putamen, thalamus, and gyrus precentralis. These regions were chosen on the basis of a previous preclinical study (20). For comparison of time–activity curves between individual subjects, radioactivity concentrations (kBq/mL) were normalized to injected radiotracer amount and expressed as standardized uptake values (SUVs). Time–activity curves of total radioactivity in whole blood multiplied by individual fractions of blood volume in brain derived from kinetic modeling were used to correct brain time–activity curves for radioactivity in the vascular compartment.
Kinetic Modeling
For 11C-tariquidar and 11C-elacridar, datasets from 0 to 60 min of scan 1 (i.e., before tariquidar administration) were used for analysis. Standard 1-tissue 2-rate-constant (1T2K) and 2-tissue 4-rate-constant (2T4K) compartment models were fitted to the time–activity data of each volume of interest using plasma input functions either uncorrected or corrected for radiolabeled metabolites of 11C-tariquidar and 11C-elacridar. Time delays of 1–4 s were considered in the input functions to account for the differences in the time course of activity between the arterial catheter and the arterial capillaries in the brain. From the fits, rate constants K1 and k2 (1T2K model) and rate constants K1, k2, k3, and k4 (2T4K model), as well as blood volume fraction in brain, were estimated and the VT of the respective brain volume of interest was calculated. Fits were performed by software developed in-house using the method of weighted nonlinear least squares as implemented in the Optimization Toolbox of MATLAB (MathWorks). The quality of the fits was judged by visual inspection of observed and predicted activities together with the pattern of the residuals, by the correlation between observed and predicted activities, and by estimation of parameter uncertainties (SEs) from the diagonal elements of the covariance matrix as obtained from the inverse of the corresponding Fisher information matrix. Model selection (1T2K vs. 2T4K) was based on the Akaike information criterion (21). For (R)-11C-verapamil scans, a 2T4K model with plasma input function corrected for polar radiolabeled metabolites was used (17). Model outcome parameters obtained with the software developed in-house were cross-checked using the General Kinetic Modeling Tool in PMOD (version 2.6.1; PMOD group).
Analysis of ABCG2 and ABCB1 Single-Nucleotide Polymorphisms
Venous blood (4 mL) was drawn during the screening examination from all study participants for assessment of common ABCG2 and ABCB1 single-nucleotide polymorphisms (SNPs) using previously described procedures (22,23). The C421A variant (ABI TaqMan Genotyping Assay C__15854163_70; Applied Biosystems) was determined for ABCG2, and the C1236T, G2677T, and C3435T SNPs were determined for ABCB1.
Statistical Analysis
Statistical analysis was performed using Prism 5.0 software (GraphPad Software). A value of P less than 0.05 was considered significant.
RESULTS
Five subjects underwent 11C-tariquidar and (R)-11C-verapamil PET scans, and 1 subject underwent only an 11C-tariquidar PET scan. One subject was excluded from data analysis because of technical problems with generation of the input function of 11C-tariquidar. Five further subjects underwent 11C-elacridar and (R)-11C-verapamil PET scans.
There were no adverse or clinically detectable pharmacologic effects related to the radiotracers injected in any of the 11 subjects. Dysgeusia and orthostatic hypotonia occurred as adverse events in 4 and 2 subjects, respectively, and were most likely related to the infusion of unlabeled tariquidar.
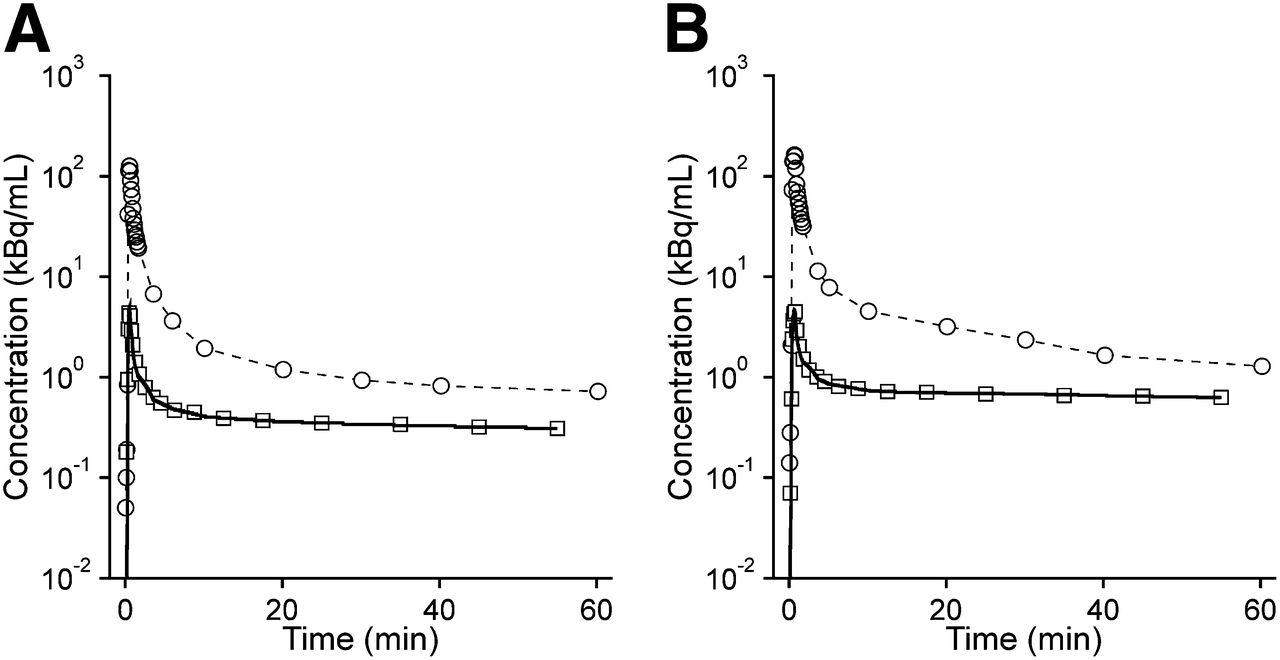
After the injection of 11C-tariquidar or 11C-elacridar, brain PET signal was low (∼0.1 SUV) and distributed uniformly throughout the brain, with the exception of intense focal uptake in the venous sinus and the choroid plexus (Fig. 2). Time–activity curves for 11C-tariquidar or 11C-elacridar in plasma and whole-brain gray matter are shown in Figure 3. One study subject who was scanned with 11C-elacridar (subject 10) showed 2- to 3-fold higher activity concentrations in plasma and 3- to 4-fold higher activity concentrations in brain (Supplemental Fig. 1) than were seen in the other study subjects and was therefore not included in the mean time–activity curves shown in Figure 3. At 60 min after injection of 11C-tariquidar or 11C-elacridar, unlabeled tariquidar was administered as an intravenous infusion over 30 min and PET data acquisition continued for a further 60 min (Fig. 1). In response to tariquidar infusion, there was a small but clearly visible rise in brain PET signal both for 11C-tariquidar and for 11C-elacridar, whereas plasma activity concentrations were essentially unchanged (Fig. 3). The brain PET signal (SUV) of 11C-tariquidar was increased on average by 27% ± 15% (P = 0.014, paired t test) at the end of scan 1, as compared with a time point before tariquidar infusion (45 min), whereas the PET signal of 11C-elacridar was increased by 21% ± 15% (P = 0.014). Interestingly, subject 10 showed only a weak response to tariquidar infusion (+4% increase in brain SUV, Supplemental Fig. 1). Plasma activity concentrations before and after tariquidar infusion were not significantly different between 11C-tariquidar (P = 0.368, paired t test) and 11C-elacridar (P = 0.283). In Supplemental Table 1, tariquidar plasma concentration levels at 4 different time points after tariquidar infusion are given for individual subjects.
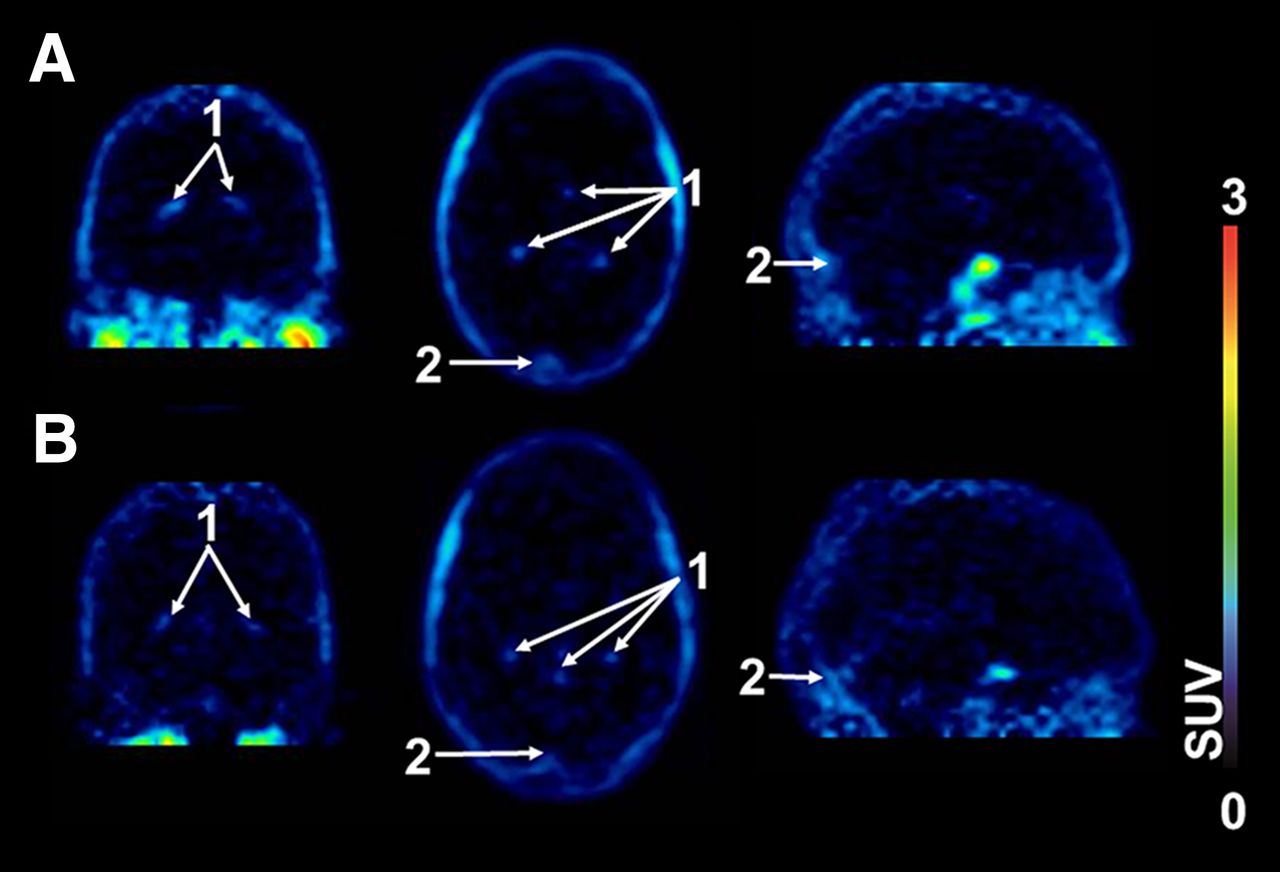
Representative PET summation images (0–60 min) of 11C-tariquidar (A) and 11C-elacridar (B) in coronal (left), transaxial (middle), and sagittal views (right). Activity concentration is expressed as SUV, and radiation scale is set from 0 to 3. Anatomic structures are labeled using arrows (1, choroid plexus; 2, venous sinus).

Time–activity curves (mean SUV ± SD) of 11C-tariquidar (□, n = 5) and 11C-elacridar (○, n = 4, subject 10 not included) in arterial plasma, uncorrected for radiolabeled metabolites (A), and in whole-brain gray matter, corrected for radioactivity in vasculature (B). Start of intravenous tariquidar infusion (3 mg/kg, over 30 min) is indicated by arrow.
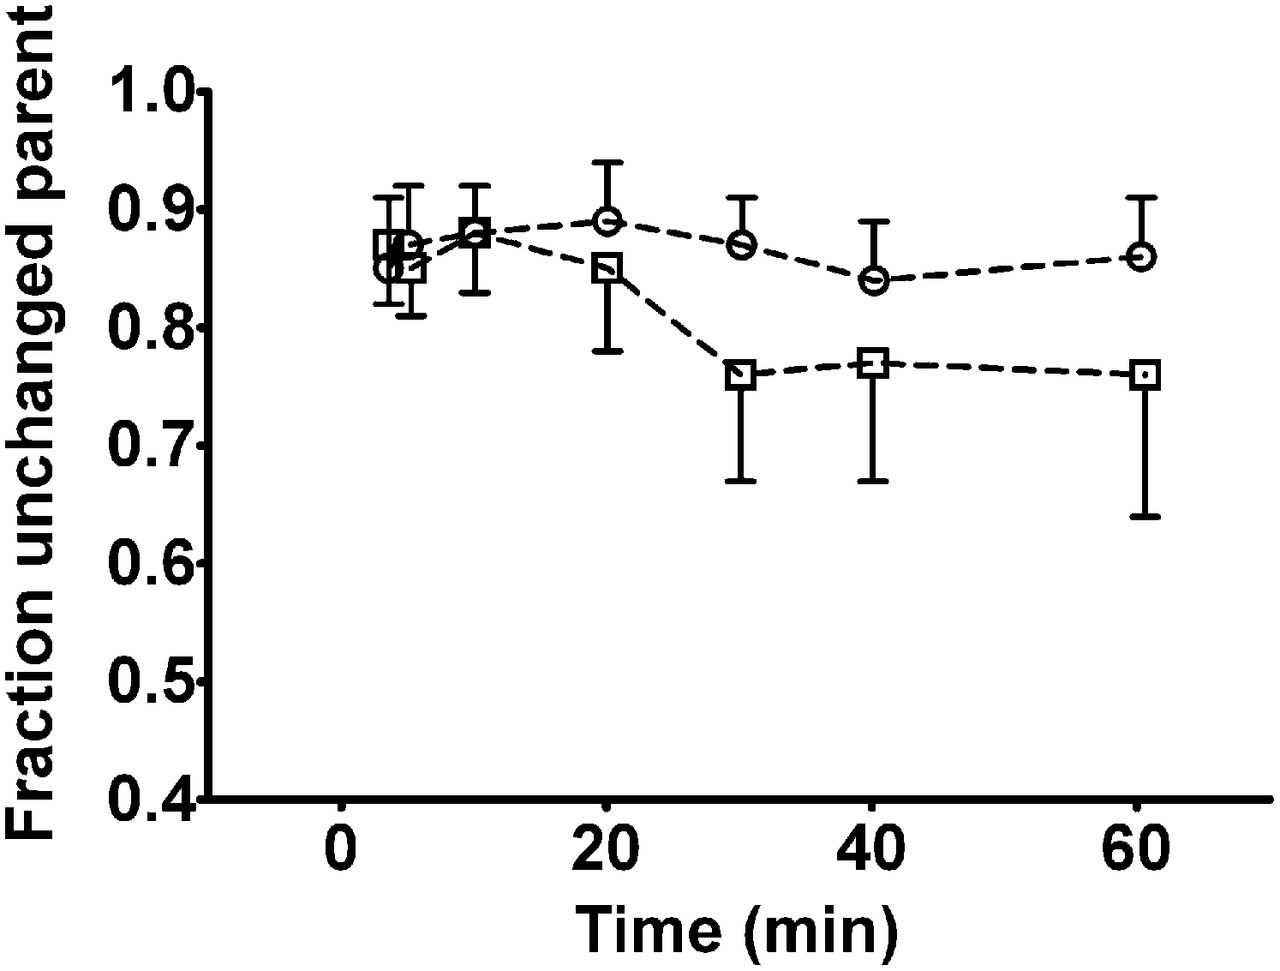
Radioactivity in plasma samples collected at time points between 3.5 and 60 min after injection was analyzed for radiolabeled metabolites of 11C-tariquidar and 11C-elacridar using a SPE/HPLC assay. At all studied time points, the fraction of polar radiolabeled metabolites of 11C-tariquidar and 11C-elacridar in plasma was less than 0.25 (Fig. 4). Radio-HPLC analysis of methanol/buffer eluates from the SPE assay did not show any radioactive species other than unchanged parent compound (Supplemental Fig. 2). Plasma–to–whole-blood ratios of total radioactivity over time were rather stable, that is, 1.34 ± 0.08, 1.39 ± 0.12, and 1.36 ± 0.08 at, respectively, 3.5, 30, and 60 min after injection of 11C-tariquidar (n = 5) and 1.51 ± 0.10, 1.51 ± 0.12, and 1.48 ± 0.10 at the same respective time points after injection of 11C-elacridar (n = 5).

Fractions (mean ± SD) of unchanged 11C-tariquidar (□, n = 5) and 11C-elacridar (○, n = 5) in arterial plasma over time as determined by SPE assay. Shown values are not corrected for recoveries of 11C-tariquidar and 11C-elacridar, which ranged from 91% to 94%.
Data were modeled using 1T2K and 2T4K models with plasma input functions either uncorrected (Table 1) or corrected (Supplemental Table 2) for radiolabeled metabolites. The 2T4K model provided better fits (i.e., lower Akaike information criterion values) than the 1T2K model. Representative 2T4K model fits for whole brain are shown in Figure 5. K4 values in the 2T4K model were low, pointing to partially irreversible behavior (Table 1). Outcome parameters were similar when metabolite-corrected or uncorrected input functions were used and supported the notion that the influence of radiolabeled metabolites on radiotracer kinetics was negligible. The VT and K1 values of subject 10 in whole brain were approximately 1.5-fold above average (2T4K: K1, 0.007; VT, 0.51), whereas other outcome parameters were within the reference range.

Representative fits (solid lines) from 2T4K model using plasma input functions uncorrected for radiolabeled metabolites (○) for whole-brain gray matter (□) for 11C-tariquidar (A) and 11C-elacridar (B).
Outcome Parameters for Whole-Brain Gray Matter of 1T2K and 2T4K Models* for 11C-Tariquidar and 11C-Elacridar
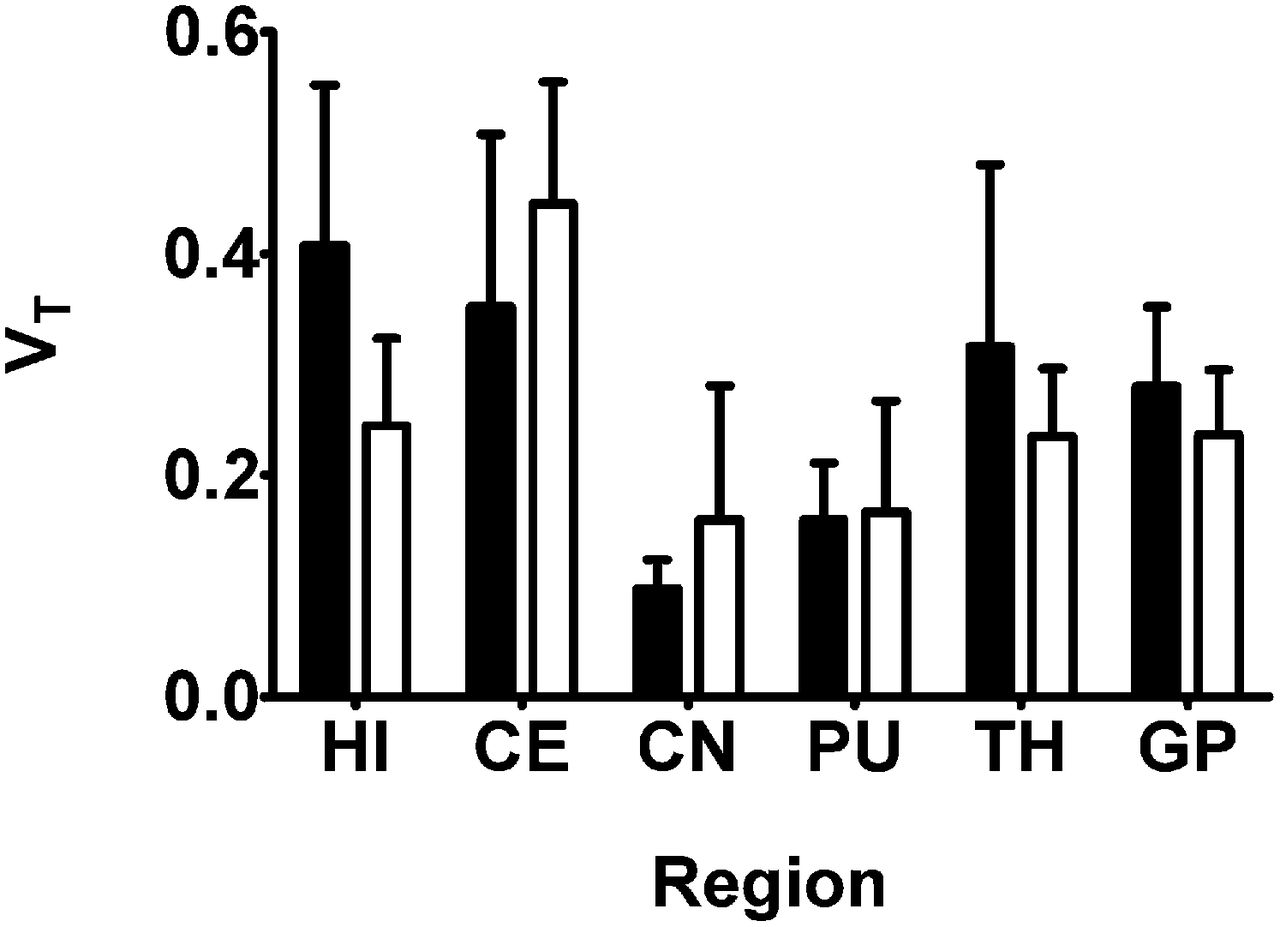
Regional 2T4K model-derived VTs of 11C-tariquidar and 11C-elacridar are shown in Figure 6. There was no statistically significant correlation between the VTs of 11C-tariquidar or 11C-elacridar and the VTs of (R)-11C-verapamil in different brain regions (Fig. 7). All study participants were genotyped for common functional SNPs of ABCG2 and ABCB1 (Supplemental Table 3). Subject 10 was a homozygous carrier of the TTT haplotype (1236T, 2677T, 3435T) in the ABCB1 gene but carried the wild-type ABCG2 C421A allele.

Mean (+SD) 2T4K model-derived VT values (using plasma input function uncorrected for radiolabeled metabolites) for 11C-tariquidar (black bars, n = 5) and 11C-elacridar (white bars, n = 4, subject 10 not included) in different brain regions. HI = hippocampus; CE = cerebellum; CN = caudate nucleus; PU = putamen; TH = thalamus; GP = gyrus precentralis.

Correlation of VTs of 11C-tariquidar (A, n = 5) and 11C-elacridar (B, n = 4, subject 10 not included) (using 2T4K model and plasma input function uncorrected for radiolabeled metabolites) with VTs of (R)-11C-verapamil in hippocampus, cerebellum, caudate nucleus, putamen, thalamus, and gyrus precentralis. Solid lines represent linear regression fits (r = Pearson correlation coefficient).
DISCUSSION
This study is, to our knowledge, the first to describe the brain distribution and pharmacokinetics of radiolabeled third-generation Pgp inhibitors in humans. We found that the brain PET signal of 11C-tariquidar and 11C-elacridar, when administered in tracer doses, was low (Fig. 2), as was consistent with previous in vitro and in vivo data suggesting that these substances are concentration-dependently transported by Pgp and BCRP at the BBB (6–11,16).
In analogy to a recent human PET study with (R)-11C-verapamil (17), we administered unlabeled tariquidar during the 11C-tariquidar and 11C-elacridar PET scans (Fig. 1). Administration of Pgp inhibitor during the PET scan has been shown to allow for detection of Pgp efflux transport of a radiotracer at the BBB (24). The used tariquidar dose (3 mg/kg), when given 1 h before the start of the PET scan, corresponded to the half-maximum-effect dose for inhibition of Pgp at the human BBB (18). Despite our use of a higher tariquidar dose in this study than in the previous (R)-11C-verapamil study (2 mg/kg), we observed a much less pronounced rise in brain PET signal of 11C-tariquidar and 11C-elacridar in response to tariquidar than for (R)-11C-verapamil (Fig. 3). The most likely explanation for this different behavior could be that (R)-11C-verapamil is transported only by Pgp at the human BBB whereas 11C-tariquidar and 11C-elacridar are dual Pgp/BCRP substrates. Even though tariquidar in pharmacologic doses is a dual Pgp and BCRP inhibitor, preclinical data suggest that higher doses than the presently used 3 mg/kg dose would be needed to inhibit BCRP (16). Therefore it can be assumed that although Pgp was at least half-maximally inhibited, BCRP was still fully functional during administration of a 3 mg/kg dose of tariquidar and that BCRP efflux may have effectively limited brain access of both radiotracers. This behavior is in fact completely in line with what would be expected from dual Pgp/BCRP substrates (2). It has now been documented in the literature for several dual Pgp/BCRP substrates that their brain uptake is only moderately increased in single-transporter knockout mice, that is, Mdr1a/b(−/−) or Bcrp1(−/−) mice, relative to wild-type mice, whereas disproportionally large increases are seen in combination knockout mice (Mdr1a/b(−/−)Bcrp1(−/−)) (1). This observation is because of a cooperative effect of both transporters in preventing brain distribution of dual substrates (1). In line with this finding, brain-to-blood ratios of 11C-tariquidar were found to be 1.0 ± 0.1 in wild-type, 3.3 ± 0.4 in Mdr1a/b(−/−), 1.8 ± 0.1 in Bcrp1(−/−), and 14.4 ± 1.7 in Mdr1a/b(−/−)Bcrp1(−/−) mice (9).
We used 1T2K and 2T4K models for analysis and found that the 2T4K model provided better data fits (Fig. 5; Table 1). Importantly, the fact that we observed only low levels of radiolabeled metabolites of 11C-tariquidar and 11C-elacridar in plasma during the time course of the PET scan (Fig. 4 and Supplemental Fig. 2) obviates correction of plasma input functions for radiolabeled metabolites. This poses a significant advantage over (R)-11C-verapamil, which is extensively metabolized and gives radiolabeled metabolites, which are partly taken up into brain and may thereby confound PET measurements with this radiotracer (25). K1 values of 11C-tariquidar and 11C-elacridar were up to 10-fold lower than those of (R)-11C-verapamil (Table 1) (17), suggesting that 11C-tariquidar and 11C-elacridar underwent efflux more effectively at the BBB than (R)-11C-verapamil. Washout of 11C-tariquidar and 11C-elacridar from the brain was slow (Fig. 3). The good fits obtained with the 2T4K model (Fig. 5) suggest the presence of a second, deep, brain compartment, the physiologic correlate of which may be intracellular trapping of radiotracer in lysosomes, as recently reported for tariquidar (26).
Interestingly, subject 10 had approximately 1.5-fold higher VT and K1 values of 11C-elacridar than the other subjects. Genetic analysis revealed that this subject was a homozygous carrier of the TTT haplotype in the ABCB1 gene, which has been associated in some studies with decreased Pgp expression and function and altered pharmacokinetics of Pgp substrate drugs (27). Thus, it is tempting to speculate that increased brain distribution of 11C-elacridar in subject 10 may have been caused by decreased Pgp function at the BBB, although this finding needs to be confirmed in a larger cohort.
The original intention of developing 11C-tariquidar and 11C-elacridar was to visualize Pgp expression levels in brain. To investigate any possible Pgp binding of 11C-tariquidar and 11C-elacridar at the BBB, we combined 11C-tariquidar and 11C-elacridar PET scans with (R)-11C-verapamil scans, after administration of a 3 mg/kg dose of tariquidar. We have shown previously that (R)-11C-verapamil PET scanning after half-maximal inhibition of Pgp is more sensitive to map regional differences in cerebral Pgp function than baseline scans (20), because brain uptake of (R)-11C-verapamil is relatively low in baseline scans, which may make it difficult to detect any further reduction in brain uptake due to regionally increased Pgp activity. Moreover, half-maximal Pgp inhibition may increase the percentage of (R)-11C-verapamil in the brain relative to its radiolabeled metabolites, which are not or are to a lower extent transported by Pgp (25), thereby providing better sensitivity for studying regional Pgp function in the brain. If 11C-tariquidar and 11C-elacridar bind to Pgp and (R)-11C-verapamil undergoes efflux by Pgp, brain uptake of 11C-inhibitors and 11C-substrates should in theory be inversely related; that is, brain regions with high uptake of 11C-inhibitor should show low uptake of 11C-substrate and vice versa. Such a behavior has in fact been observed in a study on rats in which the same paired-scan protocol was used as in the present study (13). Contrary to these preclinical results, we found no significant correlation between regional brain VTs of 11C-tariquidar or 11C-elacridar and (R)-11C-verapamil (Fig. 7). This lack of correlation strongly suggests that other than at the rodent BBB, where both 11C-tariquidar and 11C-elacridar appeared to undergo efflux by Pgp and also to bind to some extent to Pgp, possibly via distinct binding sites, the behavior of these probes at the human BBB is dominated by Pgp/BCRP efflux. A possible reason could be species-dependent differences in transporter expression levels at the human and rodent BBB. Shortly after we developed 11C-elacridar and 11C-tariquidar, data on absolute Pgp expression levels in isolated brain microvessels of various species, including humans, appeared in the literature (28). Using an LC/MS-based quantitative proteomics approach, the expression of MDR1 in isolated human brain microvessels was found to be 2.3-fold lower than that of mdr1a in mouse brain microvessels (6.1 ± 1.7 vs. 14.1 ± 2.1 fmol/μg of protein) (28). A commonly used predictor for the magnitude of specific signal that can be obtained with a radioligand for imaging of a molecular target is the ratio of the concentration of target protein in whole brain (Bmax) to the equilibrium dissociation constant (KD) of the radioligand (29). Bmax/KD is also referred to as binding potential and should ideally be greater than 5 to achieve measurable specific binding. To estimate the Bmax of Pgp in whole brain, one needs to know the density of brain capillary endothelial cells as a proportion of brain tissue. This value is different from total brain capillary volume (∼5%), which is much higher because it includes blood volume. Assuming a brain capillary endothelial cell volume of 0.2% of total brain volume (30) and a protein content of brain capillaries of 10%, the Bmax of Pgp in human brain is 1.3 nM. On the basis of a KD value for binding of 3H-tariquidar to Chinese hamster ovary resistant cells of 5.1 nM (4), the binding potential is 0.26, which is clearly too low to visualize Pgp in the human brain with 11C-tariquidar. Another factor that might contribute to the inability of 11C-tariquidar and 11C-elacridar to visualize Pgp density in the human brain could be that BCRP expression levels and BCRP/Pgp expression ratios are higher at the human than at the rodent BBB (BCRP expression [fmol/μg of protein]: humans, 8.14 ± 2.26; mouse, 4.41 ± 0.69; BCRP/Pgp expression ratio: humans, 1.3; mouse, 0.3) (28). Thus, a relatively higher contribution of BCRP efflux at the human than at the rodent BBB could further reduce any possible Pgp binding of 11C-tariquidar and 11C-elacridar at the human BBB. In contrast to the BBB, Pgp density in the previously investigated murine tumor model may have been higher and BCRP density lower, as could explain, possibly in combination with the absence of tight junctions in tumor capillaries, why 11C-tariquidar was able to visualize Pgp expression in the tumor model (12). More generally, the ability of 11C-tariquidar and 11C-elacridar to provide a Pgp-binding signal may be tissue-specific, depending on Pgp relative to BCRP expression levels. Following these considerations, an effective radioligand to visualize Pgp density in the human brain should ideally possess an at least 10-fold higher Pgp binding affinity than tariquidar and not be transported by BCRP and Pgp.
Despite the inability of 11C-tariquidar and 11C-elacridar to visualize cerebral Pgp density, these probes may find use as an entirely new class of PET tracers (as opposed to Pgp-selective substrates such as (R)-11C-verapamil or 11C-N-desmethyl-loperamide) to study the interplay of Pgp and BCRP at the human BBB in limiting brain uptake of dual substrates (16). This use would be important because several clinically applied drugs (e.g., tyrosine kinase inhibitors) are dual substrates of Pgp and BCRP (1) and no dual Pgp/BCRP substrates are currently available for PET studies in humans. Thus, 11C-tariquidar or 11C-elacridar could be used as generic probes to assess brain penetration of dual Pgp/BCRP substrates in healthy subjects or glioma patients under various conditions—for example, after treatment with Pgp/BCRP inhibitors such as elacridar or in subjects with functional SNPs in the ABCG2 or ABCB1 genes.
CONCLUSION
The brain PET signal of 11C-tariquidar and 11C-elacridar was found to be low in humans and only moderately sensitive to a pharmacologic challenge with unlabeled tariquidar, consistent with the behavior of dual Pgp/BCRP substrates. 11C-tariquidar and 11C-elacridar were not able to visualize Pgp density in the human brain, thus highlighting the considerable challenge in visualizing low-density multidrug efflux transporters at the human BBB with PET and furthermore suggesting that compounds with subnanomolar Pgp binding affinities, which are currently not available, may be needed to develop successful radioligands. Despite their inability to visualize Pgp density, 11C-tariquidar and 11C-elacridar may find future clinical use as an entirely new class of radiotracers to assess the interplay of Pgp and BCRP at the human BBB.
DISCLOSURE
The costs of publication of this article were defrayed in part by the payment of page charges. Therefore, and solely to indicate this fact, this article is hereby marked “advertisement” in accordance with 18 USC section 1734. This study was supported by the European Community’s Seventh Framework program (grant 201380) and the Austrian Science Fund (FWF) (grant F 3513-B20). No other potential conflict of interest relevant to this article was reported.
Acknowledgments
We thank Georgios Karanikas and the staff of the PET center at the Department of Nuclear Medicine and Research Nurse Maria Weber for their support in performing this study, Elisabeth Ponweiser and Raute Sunder-Plassmann for analysis of ABCB1 SNPs, and Michaela Böhmdorfer for measurement of tariquidar plasma concentrations. Divya Maheshwari (AzaTrius Pharmaceuticals Pvt. Ltd.) is acknowledged for providing tariquidar for intravenous injection, Joseph W. Polli (GlaxoSmithKline, Inc.) for providing the Investigator’s Brochure for elacridar, and Marie-Claude Asselin from the Wolfson Molecular Imaging Centre (Manchester, U.K.) for providing valuable input into kinetic modeling of PET data.
Footnotes
Published online Jul. 5, 2013
- © 2013 by the Society of Nuclear Medicine and Molecular Imaging, Inc.
REFERENCES
- Received for publication December 7, 2012.
- Accepted for publication April 19, 2013.


Jump to section
Related Articles
Cited By...
- Impact of P-Glycoprotein Function on the Brain Kinetics of the Weak Substrate 11C-Metoclopramide Assessed with PET Imaging in Humans
- A Proof-of-Concept Study to Inhibit ABCG2- and ABCB1-Mediated Efflux Transport at the Human Blood-Brain Barrier
- Elucidation of the Impact of P-glycoprotein and Breast Cancer Resistance Protein on the Brain Distribution of Catechol-O-Methyltransferase Inhibitors
- Whole-Body Distribution and Radiation Dosimetry of 11C-Elacridar and 11C-Tariquidar in Humans
- The multidrug transporter ABCG2: still more questions than answers
- Role of (Drug) Transporters in Imaging in Health and Disease
- Role of P-Glycoprotein in the Distribution of the HIV Protease Inhibitor Atazanavir in the Brain and Male Genital Tract