


Abstract
We sought to evaluate the accuracy of myocardial perfusion imaging (MPI) using cadmium-zinc-telluride (CZT) SPECT cameras for the measurement of left ventricular (LV) global and regional function, and the performance of absolute wall motion (WM) and wall thickness (WT) measurements for the detection of myocardial scarring, using cardiac MR as a reference. Methods: Sixty patients with known or suspected coronary artery disease underwent MPI using a CZT SPECT camera, as well as cine and delayed enhanced cardiac MR. Gated MPI data were processed using quantitative gated SPECT software. LV global function was assessed by measuring LV end-diastolic volume (EDV), end-systolic volume (ESV), and ejection fraction (EF). Regional function was assessed by quantifying segmental WM and WT according to the 17-segment model. Myocardial scarring was quantified on each segment using delayed enhanced cardiac MR. Agreement between SPECT and cardiac MR was assessed using Pearson correlation and Bland–Altman analyses. The influence of measurement magnitude on the agreement was analyzed using Spearman correlation coefficients between the mean and SD of measurements. The performance of WM and WT for the detection of segments with more than 25% scar transmurality was assessed using receiver-operating-characteristic analysis. Results: Correlation between methods was excellent for EF (R = 0.81, P < 0.0001) and ESV (R = 0.88, P < 0.0001) and was good for EDV (R = 0.71, P < 0.0001). Agreement was good for EF (bias, −2.7%; limits of agreement, −15.5 to +10.1) but was lower for EDV (bias, −29.7 mL; limits of agreement, −68.3 to +8.9) and ESV (bias, −9.9 mL; limits of agreement, −30.7 to +10.9). Correlation between methods was fair for WM (R = 0.49, P < 0.0001) and WT (R = 0.48, P < 0.0001). SPECT underestimated WT (bias, −41%; limits of agreement, −108 to +26), with an error depending on thickening magnitude (ρ = 0.70, P < 0.0001). The agreement in WM measurement was higher (bias, −1.4 mm; limits of agreement, −6.9 to +4) and independent of motion magnitude (ρ = 0.006, P = 0.86). WM and WT were equally able to identify scarred segments (area under the receiver-operating-characteristic curve, 0.74 ± 0.03 and 0.74 ± 0.03, respectively). Conclusion: MPI using CZT SPECT cameras and quantitative gated SPECT analysis accurately quantifies EF but still underestimates LV volumes. WM shows a higher agreement with cardiac MR than does WT, with errors in WT measurement increasing at greater thicknesses. Absolute quantification of segmental WM and WT can equally be used to identify myocardial scarring.
- myocardial perfusion imaging
- SPECT
- cadmium-zinc-telluride detector
- left ventricular function
- cardiac magnetic resonance
Left ventricular dysfunction is a major determinant of clinical outcome in patients with coronary artery disease (1–3). Myocardial perfusion SPECT is a widespread method used for the diagnosis and risk stratification of patients with coronary artery disease (4). Besides perfusion, electrocardiography-gated acquisitions allow for the analysis of left ventricular (LV) global and regional systolic function (5–7). In the routine analysis of clinical studies, the assessment of LV volumes and ejection fraction (EF) has important implications for the prediction of patient outcome (8). The assessment of regional wall motion (WM) or wall thickness (WT), when combined with perfusion data, has proven useful for tissue characterization (9) and prediction of segment recovery (10,11). Recently, a new acquisition technology has emerged, combining semiconductor cadmium-zinc-telluride (CZT) detectors with higher count sensitivity, a new camera geometry, and new reconstruction algorithms (12). These advances have an impact on image quality in terms of myocardial counts, energy resolution, spatial resolution, and temporal resolution (13–15) and are likely to modify the performance of the method for analyzing LV global and regional function. However, preliminary validation studies have focused on the detection of perfusion defects (16–18), and functional parameters have not been thoroughly studied. The aim of this study was to validate myocardial perfusion imaging (MPI) using CZT SPECT cameras for the quantification of LV global and regional function, using cardiac MR as a reference (19,20). Specific objectives were to evaluate the agreement between MPI SPECT and cardiac MR for the measurement of EF, EDV, ESV, segmental WM, and segmental WT and to evaluate the diagnostic performance of absolute quantitative WT and WM measurements for the detection of myocardial scarring, as defined by delayed enhanced cardiac MR.
MATERIALS AND METHODS
Population
From October 2010 to May 2011, this study prospectively included 60 patients (50 men and 10 women; mean age ± SD, 62 ± 11 y; range, 36–82 y) with known or suspected coronary artery disease referred for routine MPI SPECT. Coronary artery disease was suspected in 22 patients and known in 38. Percutaneous coronary intervention had been performed on 36 patients, and coronary artery bypass grafting on 8. Exclusion criteria were contraindications to gadolinium-enhanced cardiac MR, presence of atrial fibrillation, and presence of chest pain at rest. The study was approved by the local Institutional Review Board. All patients gave written informed consent.
Gated MPI SPECT Acquisition and Analysis
All rest images analyzed in this study were part of a routine 1-d rest–stress protocol using 99mTc-tetrofosmin. The rest isotope dose was 259–370 MBq, depending on patient’s weight. Rest images were acquired with the patient prone 30 min after tracer injection using a CZT camera (Discovery NM 530c; GE Healthcare). The imaging time was 7 min. Acquisitions were preceded by automatic heart positioning in the optimal area, or “quality field of view,” using real-time persistence imaging. All acquisitions were electrocardiography-gated, and the cardiac cycle was divided into 16 equal intervals. Maximum-penalized-likelihood iterative reconstruction was performed on all gates using a dedicated iterative algorithm with integrated collimator geometry modeling. A Butterworth postprocessing filter (frequency, 0.37; order, 7) was applied to the reconstructed axial slices, which were subsequently reformatted in the standard cardiac axis for analysis (short axis, vertical long axis, and horizontal long axis). Images were analyzed with a commercially available software package (QPS/QGS; Cedars-Sinai Medical Center). Image reorientation and analysis was performed by 1 observer (7 y of experience in nuclear cardiology) who was unaware of the cardiac MR results and clinical data. Automatic processing was performed in all cases, with the option of manual correction in cases of inadequate anatomic delineation. LV volumes and EF were calculated as described previously (5) and expressed in milliliters (EDV and ESV) or percentage (EF). To study the influence of patient habitus, LV volumes were also indexed to body surface area and expressed in mL/m2. WM and WT were calculated as described previously (6) and expressed in millimeters (WM) or percentage (WT). WM and WT values were assessed on 16 segments according to the 17-segment model of the American College of Cardiology and the American Heart Association (apical segment was excluded from analysis). To study the impact of perfusion defects on the quantification of global and regional metrics, the automatic quantification of resting defects by QPS was recorded on each segment and categorized as follows: 0, no defect; 1, mild defect; 2, moderate defect; and 3, severe defect. Additionally, the total perfusion defect index was automatically computed for each patient.
Cardiac MR Acquisition and Analysis
Cardiac MR studies were performed on a 1.5-T clinical scanner equipped with a 32-channel cardiac coil (Avanto; Siemens Medical Solutions). The mean delay between SPECT and cardiac MR studies was 22 d (range, 0–38 d). Cine imaging was performed to acquire a stack of short-axis slices covering the whole left ventricle from base to apex, using an electrocardiography-gated balanced steady-state free-precession breath-hold sequence with the following parameters: repetition time/echo time, 20–30/1.4 ms; flip angle, 60°; slice thickness, 6 mm; pixel size, 1.6 × 1.6 to 1.8 × 1.8 mm; and 20 frames per cardiac cycle. Delayed enhanced imaging was performed to acquire a stack of short-axis slices covering the whole left ventricle from base to apex. Acquisition was initiated 15 min after the injection of a 0.2 mmol/kg dose of gadoterate meglumine (Dotarem; Guerbet) using an inversion-recovery–prepared 3-dimensional turbo fast low-angle–shot breath-hold sequence with the following parameters: repetition time/echo time, 700/1.4 ms; flip angle, 10°; slice thickness, 6 mm; and pixel size, 1.8 × 1.4 mm. Inversion time was optimized on a previously acquired scouting sequence (21). Data were exported to a separate workstation for analysis using a commercially available software package (MASS, version 7.0; Medis Medical Imaging Systems). Image segmentation was performed by 1 observer (8 y of experience in cardiac imaging) who was unaware of the SPECT results and clinical data. Endocardial and epicardial contours were segmented on end-diastolic and end-systolic frames at each short-axis location. LV trabeculae and papillary muscles were excluded from the LV cavity and considered as part of the LV wall. EDV and ESV were computed in milliliters using the modified Simpson rule (19) and used to calculate EF, expressed as percentage. To study the influence of patient habitus, LV volumes were also indexed to body surface area and expressed in mL/m2. Additional endocardial segmentation was performed excluding LV trabeculae and papillary muscles from the LV wall, in order to compute regional function parameters. WM and WT were assessed on 16 segments according to the 17-segment model of the American College of Cardiology and the American Heart Association, using a modified centerline method (22). WM was defined as the average inward radial displacement of the segment from end-diastole to end-systole, expressed in millimeters. WT was defined as the percentage change in mean segmental wall thickness from end-diastole to end-systole. Delayed enhanced short-axis images were segmented at a different time point by the same observer, who did not know the results of cine imaging. Endo- and epicardial contours were manually traced and the myocardial scar was automatically segmented with a threshold set at 50% maximal signal intensity (23). Segments with significant scarring were defined as exhibiting more than 25% average scar transmurality (24,25).
Statistical Analysis
Continuous data are expressed as mean ± SD or as median and interquartile range when appropriate. The Shapiro–Wilk test of normality and z scores for skewness and kurtosis were used to assess whether quantitative data conformed to the normal distribution. SPECT and cardiac MR parameters were compared with the Student paired t test or Wilcoxon signed-rank test, depending on data normality. Agreement between methods was evaluated using the Pearson correlation coefficient (R) and Bland and Altman analysis. The influence of measurement magnitude on the agreement was analyzed by calculating the Spearman correlation coefficient (ρ) between the mean and SD of measurements. To study the influence of patient habitus, agreement between methods was also analyzed on LV volumes indexed to body surface area, and the correlation between body surface area and biases in EDV, ESV, and EF (bias between cardiac MR and SPECT being defined as the SD of the 2 measures) was assessed. To study the influence of perfusion defects on EDV, ESV, and EF, intermethod biases were compared between patients exhibiting moderate-to-severe defects and patients with no such defects. Additionally, the correlation between intermethod biases and total perfusion defect was assessed. To study the influence of perfusion defects on WM and WT quantification, intermethod biases were compared between segments with no defect at QPS quantification and other segments. Additionally, the correlation between intermethod biases and QPS quantification was studied. The diagnostic performance of WT and WM at SPECT and cardiac MR was assessed using receiver-operating-characteristic (ROC) curve analysis. Areas under ROC curves were compared using z statistics. All statistical tests were 2-tailed. A P value of less than 0.05 was considered statistically significant. Analyses were performed using NCSS, version 2001 (NCSS Statistical Software), except agreement analysis, which was performed using Excel (Microsoft Corp.).
RESULTS
Global LV Function
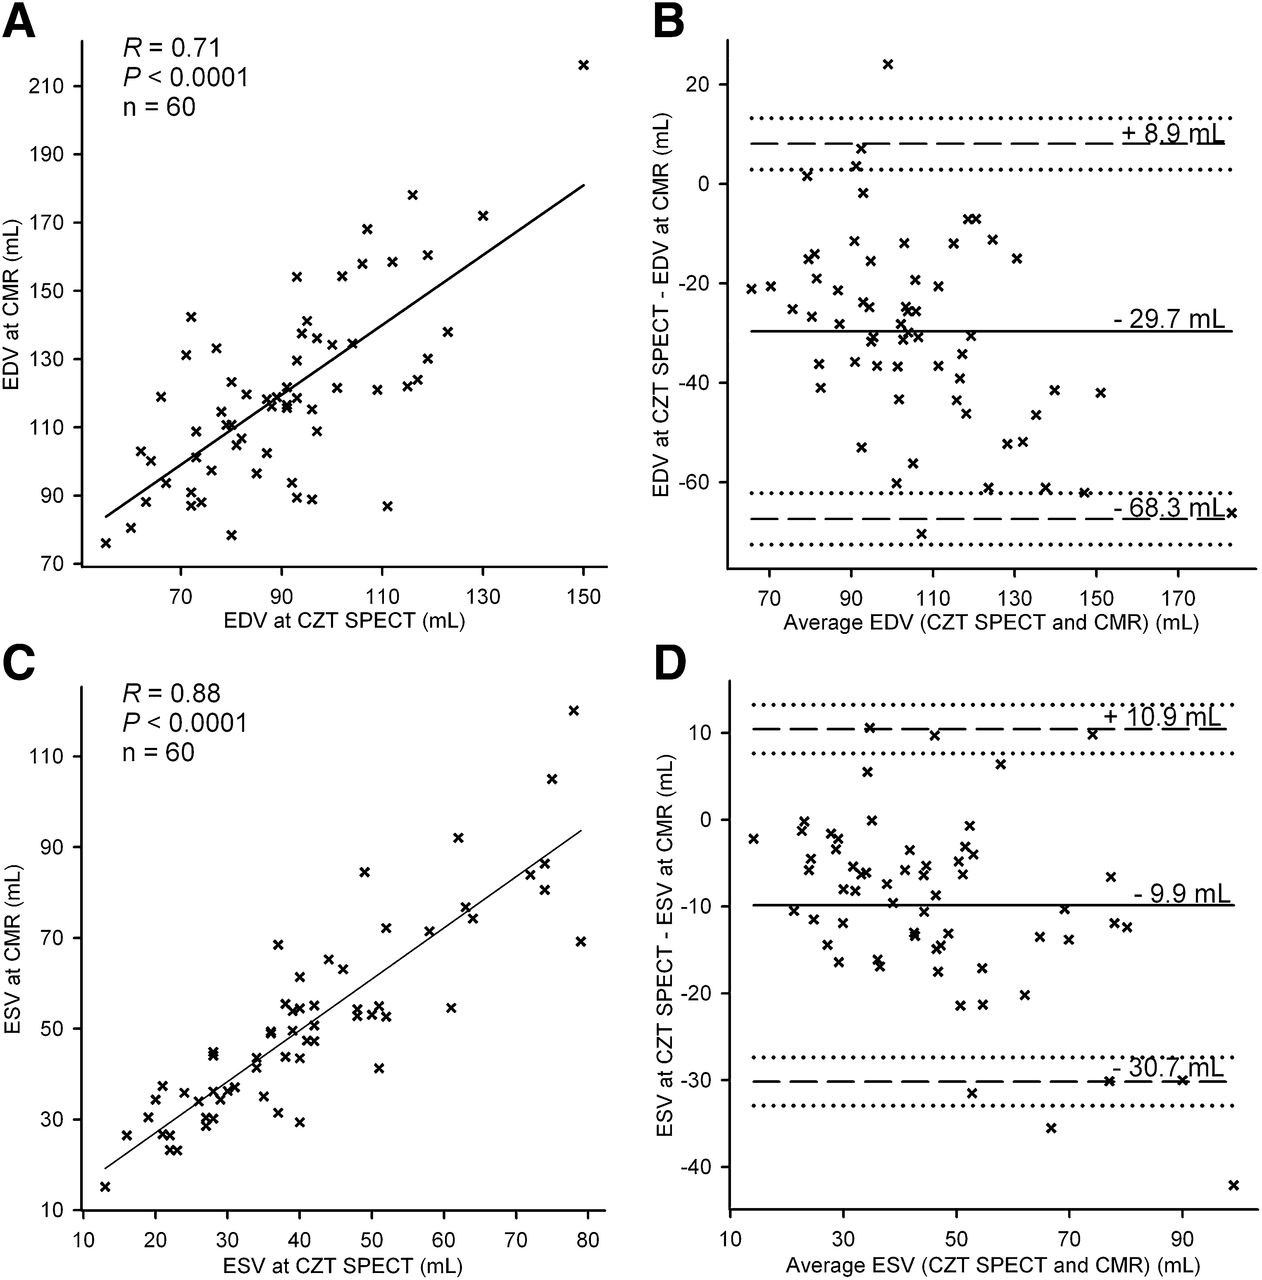
Mean values of EDV, ESV, and EF from CZT MPI SPECT and cardiac MR are shown in Table 1. The agreement between CZT SPECT and cardiac MR is illustrated in Figure 1 for the quantification of EF and in Figure 2 for the quantification of LV volumes. The correlation between SPECT and cardiac MR was good for EDV (R = 0.71, P < 0.0001), excellent for ESV (R = 0.88, P < 0.0001), and excellent for EF (R = 0.81, P < 0.0001). The agreement between SPECT and cardiac MR was high for EF measurements (mean bias, −2.7%; 95% limits of agreement, −15.5% to +10.1%). The bias in EF measurements was independent of EF magnitude (ρ = −0.09, P = 0.47). The agreement between SPECT and cardiac MR was lower for the measurement of EDV (mean bias, −29.7 mL; 95% limits of agreement, −68.3 to +8.9 mL) and ESV (mean bias, −9.9 mL; 95% limits of agreement, −30.7 to +10.9 mL). The bias in EDV and ESV was dependent on the magnitude of measurements, with higher errors found as volumes increased (ρ = 0.44, P < 0.0001, for EDV; ρ = 0.49, P < 0.0001, for ESV). When LV volumes were indexed to body surface area, the correlation between SPECT and cardiac MR was good for indexed EDV (R = 0.67, P < 0.0001) and excellent for indexed ESV (R = 0.87, P < 0.0001). The agreement between SPECT and cardiac MR was similar to that observed for absolute volumes (indexed EDV: mean bias, −15.5 mL/m2; 95% limits of agreement, −35.4 to +4.1 mL/m2; indexed ESV: mean bias, −5.1 mL/m2; 95% limits of agreement, −15.9 to +5.7 mL/m2). The bias between SPECT and cardiac MR correlated poorly with body surface area for EDV (R = 0.33, P = 0.009) and EF (R = 0.30, P = 0.02). No such correlation was found for ESV (R = 0.18, P = 0.15).
Values of EDV, ESV, and EF from MPI CZT SPECT and Cardiac MR

Agreement between MPI CZT SPECT and cardiac MR (CMR) for measurement of EF. Correlation analysis (A) and Bland and Altman plot (B) are shown. Continuous horizontal lines denote mean bias; dashed horizontal lines denote ±95% limits of agreement.

Agreement between MPI CZT SPECT and cardiac MR (CMR) for measurement of left ventricular volumes. Correlation analysis (A and C) and Bland and Altman plots (B and D) are shown for measurement of EDV (A and B) and ESV (C and D). Continuous horizontal lines denote mean bias; dashed horizontal lines denote ±95% limits of agreement.
Regional LV Function
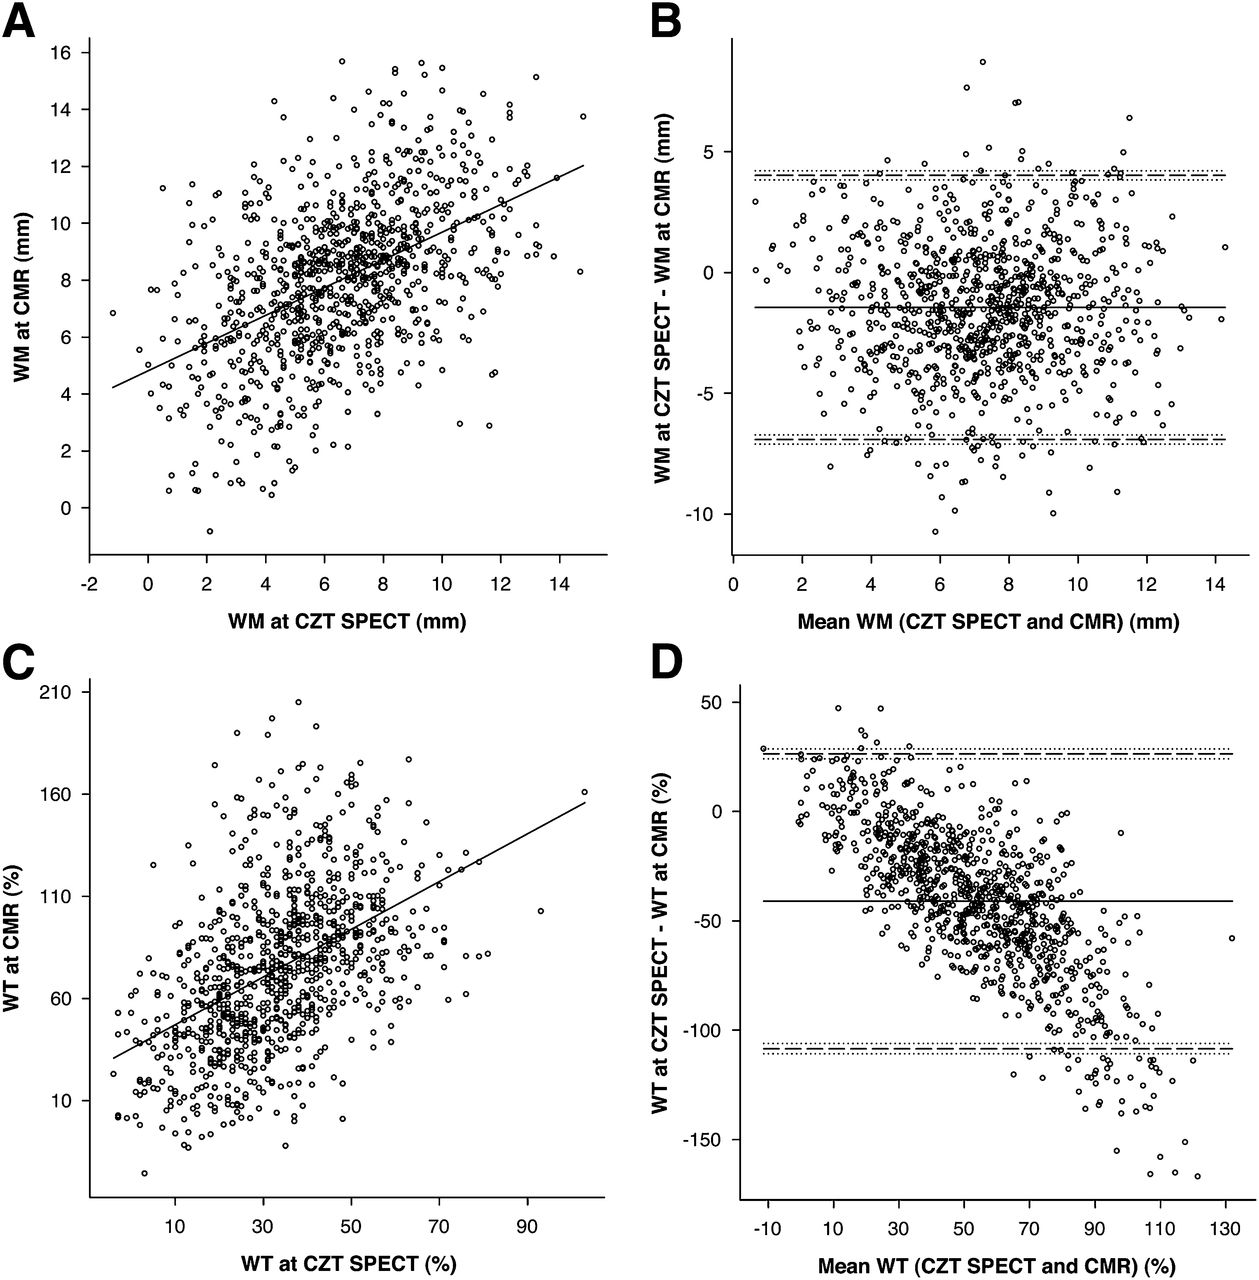
WM and WT were assessed on 960 segments. WM was 6.6 ± 2.8 mm (range, −1.2 to 14.8 mm) at SPECT and 8.0 ± 2.8 mm (range, −0.8 to 15.7 mm) at cardiac MR (P < 0.0001). WT was 33% ± 16% (range, −4% to 103%) at SPECT and 74% ± 39% (range, −26% to 205%) at cardiac MR (P < 0.0001). Correlation analyses and Bland and Altman plots are shown in Figure 3. The correlation between SPECT and cardiac MR was fair for both WM (R = 0.49, P < 0.0001) and WT (R = 0.48, P < 0.0001). The agreement between SPECT and cardiac MR was poor for WT (mean bias, −41%; 95% limits of agreement, −108% to +26%). The bias in WT was dependent on the magnitude of measurements, with higher errors found as thickness increased (ρ = 0.70, P < 0.0001). Agreement between methods for WM measurement was higher (mean bias, −1.4 mm; 95% limits of agreement, −6.9 to +4 mm) and independent of motion magnitude (ρ = 0.006, P = 0.86).

Agreement between MPI CZT SPECT and cardiac MR (CMR) for measurement of LV regional function. Correlation analysis (A and C) and Bland and Altman plots (B and D) are shown for measurement of WM (A and B) and WT (C and D). Continuous horizontal lines denote mean bias; dashed horizontal lines denote ±95% limits of agreement.
Influence of Perfusion Defects on CZT SPECT Quantification
Moderate or severe perfusion defects at rest were found in 16 of 60 patients. Bias between SPECT and cardiac MR for the measurement of ESV was greater in patients exhibiting moderate-to-severe defects than in patients with no such defects (SD between SPECT and cardiac MR, 10.4 ± 5.2 vs. 7.1 ± 6.4 mL, respectively, P = 0.004). No such difference was found for EDV and EF measurements (SD between SPECT and cardiac MR: 23.5 ± 12.2 vs. 21.2 ± 12.3 mL [P = 0.54] for EDV and 4.7% ± 2.9% vs. 3.7% ± 2.9% [P = 0.15] for EF). A poor correlation was found between total perfusion defect and bias between SPECT and cardiac MR for the measurement of ESV (R = 0.28, P = 0.03). No such correlation was found for EDV and EF measurements (R = −0.01, P = 0.96, and R = 0.13, P = 0.33, respectively). A significant perfusion defect at rest, defined as a QPS quantification of greater than 0, was found in 149 of 960 segments. Biases between SPECT and cardiac MR for the measurement of WM and WT did not differ between segments exhibiting significant perfusion defects and other segments (SD between SPECT and cardiac MR: 1.84 ± 1.43 vs. 1.75 ± 1.34 mm [P = 0.58] for WM and 32.6% ± 24.1% vs. 30.5% ± 21.5% [P = 0.51] for WT). No significant correlation was found in segmental QPS quantification and bias between SPECT and cardiac MR for WM and WT measurements (R = 0.02, P = 0.53, and R = 0.02, P = 0.44, respectively).
Thickness and Motion Performance for Scar Detection
Significant scarring (>25% average transmurality) was exhibited by 101 of 960 segments. The results of ROC analysis for the detection of scarring are presented in Table 2. All parameters were significantly able to identify scarred segments. When areas under ROC curves were compared, no difference was found between WT and WM at SPECT (0.74 ± 0.03 vs. 0.74 ± 0.03, respectively, P = 0.94) or at cardiac MR (0.86 ± 0.02 vs. 0.85 ± 0.02, respectively, P = 0.59). The diagnostic performance was higher at cardiac MR for both WT and WM parameters (P < 0.0001).
Performance of WT and WM at MPI CZT SPECT and Cardiac MR for Detection of Scar
Influence of Segment Location
ROC curves for the detection of segments with greater than 25% average scar transmurality are presented in Figure 4 according to each segment location (anterior, septal, posterior, or lateral). At cardiac MR, the area under the ROC curve for the anterior, septal, posterior, and lateral locations were, respectively, 0.84 ± 0.04, 0.89 ± 0.03, 0.82 ± 0.05, and 0.92 ± 0.04 for WT and 0.86 ± 0.04, 0.86 ± 0.03, 0.77 ± 0.06, and 0.91 ± 0.04 for WM. No significant difference was found between locations (P range, 0.06–0.96). At SPECT, the areas under the ROC curve for the anterior, septal, posterior, and lateral locations were, respectively, 0.78 ± 0.06, 0.67 ± 0.06, 0.68 ± 0.07, and 0.85 ± 0.05 for WT and 0.72 ± 0.05, 0.74 ± 0.05, 0.69 ± 0.07, and 0.86 ± 0.04 for WM. WT was more accurate at the lateral location than at the septal location (P = 0.04). WM was more accurate at the lateral location than at the anterior and inferior locations (P = 0.02 and P = 0.02, respectively).

Detection of myocardial scar according to segment location. ROC curves corresponding to anterior, septal, inferior, and lateral locations are shown for WT at cardiac MR (A), WM at cardiac MR (B), WT at MPI CZT SPECT (C), and WM at MPI CZT SPECT (D).
DISCUSSION
This study was, to our knowledge, the first validation of MPI SPECT using CZT cameras for the evaluation of LV global and regional function. Studying 60 patients with a representative range of LV dysfunction, we demonstrated that quantification of EF using QGS analysis is accurate, although it still underestimates ventricular volumes. WM assessed with the modified centerline method showed a higher agreement with cardiac MR than did WT assessed with the count curve method. Absolute quantification of segmental WM and WT can equally be used as an additional parameter to identify myocardial scarring on MPI SPECT studies.
This study demonstrates excellent agreement between CZT SPECT and cardiac MR for the measurement of EF. An underestimation of EF by MPI SPECT using QGS analysis has been consistently reported in previous studies using standard dual-detector cameras (26–33). Our results suggest that CZT SPECT cameras might be more accurate, with a minimal systematic bias (−2.7%) that might have limited clinical relevance. In contrast, a substantial bias was found in the measurement of ventricular volumes. This result is consistent with previous studies that compared QGS analysis with cardiac MR, reporting an underestimation of ventricular volumes even with 16-frame gating (29,34,35). Our results showed that this underestimation persists with CZT SPECT cameras, despite a higher spatial resolution. The remaining underestimation is likely to be due to the definition of the aortic and mitral planes, a systematic error that is inherent in MPI SPECT datasets, because the basal septum and valvular annuli do not contain myocytes. The LV base and outflow tract are therefore incompletely segmented at MPI SPECT, whereas the MRI segmentation extends to the insertions of the aortic and mitral valves. In the present study, although a poor correlation was found between body surface area and biases in EDV and EF, the agreement between SPECT and cardiac MR was similar when LV volumes were indexed to body surface area. Additionally, our results showed that the presence and extent of perfusion defects have no significant impact on EDV and EF quantification and only a minor impact on ESV quantification. These results suggest that the quantification of LV global function by CZT SPECT is poorly affected by patient habitus and scar burden.
Prior studies have reported good agreement between MPI SPECT and cardiac MR for the qualitative evaluation of LV regional function (36,37). The ability to rely on an automatic and absolute quantification might have significant implications for both research purposes and patient management. This study demonstrated a fair correlation between CZT SPECT and cardiac MR for the absolute quantification of segmental WM and WT. However, we found a significant underestimation of WT at CZT SPECT that was highly dependent on thickness magnitude, with maximal errors being found at high WT values. This underestimation might be related to a loss of linearity between myocardial thickness and myocardial count curves using CZT cameras. Indeed, the method for calculation of WT at MPI SPECT is directly related to the partial-volume effect, which is highly dependent on the intrinsic spatial resolution of the system. The relationship between thickness and myocardial count is theoretically lost when thickness is greater than twice this resolution (38,39). This effect was limited using standard dual-detector cameras because of their spatial resolution (∼1 cm). Validation studies of CZT cameras report a gain in spatial resolution by a factor of 2 (14); thus, this saturation effect on WT quantification might become significant. However, one might advocate that this issue is of little relevance from a clinical point of view because decreased values matter more than increased ones when assessing functional disorders. In contrast, the bias between CZT SPECT and cardiac MR for WM measurements was lower and not related to motion magnitude. Indeed, the modified centerline method used for the calculation of WM would rather be improved than altered by an increase in spatial resolution. Therefore, WM values might become more relevant than WT values for the quantitative evaluation of regional function with CZT cameras. To our knowledge, the only study that compared MPI SPECT and cardiac MR quantitative data on regional function was that by Nichols et al. (40). Using a standard dual-detector camera and the Emory Cardiac Toolbox (ECTb; Emory University) to analyze regional WT, this study found the quantitative approach to be superior to visual analysis for the identification of segments with abnormal WT, as defined by cardiac MR. In the current study, WT values were higher than reported by Nichols et al. (33% ± 16% vs. 21% ± 16%). This difference might be due to our use of a different software program to process WT, our population with slightly less LV dysfunction (EF, 56% vs 50%), and a higher number of frames in our study (16 vs. 8). In the present study, biases between SPECT and cardiac MR for the measurement of WM and WT did not differ between segments exhibiting significant perfusion defects and other segments. Additionally, no significant correlation was found between segmental QPS quantification and bias between SPECT and cardiac MR for WM and WT measurements. We therefore conclude that perfusion defects do not seem to influence the quantification of LV regional function at CZT SPECT.
To our knowledge, this study was also the first on the relationship between regional myocardial function assessed by MPI SPECT and scarring assessed by delayed enhanced cardiac MR. Cardiac MR is considered the gold standard for the detection of myocardial scarring (21). In this study, a 25% transmurality cutoff was used to define segments with significant scarring because contractility has been reported to be consistently affected above this threshold (24) and because it has a predictive value in terms of viability (25). Our results indicate that absolute quantification of WM and WT with CZT MPI SPECT can equally be used to detect myocardial scarring. This finding supports the use of absolute quantitative functional data to identify abnormal segments, thereby avoiding interobserver variability of visual assessment. This might be of use to discriminate between artifacts and true defects on rest images. However, we found the diagnostic performance to be dependent on the segment location, with a higher performance for the lateral wall than for the septum (WT) or the anterior and inferior walls (WM). A possible explanation may be the higher likelihood of attenuation artifacts on anterior and posterior walls, as well as hot and cold artifacts due to subdiaphragmatic activity on the posterior wall. The lower performance of WT in the septum might be due to the lower magnitude of thickening in this area, especially in basal segments.
The first limitation of this study is the use of only 1 software program to process gated SPECT data. It is highly possible that the processing of global and regional function with different software packages would render different results, as reported using standard dual-detector cameras (26). Another potential limitation is the use of cardiac MR as a reference method. Although it is considered the current gold standard, the processing of functional data is essentially manual. Cardiac MR reproducibility was beyond the scope of this study, but we acknowledge that observer variability might have had an impact on the reported reference values. Potential physiologic variability might also have occurred in patients between SPECT and cardiac MR studies. However, the delay between the 2 studies was limited, and no intercurrent clinical event was reported. Another issue is the potential misregistration between SPECT and cardiac MR segmentations, especially because the 2 datasets were not acquired in the same position. This factor might have induced an underestimation of the agreement between segmental metrics assessed by the 2 methods. However, no solution was available for a direct fusion of imaging datasets. Finally, we used myocardial scarring at cardiac MR to assess the performance of WM and WT for the identification of abnormal segments. However, regional dysfunction can occur in the absence of a scar. To account for potentially misleading ischemia-related dysfunction at rest, we made sure that none of the included patients experienced chest pain during rest acquisition, thereby maximizing the chance that most observed regional dysfunctions were scar-related.
CONCLUSION
Gated MPI SPECT using CZT cameras and QGS analysis is highly accurate for the quantification of EF. However, a significant underestimation of LV volumes persists. Absolute quantification of regional contractile function correlates to cardiac MR values, although WM assessed with the modified centerline method shows a higher agreement with cardiac MR than does WT assessed with the count curve method. Absolute WT and WM measurements can equally be used to detect myocardial scarring, as assessed by delayed enhanced cardiac MR.
DISCLOSURE
The costs of publication of this article were defrayed in part by the payment of page charges. Therefore, and solely to indicate this fact, this article is hereby marked “advertisement” in accordance with 18 USC section 1734. No potential conflict of interest relevant to this article was reported.
Footnotes
Published online Feb. 5, 2013.
- © 2013 by the Society of Nuclear Medicine and Molecular Imaging, Inc.
REFERENCES
- Received for publication June 28, 2012.
- Accepted for publication October 10, 2012.


