


Abstract
A quantitative PET imaging method was used to assess the in vivo kinetics of hepatobiliary and renal excretion of the breast cancer resistance protein (Bcrp) substrate 11C-SC-62807 in mice. Methods: Serial abdominal PET scans were collected in wild-type and Bcrp knockout (Bcrp–/–) mice after intravenous injection of 11C-SC-62807. Venous blood samples and PET images were obtained at frequent intervals up to 30 min after radiotracer administration. Dynamic PET data were analyzed to determine the canalicular and brush-border efflux clearances in the liver and kidney (CLint,bile,liver and CLint,urine,kidney, respectively). Results: SC-62807 is an in vitro substrate of mouse Bcrp and human BCRP. Radioactivity associated with 11C-SC-62807 was predominantly found in the blood, liver, bile, and urine 30 min after administration. Both biliary and urinary excretion of radioactivity was markedly lower in Bcrp–/– mice than in wild-type mice, suggesting greater systemic exposure in Bcrp–/– mice. Both the CLint,bile,liver and the CLint,urine,kidney were significantly lower in Bcrp–/– mice (74% ± 10% and 99% ± 1% lower than controls, respectively). We also found that 11C-SC-62807 is a substrate of the organic anion-transporting polypeptides OATP1B1 and OATP1B3 in vitro. Conclusion: The present study demonstrated that Bcrp plays a significant role in the efflux of 11C-SC-62807 in mouse liver and kidney. We also demonstrated the feasibility of PET using 11C-SC-62807 to study the activity of BCRP in humans.
- breast cancer resistance protein
- organic anion-transporting polypeptide
- positron emission tomography
- hepatobiliary transport
- renal excretion
Drug transporters play an important role in drug disposition and may influence therapeutic efficacy or development of adverse drug reactions (1–3). The breast cancer resistance protein (Bcrp, rodents; BCRP/ABCG2, humans) is a member of the adenosine triphosphate (ATP)–binding cassette transporter G family and mediates the efflux transport of endobiotics and xenobiotics coupled with ATP hydrolysis (4–6). BCRP is expressed in various normal tissues, including liver, kidney, brain, placenta, and intestine, where it is expressed on the brush-border membranes of epithelial cells (7). Cumulative in vivo studies, particularly involving Bcrp knockout (Bcrp–/–) mice, have demonstrated the important role BCRP plays in drug disposition, limiting oral absorption and penetration into the brain and testis (8), and mediating biliary and urinary excretion of xenobiotics such as pitavastatin and methotrexate (1,9–11). Pharmacogenomic studies focusing on a single nucleotide polymorphism frequently observed in Asians (421C>A) elucidated the importance of BCRP in systemic exposure to orally administered sulfasalazine and rosuvastatin (12,13). Because of the lack of a suitable probe, the role of BCRP in the elimination of BCRP substrates from the systemic circulation and their distribution in the brain has not been investigated. Furthermore, because BCRP eliminates uric acid, mutations and single nucleotide polymorphisms in this protein make it a risk factor for gout and are thus drawing increasing research interest (14). The many important roles played by BCRP make it a subject of major clinical interest.
PET is a powerful noninvasive molecular imaging technique that provides high sensitivity and good spatiotemporal resolution, enabling determination of the tissue concentration of drugs labeled with a positron-emitting radionuclide (15–17). The usefulness of transporter probes for molecular imaging has been demonstrated through in vivo phenotypic measurements of altered hepatobiliary transport of organic anion-transporting polypeptide (Oatp, rodents; OATP, humans) and multidrug resistance-associated protein 2 (Mrp2, rodents; MRP2, humans) in preclinical and clinical tests using 99mTc-mebrofenin (18) and 15R-11C-TIC-Me (19,20). Recently, functional PET probes for Bcrp and P-glycoprotein, such as 11C-elacridar and 11C-gefitinib, have been described for use in the noninvasive in vivo evaluation of these proteins at the blood–brain barrier (BBB) (21,22). However, because the major elimination pathway of these probes is metabolism, they cannot be used to evaluate efflux activity in the liver and kidney.
SC-62807 is the major metabolite of celecoxib (a selective cyclooxygenase-2 inhibitor) and is produced by CYP2C9 (23). Because SC-62807 contains a carboxylate group and does not undergo further metabolism, we hypothesized that SC-62807 would be a good probe for certain efflux transporters in the liver, and we synthesized 11C-SC-62807 for this purpose (Fig. 1). We previously demonstrated that in rats 11C-SC-62807 is rapidly excreted into the bile without further metabolism (24). In this study, we elucidated the predominant role of Bcrp in the efflux of SC-62807 into the bile and urine in mice and demonstrate the feasibility of using PET to evaluate BCRP activity in humans.
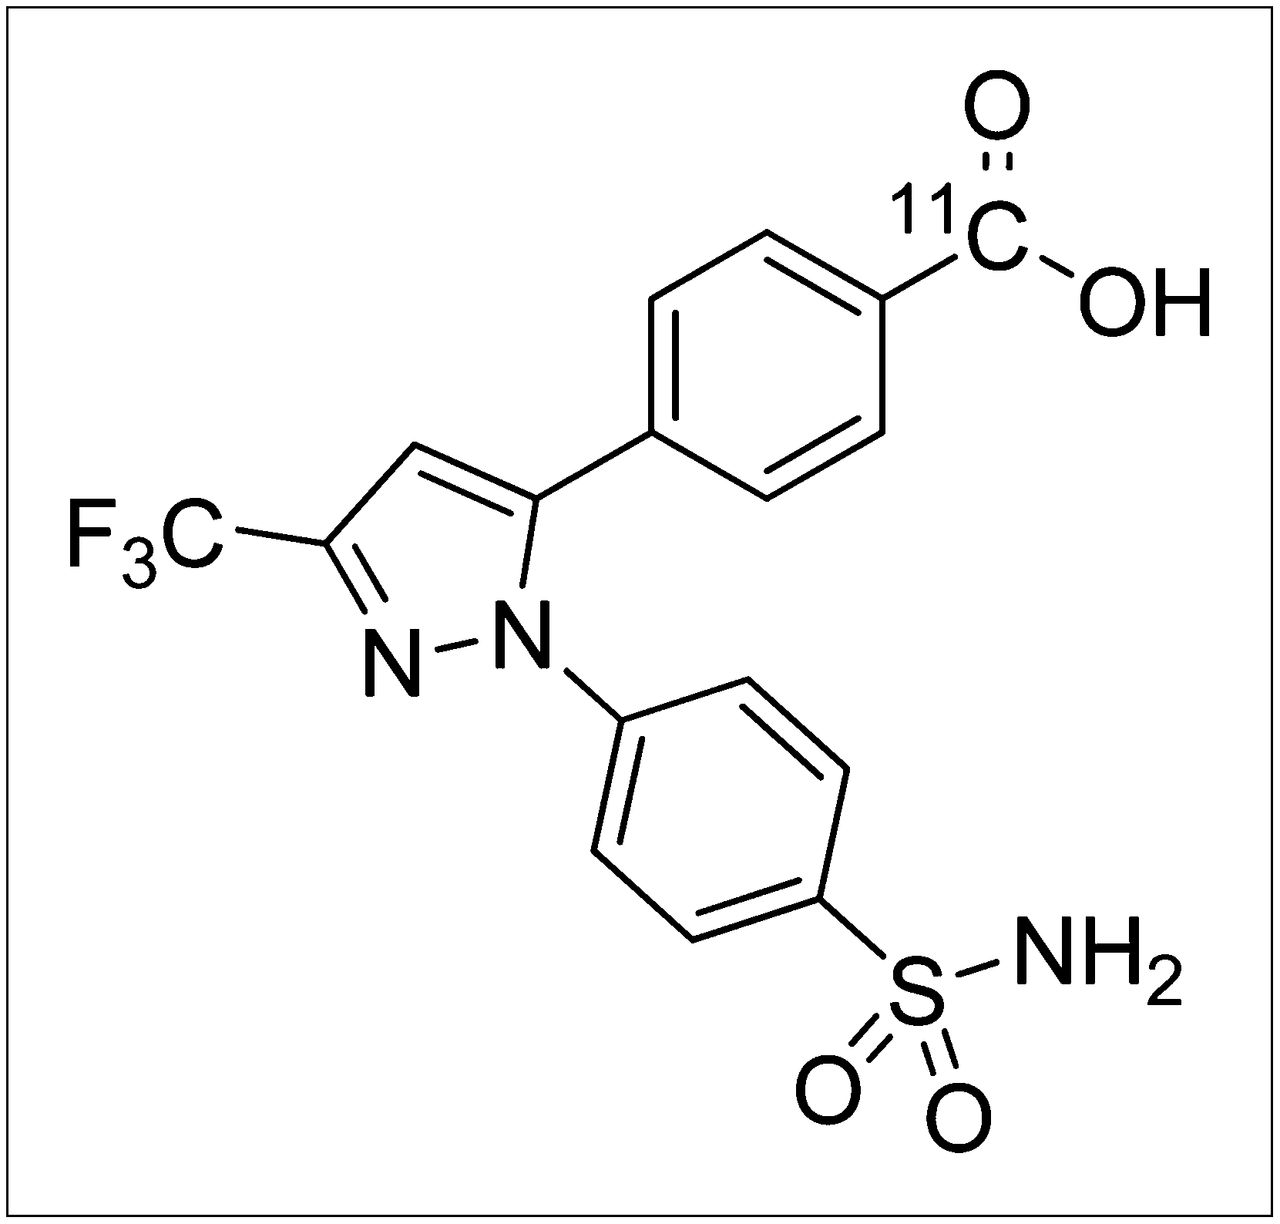
Chemical structure of 11C-SC−62807.
MATERIALS AND METHODS
Celecoxib carboxylic acid (SC-62807) was purchased from Toronto Research Chemicals Inc. 11C-SC-62807 was synthesized according to previously reported procedures (24). The chemical purity of 11C-SC-62807 was determined by measuring the ultraviolet absorbance at 254 nm. The radiochemical purity was greater than 98%, and the specific radioactivity was 14 ± 10 GBq/μmol at the time of injection. All chemicals and solvents used for labeling synthesis were analytic grade.
Animals
Male wild-type FVB and Bcrp–/– mice were purchased from Taconic Inc. (age, 6–12 wk, weight, 22–30 g). Mice were maintained in a temperature- and light-controlled environment with ad libitum access to standard food and tap water. All experimental protocols were approved by the Ethics Committee on Animal Care and Use of the Center for Molecular Imaging Science at RIKEN and were performed in accordance with the Guide for the Care and Use of Laboratory Animals (25).
Determination of ATP-Dependent Uptake of SC-62807 by Transporter-Expressing Membrane Vesicles
Membrane vesicles were prepared as described previously from HEK293 cells infected with adenoviruses expressing mouse Bcrp (mBcrp), human BCRP (hBCRP), and green fluorescent protein (GFP) (control) (26) and with recombinant adenoviruses containing human MRP2 and tetracycline-responsive transcriptional activator (27). A rapid filtration technique was used to assess ATP-dependent uptake (26). Samples were quantified using liquid chromatography–tandem mass spectrometry. The level of ATP-dependent uptake was calculated by subtracting the uptake into vesicles in the presence of adenosine monophosphate (AMP) from that in the presence of ATP. Kinetic parameters were calculated using the Michaelis–Menten equation:
PET Studies
All PET scans were obtained using a microPET Focus220 scanner (Siemens) designed for laboratory animals. Mice were anesthetized and maintained with a mixture of 1.5% isoflurane and oxygen and then placed on the PET scanner gantry. An emission scan was performed after intravenous bolus injection of 11C-SC-62807 (158 ± 32 MBq/kg) via a catheter inserted into the tail. The bolus injections contained 0.23 ± 0.19 μg of SC-62807 per animal. An emission scan was obtained in 3-dimensional list mode for 30 min and sorted into 26 dynamic sinograms according to the following sequence: 12 × 5, 3 × 20, 3 × 60, 5 × 120, and 3 × 300 s. Blood was sampled via the tail vein at the following time points: 2, 5, 15, 30, and 60 min after radiotracer administration. In addition, the biodistribution in a separate group of mice was also determined. After blood and urine sampling, blood flow was terminated by exsanguination via aortic puncture, and the liver and kidneys were quickly removed, weighed, and assayed for regional radioactivity using a 1470 Wizard automatic γ-counter (PerkinElmer). The radioactivity measured in each sample was decay-corrected to the injection time and expressed as percentage dose per tissue or percentage dose per milliliter of blood, normalized to the injected radioactivity.
Radiometabolite Analysis
Radiometabolites in the blood, urine, liver, and bile of a separate group of mice (n = 2) were analyzed using radiometric high-performance liquid chromatography. Blood and urine were collected 15 min after the mice received an intravenous injection of 11C-SC-62807 (∼211 ± 21 MBq/kg), and bile was sampled from the gallbladder 30 min after injection. To sample liver tissue, blood flow was terminated 15 min after administration, and the liver was quickly removed and homogenized. Sample preparation and chromatographic separation were performed as described previously (24).
Analysis of PET Data
PET images were reconstructed using microPET Manager 2.4.1.1 (Siemens) by standard 2-dimensional filtered backprojection using a ramp filter with a cutoff at the Nyquist frequency. Regions of interest representing the liver and the intestines were delineated using PMOD software (version 3.0; PMOD Technologies Ltd.), as described previously (19). In this PET analysis, the sum of the radioactivity in the gallbladder and intestine corresponds to the radioactivity in the bile secreted to these tissues because a conventional biodistribution study revealed that the bile radioactivity sampled from rats with bile duct cannulas is comparable to that in the intestine as determined by PET image analysis (24). A time profile of the radioactivity in each tissue was constructed by normalizing decay-corrected time-radioactivity measurements to the injected dose (percentage dose) of 11C-SC-62807.
The biliary secretion clearance (CLbile,blood,0–30 min) and renal clearance (CLrenal,blood,0–30 min) with respect to the blood radioactivity concentration were calculated using the following equations:
The apparent tissue–to–blood area under the curve (AUC) ratio (Kp,liver,AUC or Kp,kidney,AUC) was calculated using the following equation:
Canalicular efflux clearance (CLint,bile,liver) was estimated by integration plot analysis using noninvasive measurements of radioactivity in the liver and bile encompassing about the first 27.5 min after 11C-SC-62807 administration, during which the plot shows linear regression. Kidney brush-border efflux clearance with respect to the kidney concentration (CLint,urine,kidney) was estimated by integration plot analysis using the radioactivity in the kidney and urine encompassing about the first 6 min after 11C-SC-62807 administration for wild-type mice and the first 27.5 min after administration for Bcrp–/– mice. Biliary efflux and kidney brush-border efflux clearances were calculated using the following equations:
Uptake by Transporter-Expressing HEK293 Cells
OATP1B1- and OATP1B3-expressing HEK293 cells were established previously (29). The transport study was performed as described previously (29). Briefly, cells were seeded onto 12-well plates coated with poly-l-lysine and poly-l-ornithine. After 2 d, the culture medium was replaced with medium supplemented with 5 mM sodium butyrate, and cells were incubated for 24 h before the transport study to induce transporter expression. Cells were then washed and preincubated with Krebs–Henseleit buffer. Uptake was initiated by adding buffer containing radiolabeled compounds or unlabeled SC-62807 and terminated at the designated time by adding ice-cold buffer after removal of the incubation buffer. To assess uptake of radiolabeled compounds, cells were solubilized with 0.2N NaOH and kept overnight at 4°C. After neutralization with HCl, aliquots were transferred to scintillation vials and radioactivity associated with the cells and incubation buffer was measured using a liquid scintillation counter (LS6000SE; Beckman Coulter) after the addition of scintillation cocktail (Clear-sol I; Nacalai Tesque). To assess uptake of SC-62807, cells were solubilized in H2O by sonication on ice. Aliquots of the cell lysate were extracted with ethyl acetate, and sulfasalazine was used as the internal standard. After centrifugation, the supernatants were evaporated, reconstituted with 10 mM ammonium acetate/methanol (40:60, v/v), and quantitatively analyzed using liquid chromatography–tandem mass spectrometry. The remaining cell lysate was used to determine the protein concentration using the Lowry method with bovine serum albumin as a standard.
Estimating Contribution of OATP1B1 and OATP1B3 to SC-62807 Uptake by Human Hepatocytes
The contribution of OATP1B1 and OATP1B3 to SC-62807 uptake by human hepatocytes was estimated using relative activity factor analysis, as described in detail elsewhere (28,29). Briefly, relative activity factors for OATP1B1 and OATP1B3 (R1B1 or R1B3) were calculated as the uptake clearance in human hepatocytes (CLhepatocyte,ref) divided by CL1B1,ref or CL1B3,ref using the reference compounds 3H-E1S and 3H-CCK-8 for OATP1B1 and OATP1B3, respectively:
The uptake clearance of SC-62087 in hepatocytes (CLhepatocytes,SC) was estimated as the product of the R values (R1B1 and R1B3) and uptake clearance of SC-62087 in OATP1B1- and OATP1B3-expressing HEK293 cells (CLOATP1B1,SC and CLOATP1B3,SC) using the following equation:
The contributions of OATP1B1 and OATP1B3 are defined as the product of R1B1 and CL1B1,SC divided by CLhepatocyte,SC and the product of R1B3 and CL1B3,SC divided by CLhepatocyte,SC, respectively.
Statistical Analysis
Data are presented as the mean ± SD for 3–4 determinations. The statistical significance of differences between groups was determined using the Student 2-tailed unpaired t test. Statistical significance was set at a P value of less than 0.05.
RESULTS
ATP-Dependent Uptake of SC-62807 into mBcrp- or hBCRP-Expressing Membrane Vesicles
Uptake of SC-62807 by membrane vesicles expressing mBcrp or hBCRP was markedly stimulated in the presence of ATP but not in the presence of AMP or in vesicles prepared from control cells (Fig. 2A). Uptake of SC-62807 was saturable and followed Michaelis–Menten kinetics, with Km and Vmax values of 19.9 ± 3.9 μM and 435 ± 50 pmol/min/mg of protein, respectively, for mBcrp and 10.4 ± 1.73 μM and 2,263 ± 204 pmol/min/mg of protein, respectively, for hBCRP (Fig. 2B).
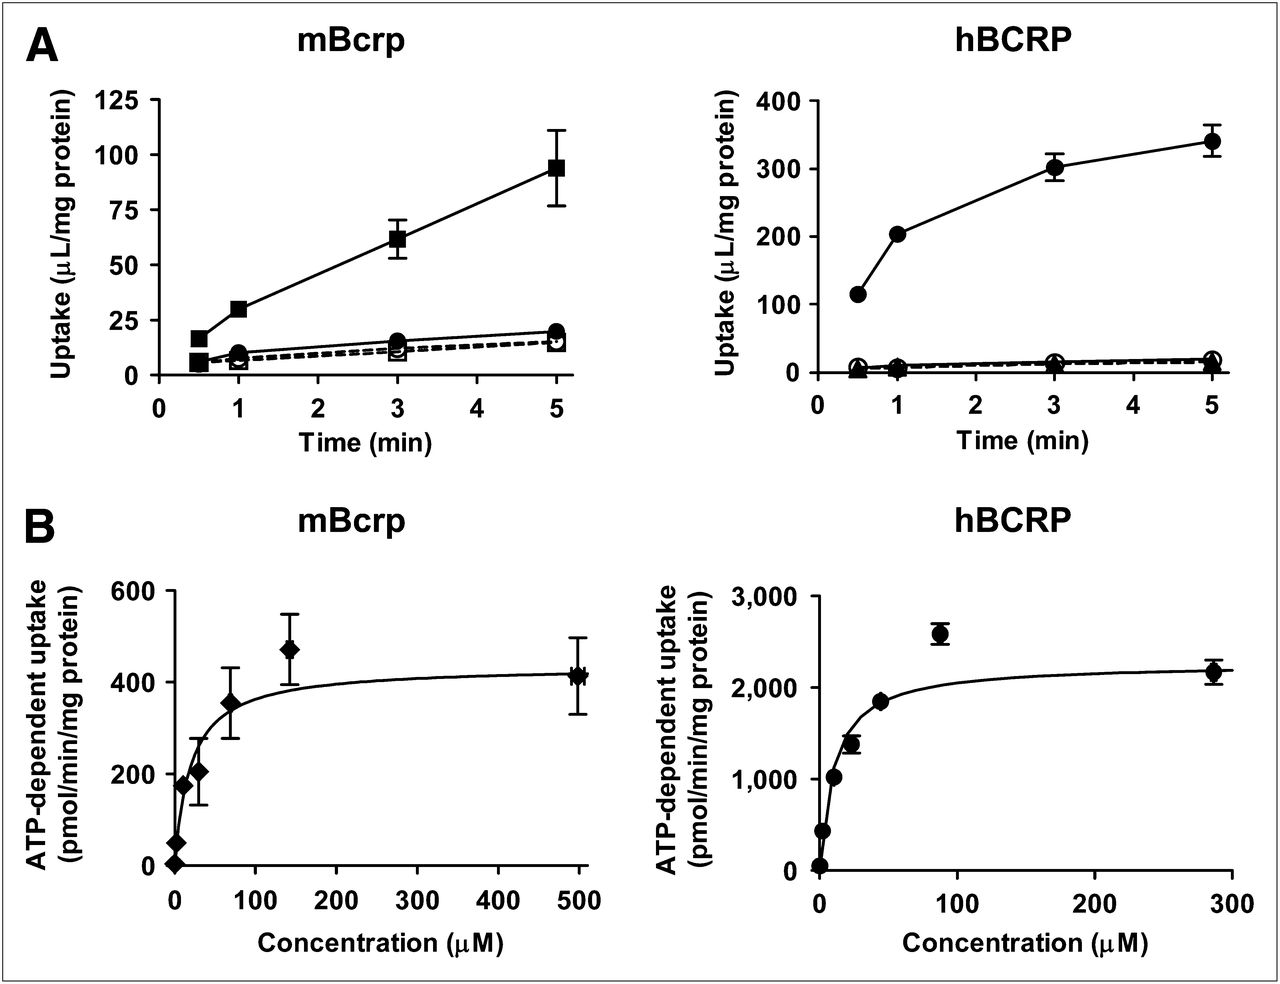
Time profiles of SC-62807 uptake by mBcrp, hBCRP, and control vesicles. Uptake of SC-62807 (2 μM) into membrane vesicles was determined in presence of ATP (closed symbols) or AMP (open symbols). Uptake was terminated at designated time. (A) Squares and circles connected using solid and broken lines represent uptake by transporter (mBcrp or hBCRP) and membrane vesicles (control) expressing green fluorescent protein, respectively. (B) Uptake of various concentrations (0.22, 2.18, 10.8, 29.7, 68.9, 142, and 498 μM for mBcrp and 0.23, 2.21, 10.6, 23.3, 44.5, 87.8, and 287 μM for hBCRP) of SC-62807 into transporter-expressing membrane vesicles for 1 min. Velocity of ATP-dependent uptake by mBcrp- and hBCRP-expressing vesicles was fitted to Michaelis–Menten equation using nonlinear regression analysis, and solid line in (B) represents fitted curve. Each point represents mean ± SE (n = 3).
Distribution of Radioactivity in Abdominal Region and Blood of Mice After Administration of 11C-SC-62807
Radioactivity localized primarily in the liver and kidneys within 2 min of 11C-SC-62807 administration in both wild-type and Bcrp–/– mice and subsequently moved to the intestine (derived from bile) or the urinary bladder (derived from urine) in wild-type mice by 30 min after administration (Fig. 3A). In contrast, translocation of radioactivity to the intestine and urinary bladder was markedly delayed in Bcrp–/– mice (Fig. 3B).
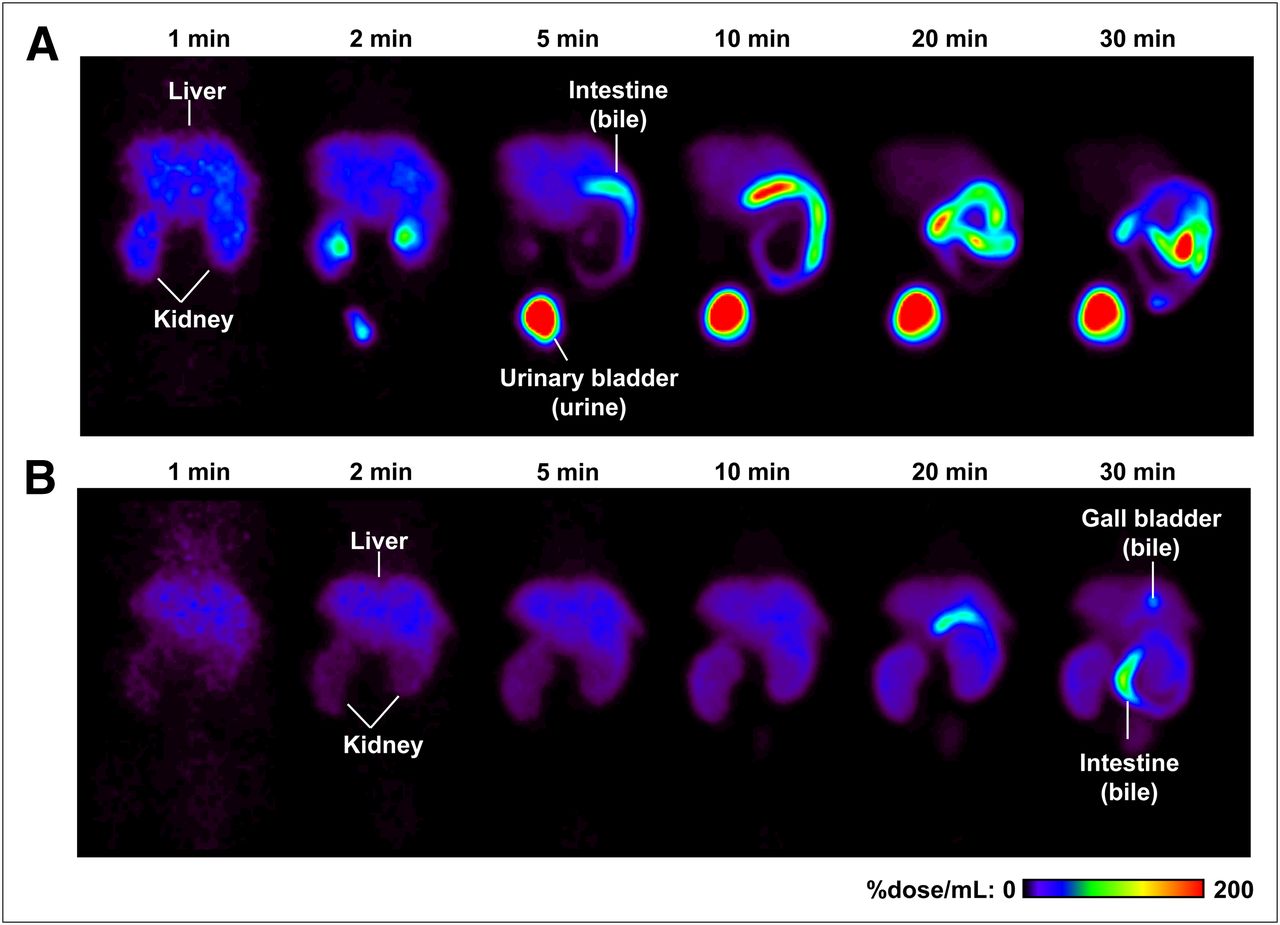
Color-coded PET images of abdominal region of wild-type and Bcrp–/– mice after administration of 11C-SC−62807. Coronal maximum-intensity-projection PET images of radioactivity in abdominal region of wild-type (A) and Bcrp−/− (B) mice were captured at 1, 2, 5, 10, 20, and 30 min after intravenous bolus administration of 11C-SC-62807.
Mouse abdominal region tissue and blood radioactivity time profiles are shown in Figure 4. A maximum of 35% ± 8% and 14% ± 3% of the dose was distributed in the liver and kidney, respectively, of wild-type mice by 2 min after administration, after which the amount of radioactivity declined rapidly. In contrast, radioactivity in the liver and kidney of Bcrp–/– mice reached a maximum at 4 and 18 min, respectively, and then decreased gradually. Radioactivity in the bile (sum of gallbladder and intestine) and urine of wild-type mice increased until 30 min, reaching 48% ± 3% and 26% ± 5% of the dose, respectively, whereas the level of radioactivity in the bile and the urine was much lower. A separate conventional biodistribution study revealed that in wild-type and Bcrp−/− mice, the radiotracer is distributed primarily in the liver (34% and 44% of dose, respectively) and to a lesser degree in the kidneys (3% and 16% of dose) and urine (7% and 0.02% of dose) at 5 min after administration. At 30 min, radioactivity in the liver, kidney, and urine of wild-type and Bcrp−/− mice was 10% and 25%, 0.4% and 14%, and 5% and 9% of the dose, respectively. These data were comparable to the PET data. Radioactivity in the blood decreased rapidly in wild-type mice but decreased only slightly and then remained constant in Bcrp–/– mice. The AUCblood,0–30 min for Bcrp–/– mice (93% ± 19% of the dose × min/mL) was 2.2-fold higher than that for wild-type mice (42% ± 18% of the dose × min/mL) (Table 1). The liver-to-blood AUC ratio (Kp,liver,AUC) was lower in Bcrp–/– mice than in wild-type mice; however, the difference was not statistically significant. The kidney-to-blood AUC ratio (Kp,kidney,AUC) was significantly higher in Bcrp–/– mice than in wild-type mice (P < 0.01) (Fig. 4; Table 1). High-performance liquid chromatography analysis revealed that almost 100% of the radioactivity in the blood, liver, bile, and urine represented unchanged 11C-SC-62807 (Fig. 5), indicating that in mice 11C-SC-62807 is rapidly eliminated without further metabolism via hepatobiliary and renal excretion.
Pharmacokinetic Parameters of 11C-SC-62807 in Wild-Type and Bcrp–/– Mice
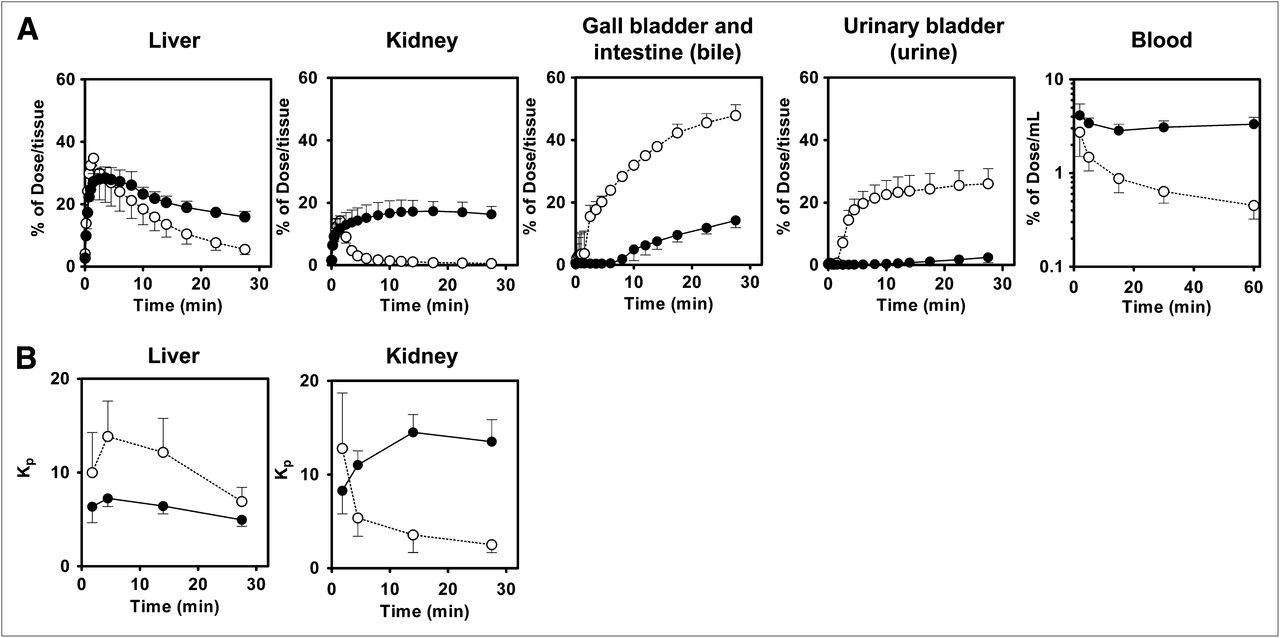
Radioactivity time profiles in tissue and blood after administration of 11C-SC-62807 to wild-type and Bcrp–/– mice. (A) Radioactivity time profiles in liver, kidney, bile, urine, and blood of wild-type and Bcrp–/– mice determined using PET and blood sampling within 60 min of administration of 11C-SC-62807. (B) Time profiles of liver-to-blood and kidney-to-blood radioactivity ratios (Kp) in wild-type and Bcrp−/− mice. Each symbol with bar represents mean ± SD (n = 4). Open and closed symbols represent wild-type and Bcrp−/− mice, respectively.

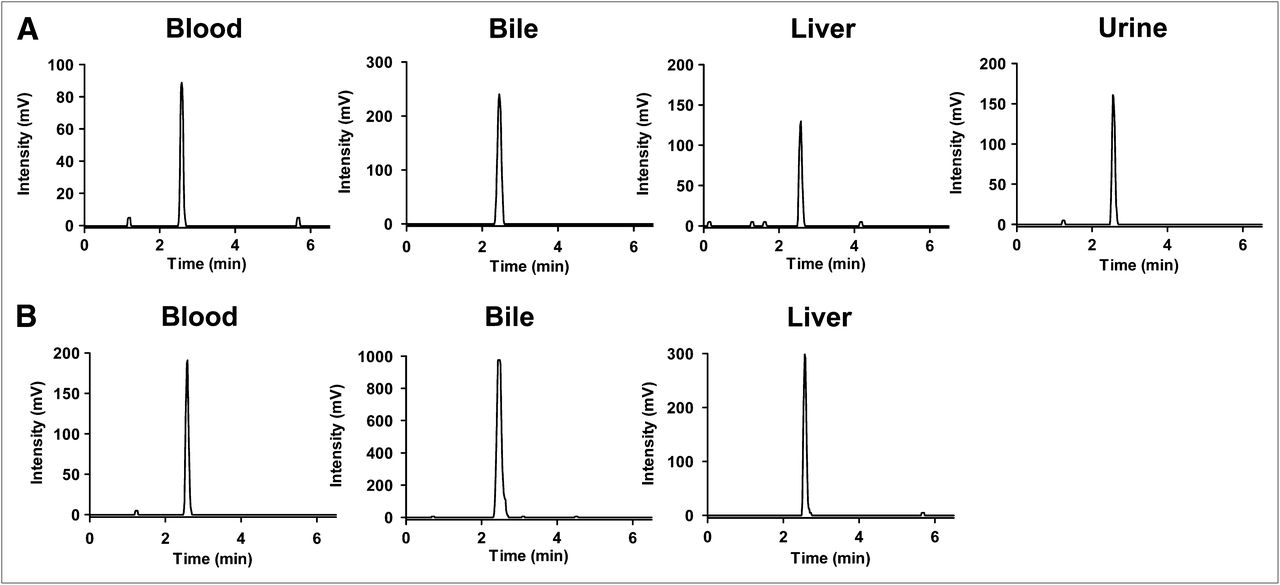
Representative high-performance liquid chromatograms of blood, bile, liver, and urine extracts from wild-type and Bcrp–/– mice after administration of 11C-SC-62807. (A) Radiochromatograms of blood extracts sampled at 15 min, bile extracts sampled from gallbladder at 30 min, liver extracts sampled at 15 min, and urine extracts sampled 15 min after administration of 11C-SC-62807 to wild-type mice. (B) Radiochromatograms of blood extracts sampled at 15 min, bile extracts sampled from gallbladder at 30 min, and liver extracts sampled 15 min after administration of 11C-SC-62807 to Bcrp–/– mice. Radioactivity in urine of Bcrp–/– mice was below detection limit for radiometric high-performance liquid chromatography.
Canalicular Efflux and Kidney Brush-Border Efflux Clearance of 11C-SC−62807 in Mice
Clearance of radioactivity via canalicular and kidney brush-border efflux (CLint,bile,liver and CLint,urine,kidney, respectively) was determined by integration plot analysis (Fig. 6). The integration plots used to determine CLint,bile,liver for wild-type and Bcrp–/– mice were linear 10 min after 11C-SC-62807 administration (Fig. 6A). The CLint,bile,liver for Bcrp–/– mice was significantly lower (by 74% ± 10%; P < 0.01) (1.2 ± 0.1 mL/min/kg) than that for wild-type mice (4.5 ± 0.8 mL/min/kg) (Table 1). The integration plots used to determine CLint,urine,kidney were linear within 6 min of 11C-SC-62807 administration for wild-type mice and within 30 min for Bcrp–/– mice (Fig. 6B). The CLint,urine,kidney for Bcrp–/– mice (0.12 ± 0.07 mL/min/kg) was significantly lower (by 99% ± 1%; P < 0.001) than for wild-type mice (13 ± 2 mL/min/kg) (Table 1). The difference in CLint,bile,liver between wild-type and Bcrp–/– mice was smaller than the difference in CLbile,blood,0–30 min, whereas the difference in CLint,urine,kidney between wild-type and Bcrp–/– mice was much larger than the difference in CLrenal,blood,0–30 min.

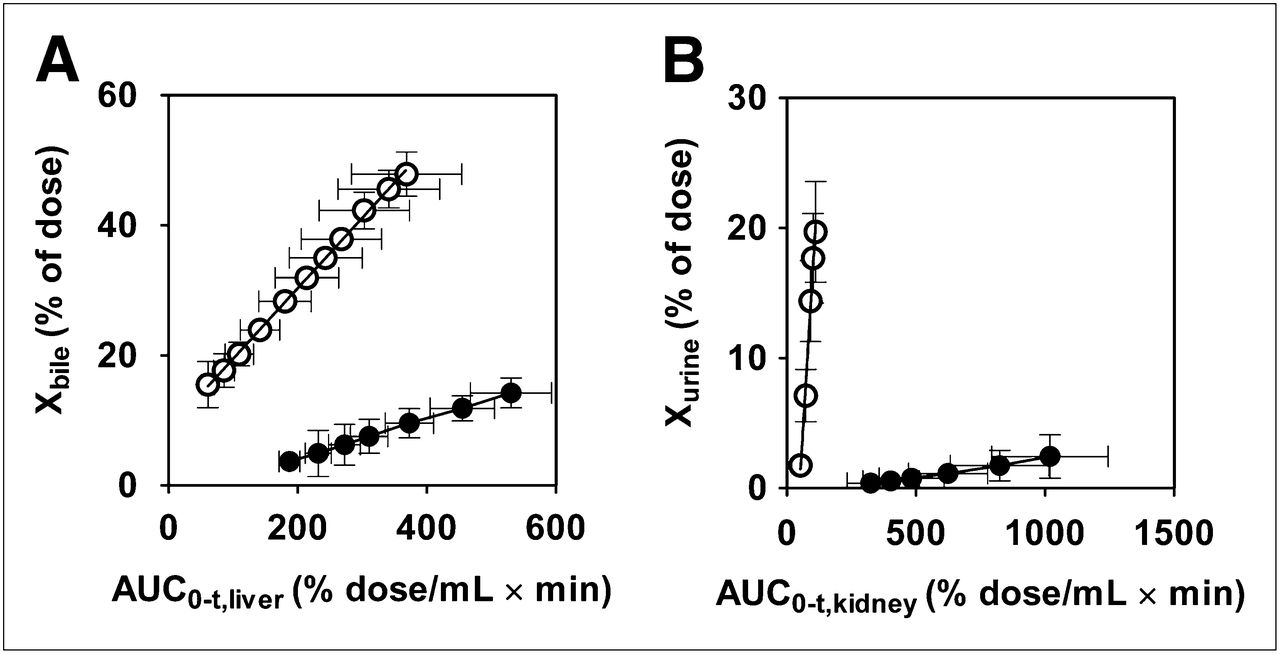
Integration plots for determination of canalicular efflux and renal secretion of total radioactivity in wild-type and Bcrp–/– mice. Integration plots were drawn for calculation of canalicular (A) and kidney brush-border (B) efflux of 11C-SC-62807 in wild-type and Bcrp–/– mice. Each symbol with bar represents mean ± SD (n = 4). Open and closed symbols represent wild-type and Bcrp−/− mice, respectively.
Estimation of SC-62807 Uptake Clearance and Contribution of OATP1B1 and OATP1B3 in Human Hepatocytes
Uptake of SC-62807 by OATP1B1- and OATP1B3-expressing cells and vector-transfected HEK293 cells (control) is shown in Figure 7. Uptake of SC-62807 was significantly higher in OATP-expressing cells than in control cells and was saturable, with Km and Vmax values of 260 ± 138 μM and 319 ± 133 pmol/min/mg of protein, respectively, for OATP1B1 and 19.8 ± 2.56 μM and 205 ± 16.2 pmol/min/mg of protein, respectively, for OATP1B3. The uptake clearance of SC-62807 mediated by OATP1B1 and OATP1B3 in human hepatocytes was estimated by comparing the uptake clearance of reference compounds (3H-E1S and 3H-CCK-8) in transfectants and hepatocytes (Table 2). Clearance of SC-62807 mediated by OATP1B1 and OATP1B3 was similar in human hepatocytes as determined by R values (Table 2).
Contribution of OATP1B1 and OATP1B3 to Hepatic Uptake of SC-62807 in Humans
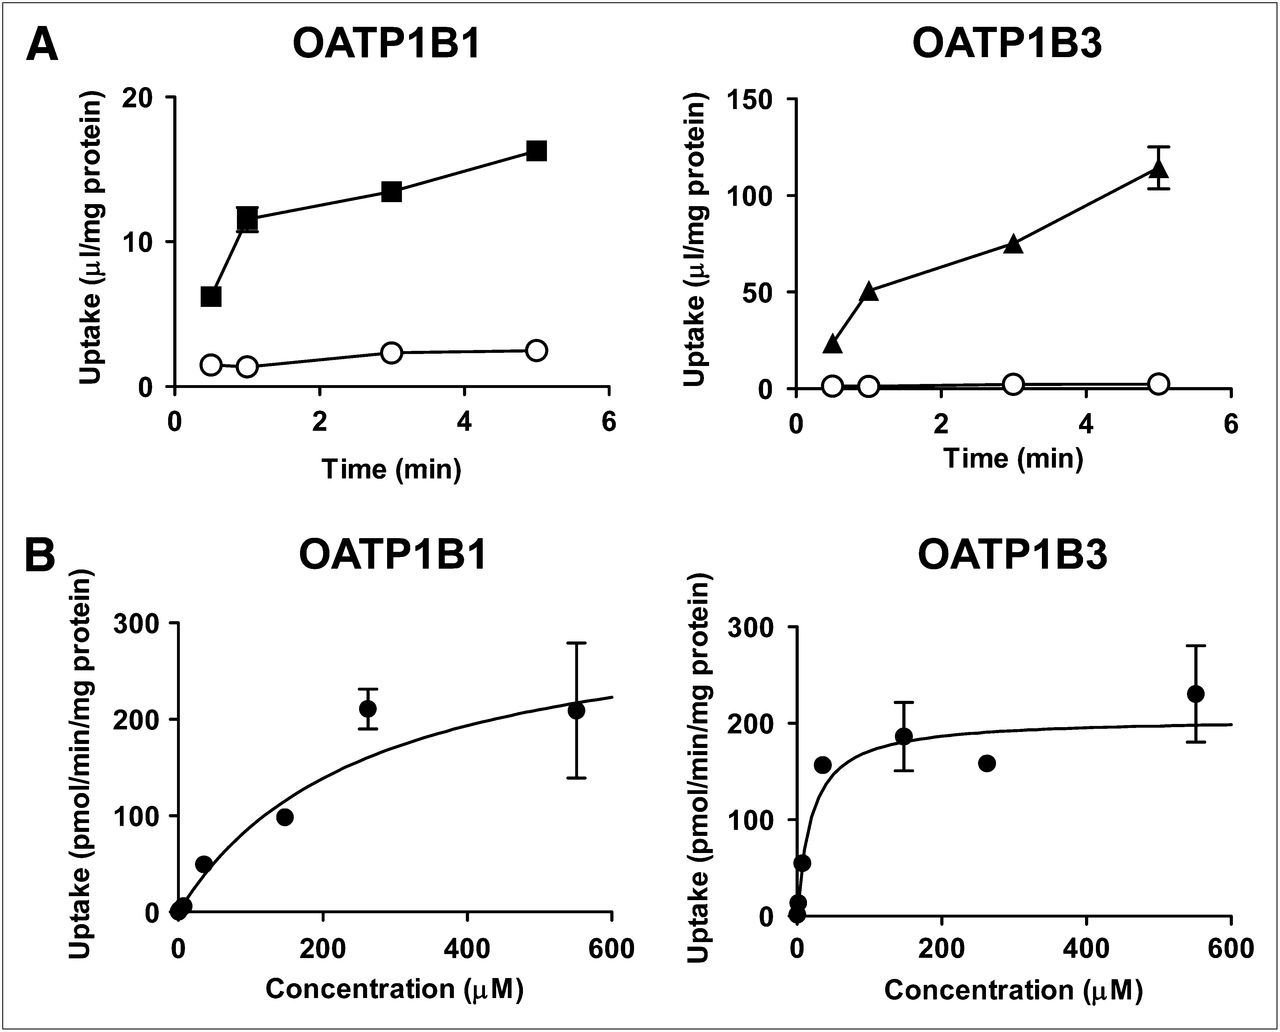
Time profiles of SC-62807 uptake by OATP1B1- and OATP1B3-expressing HEK293 cells and dependence of uptake on concentration. (A) Uptake of SC-62807 by human OATP1B1- (▪) and OATP1B3 (▲)-expressing HEK293 and mock cells (○) was determined at 37°C at designated time. (B) Uptake of SC-62807 into OATP1B1- and OATP1B3-expressing HEK293 cells was determined with varying concentrations of SC-62807 at 37°C for 1.5 min. OATP1B1- and OATP1B3-mediated transport was calculated by subtracting uptake in vector-transfected control cells from that in transporter-expressing cells. Data were fitted to Michaelis–Menten equation using nonlinear least-squares method, and each solid line represents fitted curve. Each point represents mean ± SE (n = 3).
DISCUSSION
BCRP is an ATP-binding cassette transporter involved in biliary and renal excretion. The purpose of this study was to clarify the utility of 11C-SC-62807 as a PET probe for analyzing the function of Bcrp in biliary and renal excretion in experimental animals and to demonstrate the feasibility of using 11C-SC-62807 to assess BCRP function in humans. PET studies with 11C-SC-62807 were designed to examine the kinetics of hepatobiliary transport and renal excretion in mice.
In vitro transport studies using mBcrp- and hBCRP-expressing membrane vesicles showed that SC-62807 is a substrate for BCRP in both mice and humans. This finding prompted us to investigate the tissue distribution and significance of Bcrp in the elimination of SC-62807 from the systemic circulation because Bcrp is normally expressed in the canalicular membrane of hepatocytes and the brush-border membrane on the proximal tubules in rodents (1) as well as in the BBB and blood–placenta barrier.
PET revealed that 11C-SC-62807 is excreted into the bile and urine. Because radiometabolite analyses indicated that radioactivity associated with 11C-SC-62807 metabolites is negligible in the blood, liver, bile, and urine of mice, the total radioactivity represents the unchanged form. After intravenous bolus injection, 11C-SC-62807 is predominantly excreted into the bile and, to a slightly lesser extent, into the urine. About 74% of the radioactivity was recovered in the bile and urine of wild-type mice within 30 min of administration. The 11C-SC-62807 CLrenal,blood,0–30 min was greater than the reported creatinine clearance value (8.7 ± 2.0 mL/min/kg) (30), indicating that tubular secretion contributes significantly to renal excretion.
Because BCRP is expressed in the apical membrane, its transport activity is tightly associated with the intrinsic efflux activity across the canalicular and brush-border membranes (CLint,bile,liver and CLint,urine,kidney). An advantage of PET is that it enables noninvasive monitoring of the tissue concentration to determine these parameters. Our PET analysis demonstrated that both biliary and renal excretion of 11C-SC-62807 is significantly reduced in Bcrp–/– mice, leading to prolonged systemic exposure to 11C-SC-62807. The marked decrease in both CLint,bile,liver and CLint,urine,kidney in Bcrp–/– mice clearly indicates that the predominant contribution of Bcrp to efflux of 11C-SC-62807 into the bile and urine. The transporter Mrp2 is indispensable to the efflux of most anionic drugs into the bile. SC-62807 was also shown to be an in vitro substrate for Mrp2 using an uptake study involving MRP2-expressing membrane vesicles. However, the Vmax/Km (5.6 ± 1.5 μL/min/mg of protein) was much lower than that for BCRP-expressing vesicles (218 ± 41 μL/min/mg of protein). There was only a slight decrease in the radioactivity excreted into the bile in Mrp2-deficient rats, compared with normal rats (data not shown). These results confirmed the specificity of SC-62807 for Bcrp in canalicular efflux.
Consistent with the marked reduction in efflux into the urine, the 11C-SC-62807 Kp,kidney was significantly higher in Bcrp–/– mice than in wild-type mice. Despite the marked reduction in CLint,bile,liver, however, the Kp,liver,AUC was lower in Bcrp–/– mice, possibly due either to a low contribution of canalicular efflux to the net efflux from hepatocytes or to adaptive regulation caused by a Bcrp defect. The transporter Mrp3 is expressed on the sinusoidal membrane of hepatocytes, where it mediates the sinusoidal efflux of anionic drugs and glucuronide conjugates into the blood. Sinusoidal efflux mediated by Mrp3 may contribute significantly to net hepatocytic efflux, thereby attenuating the impact of Bcrp defects on the liver-to-plasma ratio. A reduction in influx mediated by an unknown mechanism or elevation in sinusoidal efflux may also explain the discrepancy, although there are no reports concerning adaptive regulation in the expression of drug transporters in the liver of Bcrp–/– mice. We found that SC-62807 is a good in vitro substrate of OATP1B1 and OATP1B3 (Table 2). It is quite possible that rodent isoforms can mediate hepatic uptake of SC-62807. Further investigation is necessary to elucidate the mechanism underlying the discrepancy.
We also conducted 11C-SC-62807 PET of mouse brain regions to demonstrate the utility of the technique for examining Bcrp function at the BBB. Brain penetration of 11C-SC-62807 was low in both wild-type and Bcrp–/– mice, with the apparent tissue–to–blood concentration ratio (Kp) values around 0.03 (Supplemental Fig. 1; supplemental materials are available online only at http://jnm.snmjournals.org). Generally, anionic drugs have low distribution volumes in the brain, presumably because of high protein binding in the plasma and low membrane permeability of the BBB. Thus, we concluded that the use of this probe for examining Bcrp function at the BBB may be impractical because of the likelihood of poor transport across the BBB.
PET enables the direct noninvasive measurement of intrinsic efflux across the canalicular and brush-border membranes. Using PET, we detected a marked reduction in canalicular and brush-border efflux of the radioactivity associated with 11C-SC-62807 in Bcrp−/− mice, demonstrating the feasibility of clinical investigations of BCRP variation using 11C-SC-62807 as a radiotracer. It was reported that SC-62807, which is produced by oxidation of the antiinflammatory drug celecoxib, is found predominantly in the feces and urine after oral celecoxib administration in humans and that the amount of the glucuronide conjugate metabolite is low in both feces and urine (31), suggesting that 11C-SC-62807 should be minimally metabolized in humans when administered as an intravenous injection. The fact that SC-62807 is a good substrate of OATP1B1 and OATP1B3 in vitro suggests that SC-62807 is efficiently taken up by the liver from the blood circulation. In humans, SC-62807 is most likely excreted into the bile by transporters. These characteristics fulfill the conditions required for in vivo PET. Clinical studies with 11C-SC-62807 could elucidate the importance of BCRP in the disposition of drugs in humans and help resolve questions over interindividual differences in BCRP activity in the liver caused by genetic polymorphisms and sex differences.
CONCLUSION
We demonstrated the utility of noninvasive PET using 11C-SC-62807 as a radiotracer for the functional characterization of Bcrp, a protein responsible for biliary and renal excretion. We also showed the feasibility of using this technique to assess BCRP-associated membrane transport in hepatobiliary and renal excretion in humans.
DISCLOSURE
The costs of publication of this article were defrayed in part by the payment of page charges. Therefore, and solely to indicate this fact, this article is hereby marked “advertisement” in accordance with 18 USC section 1734. This work was supported by a Grant-in-Aid for Young Scientists (B) (KAKENHI 21790171) from the Ministry of Education, Culture, Sports, Science and Technology (MEXT), Japanese government. This work was also supported by a Grant-in-Aid for Scientific Research on Innovative Areas HD-Physiology (23136101) from the Ministry of Education, Science, and Culture of Japan. No potential conflict of interest relevant to this article was reported.
Acknowledgments
We are indebted to Emi Hayashinaka, Tomotaka Shingaki, and Kiyoshi Kyono of the RIKEN Center for Molecular Imaging Science; Masahiro Kurahashi of Sumitomo Heavy Industry Accelerator Service Ltd.; and Miyuu Yokochi and Sumito Ito of the Graduate School of Pharmaceutical Sciences, The University of Tokyo, for their expert technical support.
Footnotes
Published online Jan. 3, 2013
- © 2013 by the Society of Nuclear Medicine and Molecular Imaging, Inc.
REFERENCES
- Received for publication June 20, 2012.
- Accepted for publication August 23, 2012.


Jump to section
Related Articles
Cited By...
- A Clinical Quantitative Evaluation of Hepatobiliary Transport of [11C]Dehydropravastatin in Humans Using Positron Emission Tomography
- Hepatocyte-Specific Deletion of EGFR in Mice Reduces Hepatic Abcg2 Transport Activity Measured by [11C]erlotinib and Positron Emission Tomography
- PET Imaging Analysis with 64Cu in Disulfiram Treatment for Aberrant Copper Biodistribution in Menkes Disease Mouse Model
- Bioluminescent imaging of drug efflux at the blood-brain barrier mediated by the transporter ABCG2