


Abstract
Resveratrol is gaining attention for its anticancer effects and is also recognized for its antioxidant properties and influence on glucose metabolism. Augmented reactive oxygen species (ROS) and high glycolytic flux are common characteristics of malignant cells. We thus evaluated the effect of resveratrol on cancer cell glucose metabolism and investigated the role of ROS in the response. Methods: Cancer cells were measured for cell content and 18F-FDG uptake. Assays were performed for lactate production; hexokinase activity and intracellular ROS; and immunoblotting for hypoxia-inducible factor-1α (HIF-1α), Akt, mammalian target of rapamycin, and glucose transporter type 1 (Glut-1). Animal studies were performed with small-animal PET imaging of Lewis lung carcinoma tumor–bearing mice. Results: Resveratrol mildly decreased cell content and more pronouncedly suppressed 18F-FDG uptake in Lewis lung carcinoma, HT-29 colon, and T47D breast cancer cells. Hence, 18F-FDG uptake normalized to cell content was reduced to less than half of controls by 24-h exposure to resveratrol. This reduction was attributed to reduced glycolytic flux and Glut-1 expression. Resveratrol also decreased intracellular ROS in patterns that closely paralleled 18F-FDG uptake. Scavenging of ROS with N-acetyl cysteine, but not inhibition of nicotinamide adenine dinucleotide phosphate oxidase, was sufficient to suppress 18F-FDG uptake. Conversely, ROS inducers effectively reversed the metabolic response of resveratrol. HIF-1α protein was markedly reduced by resveratrol, and inhibiting HIF-1α expression with cycloheximide or specific small interfering RNAs suppressed 18F-FDG uptake. The proteosomal inhibitor MG132 partly restored HIF-1α level and 18F-FDG uptake in resveratrol-treated cells. Resveratrol also inhibited Akt activation; in addition, inhibitors and small interfering RNAs against phosphoinositide 3-kinase decreased 18F-FDG uptake. Finally, small-animal PET results showed resveratrol treatment to suppress tumor 18F-FDG uptake in vivo. Conclusion: Resveratrol suppresses cancer cell 18F-FDG uptake and glycolytic metabolism in a manner that depends on the capacity of resveratrol to inhibit intracellular ROS, which downregulates HIF-1α accumulation.
There is recently growing interest in natural products as an addition to the repertoire of agents that may be beneficial in our battle against cancer (1). Resveratrol, a natural polyphenol compound found in such fruits as grapes and berries, has particularly gained intense attention for its promising anticancer effects (2). Initially recognized for its ability to inhibit carcinogenesis at multiple stages (3,4), resveratrol has since been found to exert significant antitumor effects including inhibition of growth (5–7), induction of apoptosis (6–8), and suppression of metastatic potential (9,10).
Resveratrol is known to reduce energy expenditure in vivo, mimicking the effects of caloric restriction (11). Recently, several in vitro studies have described an inhibitory effect of resveratrol on cellular glucose metabolism (12–16). In ovarian cancer cells, resveratrol decreased glucose utilization and induced hallmarks of autophagy, mirroring conditions of nutrient deprivation (13). In HepG2 hepatoblastoma cells, reduction of glucose utilization by resveratrol was associated with slowed cell cycle in the S phase (14). In diffuse large B-cell lymphoma cell lines, resveratrol suppressed glycolytic metabolism and inhibited cell growth (15). Recently, Iqbal et al. described decreased proliferation as a consequence of resveratrol-mediated inhibition of glucose metabolism in HeLa, MCF-7, and HepG2 cells (16). Thus, a possible association between the metabolic effects of resveratrol with its anticancer properties is suggested. A major challenge that remains, however, is our presently limited understanding regarding the molecular mechanisms by which resveratrol may influence cancer cell glucose metabolism.
Malignant cells commonly have increased levels of reactive oxygen species (ROS), which has a significant role in the initiation and progression of cancer (17–20). Resveratrol has antioxidant properties through modulation of antioxidant enzyme activity or intrinsic ROS scavenging capacity, which are thought to contribute to its anticancer effects (2,3). However, the possible role of ROS on the effect of resveratrol in inhibiting cancer cell glucose metabolism has not been previously explored. Reduction of glucose metabolism after drug challenge is exploited by 18F-FDG PET for monitoring tumor response to therapy (21,22). For 18F-FDG uptake to serve as a marker of response to natural anticancer compounds, it is necessary to better understand the molecular mechanisms through which the agents modulate cancer cell glucose metabolism. In this study, we thus evaluated the effect of resveratrol on 18F-FDG uptake in Lewis lung carcinoma (LLC), T47D breast cancer, and CT26 colon cancer cells and further investigated the underlying mechanisms including the roles of ROS and hypoxia-inducible factor-1α (HIF-1α) in LLC cells. We also evaluated the effect of resveratrol treatment on 18F-FDG uptake of LLC tumors in living mice.
MATERIALS AND METHODS
Cell Culture and Reagents
LLC, HT-29, and T47D cells (American Type Culture Collection) were maintained in a humidified atmosphere at 37°C and 5% CO2 in high-glucose Dulbecco modified Eagle medium (LLC and HT-29 cells) or RPMI-1640 (T47D cells) medium supplemented with 10% fetal bovine serum and 1% penicillin/streptomycin. Cells were split 2–3 times a week, and experiments were performed when cell confluence reached 80%.
Resveratrol, N-acetylcysteine, wortmannin, LY294002, rapamycin, diphenylene iodonium, 3-bromopyruvate, cycloheximide, hydrogen peroxide, and tert-butylhydroperoxide were from Sigma-Aldrich Chemical Co. CM-H2DCFDA (5-(and-6)-chloromethyl-2′, 7′-dichlorodihydrofluorescein diacetate, acethyl ester) and lipofectamine LTX were from Invitrogen, and 3-(4-morpholinyl)sydnonimine (SIN-1) was from Cayman Chemical. Apocynin, carbobenzoxy-leu-leu-leucinal (MG132), anti-β-actin antibody, nontargeted small interfering RNA (siRNA) and siRNA against phosphoinositide 3-kinase (PI3K), and HIF-1α were from Santa Cruz Biotechnology. Rabbit polyclonal antibodies against Glut-1 and HIF-1α were from Abcam and Abnova, respectively. Rabbit polyclonal antibodies against total Akt, rabbit monoclonal antibodies against phosphor-Akt (Ser 473) and mammalian target of rapamycin (mTOR), and antirabbit secondary antibodies were from Cell Signaling. Cells were treated with agents including resveratrol by addition to culture medium whereas control cells were treated with vehicle. The final concentration of dimethyl sulfoxide in culture medium after the addition of agents or vehicle was 0.5% v/v.
Measurements of Cell Content and 18F-FDG Uptake
The amount of cells after treatment was assessed by Bradford protein assays. Glucose uptake was measured with cells seeded into 12-well plates 48 h before experiments. Cells were incubated at 37°C in 5% CO2 for 40 min with 175–370 kBq of 18F-FDG added to the culture medium. Cells were then rapidly washed twice with cold phosphate-buffered saline (PBS), lysed with 0.01N NaOH, and measured for cell-associated radioactivity on a high-energy γ counter (Wallac). All uptake results were expressed as relative radioactive counts normalized to protein content.
Measurement of Intracellular ROS Concentration
Intracellular ROS concentrations were quantified with CM-H2DCFDA, which passively diffuses into cells, undergoes removal of acetate groups by esterases, and is subsequently oxidized by ROS to yield a fluorescent adduct. Briefly, culture medium was removed from the cells in a 96-well black plate, and 100 μL of 10 μM CM-H2DCFDA in PBS was added. After incubation at 37°C in 5% CO2 for 30 min, cells were washed with warmed PBS, and 100 μL of PBS were added to each well. Fluorescence was measured on a microplate reader using 490 nm excitation and 510- to 570-nm emission wavelengths.
Hexokinase Assay
Cells homogenized in homogenizing buffer (50 mM triethanolamine and 5 mM MgCl2; pH 7.6) were centrifuged at 1,000g at 4°C for 5 min. Supernatants were mixed with homogenizing buffer (room temperature) supplemented with 0.5 mM glucose, 5 mM adenosine triphosphate, 0.25 mM reduced nicotinamide adenine dinucleotide phosphate (NADPH), and 6 units of glucose-6-phosphate dehydrogenase. The reaction mixture was repeatedly measured for 340-nm absorbance, which linearly correlates to lactate concentration. Hence, the concentration of lactate in samples can be derived from a linear standard curve that is plotted from standards of 0, 2, 4, 6, 8, and 10 nM lactate prepared by serial dilutions of purified lactate in assay buffer. Hexokinase activity was expressed as mU/mg of protein, with a unit of activity defined as enzyme activity that phosphorylates 1 μmol of glucose per min at 20°C. Cells treated for 1 h with 1 mM of 3-bromopyruvate, a halogenated analog of pyruvic acid and a well-recognized suppressor of cancer cell hexokinase activity (23), were used as a positive control for hexokinase inhibition assays.
Measurement of Lactate Production
l-lactate production was measured from 100 μL of culture medium using a Cobas assay kit (Roche/Hitachi) following the manufacturer’s instructions. In the assay, lactate is enzymatically converted to pyruvate and hydrogen peroxide. Hydrogen peroxide then undergoes an enzymatic reaction to generate a colored dye that is measured by absorbance on a microplate spectrophotometer. Lactate concentration was calculated from a standard curve of serially diluted standards and expressed in mU/mg.
Measurement of Oxygen Consumption Rate
The oxygen consumption rate was measured in cells that were cultured on a 24-well XF plate (Seahorse Bioscience) at 6,000 cells per well and maintained in normal culture medium for 48 h. Cells were treated with 50 μM resveratrol or vehicle in a 37°C incubator with 10% CO2 for 24 h. Before measurement, cells were equilibrated in assay medium (Dulbecco modified Eagle medium containing 25 mM glucose and 1 mM sodium pyruvate) containing 50 μM resveratrol or vehicle at 37°C for 1 h. The basal oxygen consumption rate was then measured for 30 min in μmol per min using a XF24 Extracellular Flux Analyzer (Seahorse Bioscience). The measurement cycle, consisting of a 2-min mix, 1-min wait, and 2-min measurement, was repeated 5 times. The oxygen consumption rate was calculated by averaging 5 measurements, normalized to cell content as measured by 3-(4,5-dimethythiazol-2-yl)-2,5-diphenyl tetrazolium bromide assays.
Silencing of HIF-1α and PI3K Gene Expression with siRNA Transfection
After culture medium was changed to that containing 5% fetal bovine serum without antibiotics, cells were transfected with 20 nM siRNA of interest using Lipofectamine LTX over 24 h. Fresh medium containing 10% fetal bovine serum and antibiotics was then replaced, and cells were incubated for another 24 h before experiments.
Immunoblotting for HIF-1α, Akt, mTOR, and Glut-1
Cells were lysed with cold protein extraction solution (PRO-PREP; Intron) containing a proteinase inhibitor cocktail (Sigma Chemical). After protein assays, 35 μg of samples were separated on a 10% sodium dodecyl sulfate polyacrylamide gel electrophoresis gel, followed by transfer to a polyvinylidene difluoride membrane. The membrane was blocked with 5% nonfat milk in Tris-buffered saline and polysorbate-20 for 1 h at room temperature and incubated overnight with primary antibodies at 4°C with dilutions of 1:1,000. The membrane was then incubated with secondary antibodies at dilutions of 1:2,000 at room temperature for 1 h. Antirabbit IgG horseradish peroxidase (HRP)–linked secondary antibody was used for all targets, and antimouse IgG HRP-linked antibody was used for β-actin. Immunoreactive protein was detected by chemiluminescence, and band intensities were quantified on a GS-800 densitometer using Quantity One software (Bio-Rad Laboratories).
In Vivo Imaging of Tumor 18F-FDG Uptake in Response to Resveratrol Treatment
Animal experiments were in accordance with the National Institutes of Health Guide for Care and Use of Laboratory Animals (24) and approved by the institutional committee. Tumor models were prepared in BALB/c-ν mice by subcutaneous injection of 1 × 10⁸ LLC cells into the left shoulder region. Because the rapid growth of LLC tumors causes high variability of 18F-FDG uptake between animals and can lead to rapid increase of uptake in the same animal, we performed a crossover study where mice received a sequence of either vehicle–resveratrol or resveratrol–vehicle treatment. In mice with small tumors (diameter, 0.5 cm), the vehicle–resveratrol group (n = 2) received intraperitoneal injection with a single dose of vehicle (6% dimethyl sulfoxide [DMSO] in saline) on the first day, followed a single dose of resveratrol (100 mg/kg) on the second day. The resveratrol–vehicle group (n = 2) received the same injections but in the opposite sequence. In mice with tumors of approximately 1.0 cm in diameter, the vehicle–resveratrol group (n = 4) received 2 doses (18 h apart) of vehicle followed by 2 doses of resveratrol (100 mg/kg) 1 d later. The resveratrol–vehicle group (n = 5) received the same injections but in the opposite sequence.
PET imaging was performed 24 h after initiation of the first and second treatments. Animals were fasted for 4 h and injected via the tail vein with 7.4 MBq of 18F-FDG. At 1 h after injection, animals were anesthetized with isoflurane inhalation, and PET images were acquired an Inveon micro-PET scanner (Siemens Medical). Non–attenuation-corrected tomographic images were analyzed on an Inveon research workstation. Polygonal regions of interest were manually drawn with care to include all tumor mass while excluding adjacent tissue. A second ROI was drawn on the contralateral shoulder to obtain background activity. Tumor-to-background ratios of uptake were obtained by dividing mean standardized uptake values of tumor by that of the background.
Data Analysis
All in vitro experiments were repeated 2 or 3 separate times, and data from a single representative experiment with triplicate samples are presented as mean ± SD, whereas those obtained from 2 or more independent experiments are presented as mean ± SE. 18F-FDG uptake ratios from small-animal PET imaging studies are presented as mean ± SD. Student t tests were used to compare measurements between groups, and a P value of less than 0.05 was considered statistically significant.
RESULTS
Resveratrol Causes Decrease in Relative Cell Content of Cancer Cells
T47D, CT26, and LLC cells all displayed mild dose-dependent decreases of relative cell content by 24-h exposure to resveratrol (Supplemental Fig. 1A; supplemental materials are available at http://jnm.snmjournals.org). This reached 67.5% ± 1.0% and 74.2% ± 1.4% of controls with 150 μM resveratrol for T47D cells and CT26 cells, respectively, and 70.3% ± 3.3% of controls with 50 μM resveratrol for LLCs. Time course experiments in LLC cells showed a gradual but mild decrease of relative cell content over 24 h.
Resveratrol Dose-Dependently Suppresses Cancer Cell 18F-FDG Uptake
T47D, CT26, and LLC cells also showed substantial dose-dependent reductions of 18F-FDG uptake by 24-h treatment with resveratrol. The magnitude of glucose uptake suppression surpassed that of decrease in cell content. Hence, 18F-FDG uptake normalized to protein content was reduced to 35.3% ± 4.6% and 42.6% ± 1.8% of controls, respectively, in T47D cells and CT26 cells treated by 150 μM resveratrol (Supplemental Fig. 1B). Uptake in LLC cells was reduced to 38.1% ± 3.6% of controls by 50 μM resveratrol. Time course experiments displayed a linear reduction of 18F-FDG uptake over time by resveratrol (Supplemental Fig. 1C).
Role of ROS on Resveratrol-Induced Suppression of Glucose Uptake
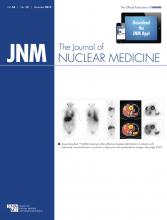
ROS concentration in LLC cells was dose- and time-dependently diminished by resveratrol treatment, in patterns closely resembling that of 18F-FDG uptake. Hence, ROS was reduced to 37.1% ± 1.4% of controls by 24-h exposure to 50 μM resveratrol, and time course experiments showed a linear decrease of ROS production over time (Fig. 1A). Comparison between ROS production and 18F-FDG uptake in cells treated by graded doses of resveratrol demonstrated a high correlation, with a Pearson correlation coefficient of 0.94 (P = 0.028; Fig. 1A).

Resveratrol (RSV) reduces ROS, which is sufficient to suppress glucose uptake. (A) Dose- (left) and time-dependent (middle) effects of resveratrol on LLC cell ROS concentration as measured by fluorescent CM-DCHF-DA assays. ROS concentration and 18F-FDG uptake in resveratrol-treated cells show high correlation (right). (B) ROS concentration (left) and 18F-FDG uptake (middle) in LLC cells treated for 24 h with 50 μM resveratrol or vehicle in presence or absence of ROS scavenger N-acetylcysteine (NAC; 10 mM). Effects of NADPH oxidase inhibitors diphenylene iodonium (DPI) and apocynin (ACN) on 18F-FDG uptake (right). All results are mean ± SD of triplicate samples expressed as percentage relative to controls obtained from single representative experiment of 2 separate experiments. **P < 0.01, ***P < 0.001, †P < 0.0005, ‡P < 0.0001, compared with controls.
The ROS scavenger N-acetylcysteine decreased ROS concentration in LLC cells to 34.7% ± 6.3% of controls, which was comparable to the 52.3% ± 6.9% achieved by resveratrol (Fig. 1B). Reduction of 18F-FDG uptake by N-acetylcysteine and resveratrol closely paralleled reductions of ROS, reaching 36.5% ± 2.3% and 51.5% ± 2.3% of controls, respectively (Fig. 1B). Combining resveratrol with N-acetylcysteine did not have an additive effect. Diphenylene iodonium and apocynin, inhibitors of NADPH oxidase, were not able to decrease 18F-FDG uptake, suggesting that ROS is maintained in LLC cells from sources other than the NADPH oxidase system (Fig. 1B).
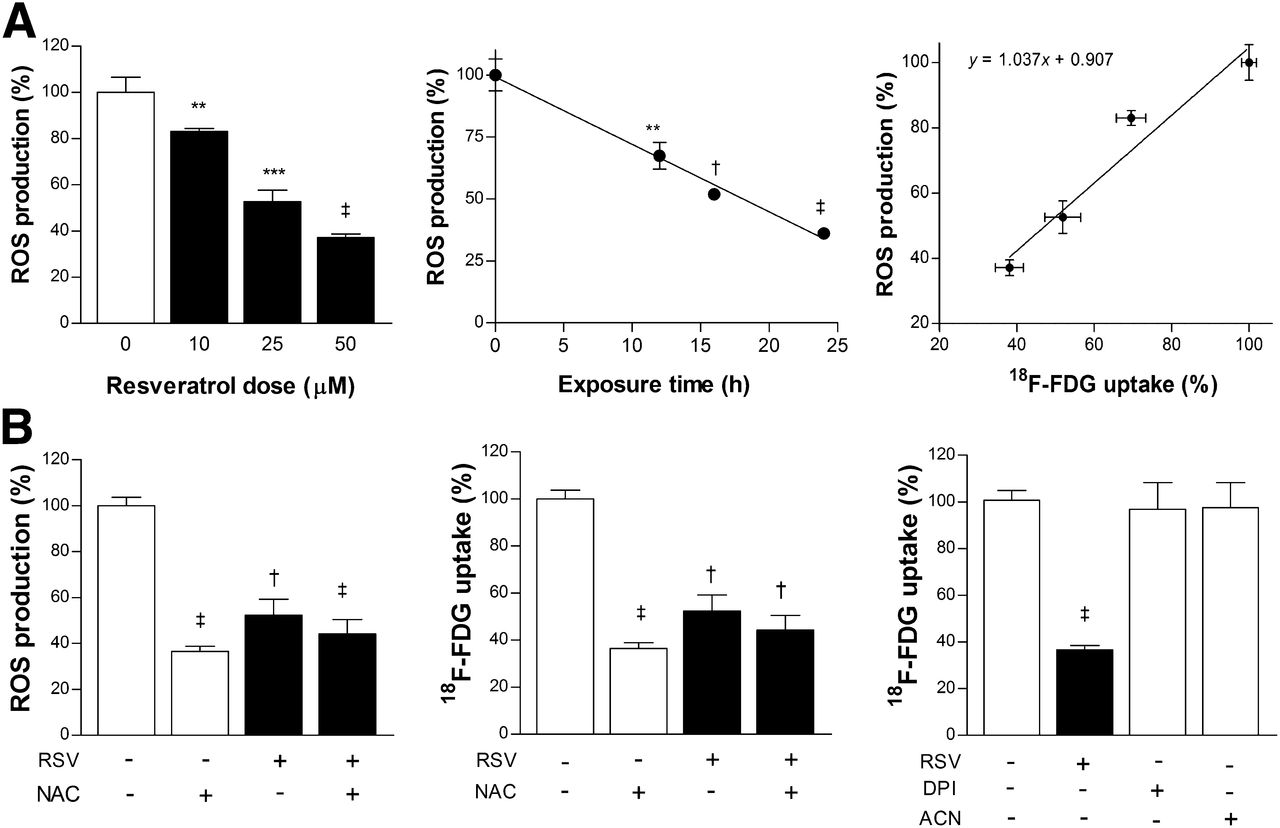
We further investigated how ROS restoration with ROS inducers affects the metabolic response of resveratrol. Hydrogen peroxide is an important ROS, tert-butylhydroperoxide is an organic hydroperoxide that decomposes to ROS, and SIN-1 spontaneously decomposes in the presence of oxygen to generate nitric oxide and superoxide. All of these ROS inducers significantly increased basal 18F-FDG uptake to 118.7% ± 5.2%, 119.2% ± 5.7%, and 142.7% ± 3.9% of controls, respectively. Furthermore, 18F-FDG uptake in resveratrol-treated cells was significantly increased 132.5% ± 1.7%, 133.1% ± 5.6%, and 148.3% ± 4.0% by respective ROS inducers (Fig. 2A).

Reduction of ROS and HIF-1α is required for metabolic effect of resveratrol (RSV). (A) ROS inducers increase basal 18F-FDG uptake and restore uptake in resveratrol-treated LLC cells. Hydrogen peroxide (H2O2; 200 μM), tert-butylhydroperoxide (tBHP; 20 μM), or 3-(4-morpholinyl)sydnonimine (SIN-1; 100 μM) was added to cells 1 h before initiation of treatment with 50 μM resveratrol. (B) HIF-1α accumulation (top) and 18F-FDG uptake (bottom) after 24-h treatment with 50 μM resveratrol or vehicle in presence or absence of cycloheximide (10 μM for 24 h; left) or proteasome inhibitor MG132 (10 μM for 4 h; right). Bars are mean ± SD of triplicate samples expressed as percentage relative to controls. *P < 0.05, **P < 0.01, †P < 0.0005, ‡P < 0.0001, compared with controls. n.s. = not significant.
Role of HIF-1α on Resveratrol-Induced Suppression of Glucose Uptake
Expression of HIF-1α protein in LLC cells was markedly decreased by 24-h exposure to resveratrol (Fig. 2B). Because cellular HIF-1α accumulation is determined by a balance between rates of synthesis and proteosomal degradation, we evaluated the effects of blocking each of the 2 processes. Blocking protein transcription with cycloheximide caused a substantial reduction of HIF-1α, and addition of resveratrol appeared to result in a similarly low level (Fig. 2B, top left). 18F-FDG uptake was decreased to 55.4% ± 4.3% of controls by resveratrol and 70.7% ± 7.7% by cycloheximide, without an additive effect (Fig. 2B, bottom left). Silencing of HIF-1α expression with siRNA also significantly decreased 18F-FDG uptake to 71.2% ± 8.8% of controls (Fig. 3A).

Roles of HIF-1α, PI3K/Akt, and mTOR signaling on resveratrol (RSV) effect. (A) Effects of HIF-1α and PI3K silencing with specific siRNA on 18F-FDG uptake. (B) Immunoblots showing effects of graded resveratrol doses on phosphorylated Akt (pAkt), Akt, HIF-1α, and mTOR expression (left) and time-dependent effects of 50 μM resveratrol on pAkt, Akt, and HIF-1α expression (right). β-actin was used as loading control. (C) Effects of PI3K inhibition with wortmannin or LY294002 and mTOR inhibition with rapamycin on 18F-FDG uptake of cells treated with 50 μM resveratrol or vehicle. All bars are mean ± SD of triplicate samples expressed as percentage relative to controls obtained from single experiment representative of 2 separate experiments. *P < 0.05, **P < 0.01, †P < 0.0005, ‡P < 0.0001, compared with controls.
The proteosomal inhibitor MG132 was applied only for the last 4 h of the 24 h of resveratrol treatment because long-term exposure appeared to affect cell viability. Even in this short duration, MG132 attenuated resveratrol-mediated decrease of HIF-1α accumulation (Fig. 3B, top right) and slightly restored 18F-FDG uptake (Fig. 3B, bottom right).
Potential Involvement of Signaling Pathways on Effect of Resveratrol
We next explored whether other major survival-promoting signaling pathways may be involved. Resveratrol inhibited Akt activation in a manner that preceded reductions of HIF-1α protein (Fig. 3B). In addition, the PI3K inhibitors wortmannin and LY294002 and mTOR inhibitor rapamycin reduced 18F-FDG uptake to 83.5% ± 3.7% and 65.6% ± 2.4% of controls, respectively (Fig. 4C). Furthermore, silencing of PI3K expression significantly suppressed 18F-FDG uptake of LLC cells to 79.9% ± 4.8% of controls (Fig. 3A).

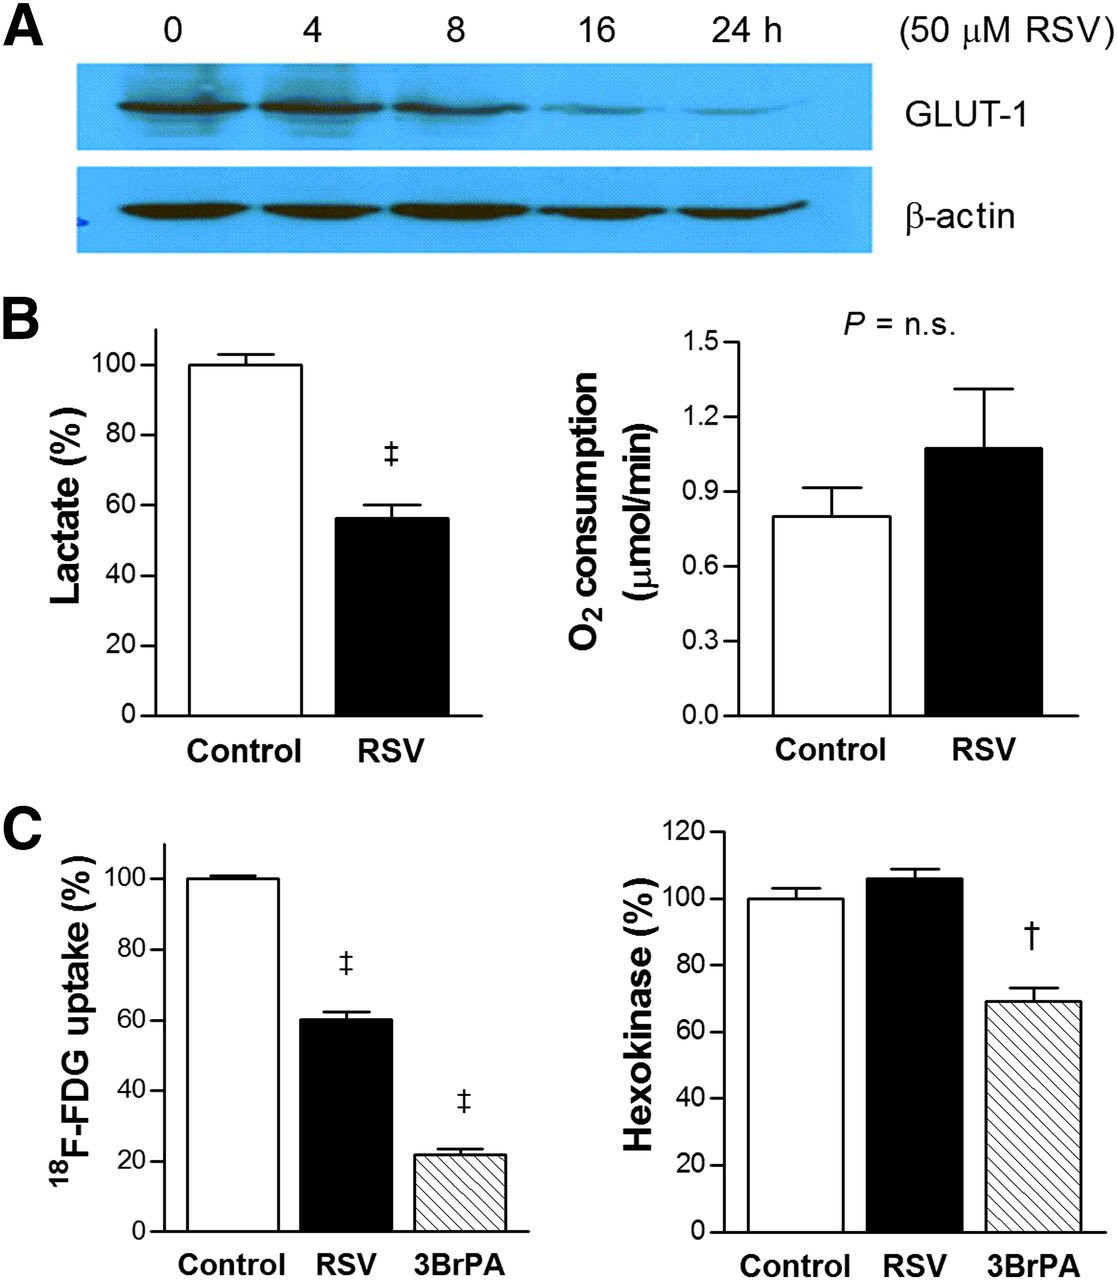
Effects of resveratrol (RSV) on glucose metabolism of LLC cells. (A) Western blots showing time-dependent Glut-1 expression after resveratrol treatment. (B) Effects of resveratrol on lactate production (left) and oxygen consumption rate (right). (C) Effects of resveratrol on 18F-FDG uptake (left) and hexokinase activity (right) with 1-h treatment with 1 mM of 3-bromopyruvate (3BrPA) as positive control. Bars are mean ± SD of triplicate samples obtained from single experiment representative of 2 or 3 separate experiments (B) or mean ± SE of 6 samples obtained from 2 independent experiments (C). †P < 0.0005, ‡P < 0.0001, compared with controls. n.s. = not significant.
Resveratrol Inhibits Glut-1 Expression and Lactate Production
We next evaluated the major mediators of the metabolic effect of resveratrol. As a result, 50 μM resveratrol was shown to substantially reduce Glut-1 expression by 16 h (Fig. 4A). In addition, resveratrol significantly suppressed lactate production to 56.2% ± 3.9% of controls (Fig. 4B, left). Oxygen consumption tended to be slightly increased by resveratrol from 0.80 ± 0.12 to 1.07 ± 0.24 μmol/min, although this did not reach statistical significance (Fig. 4B, right). In contrast, hexokinase activity, which was significantly inhibited blocked by 3-bromopyruvate, was not influenced by resveratrol (Fig. 4C).
In Vivo Tumor 18F-FDG Uptake in Response to Resveratrol Treatment
On small-animal PET of mice with small tumors that sequentially received single doses of resveratrol and vehicle, the resveratrol–vehicle group showed a significant increase of tumor 18F-FDG uptake after vehicle injection, compared with the previous day of resveratrol treatment (Fig. 5A). In contrast, in the vehicle–resveratrol group, tumor 18F-FDG uptake after resveratrol treatment did not increase, compared with the previous day of vehicle injection (Fig. 5A).
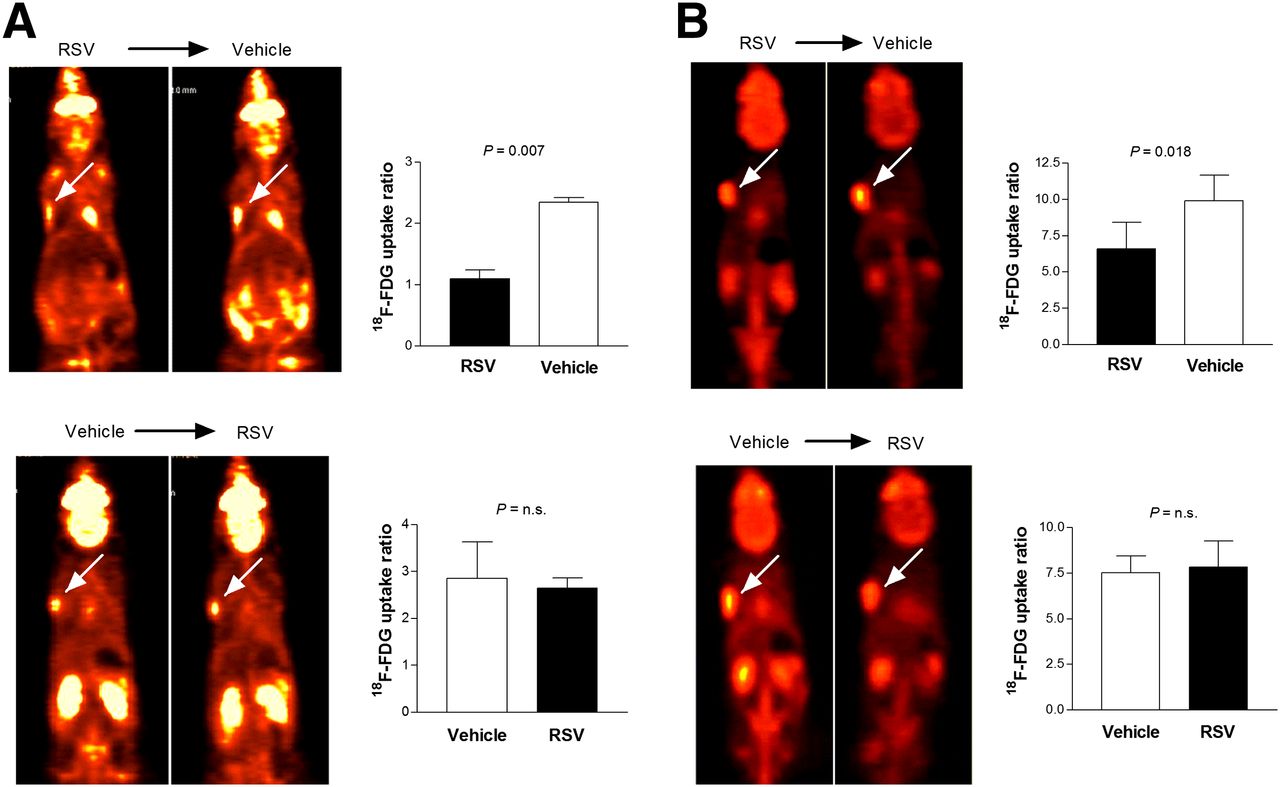
Sequential 18F-FDG PET in tumor-bearing BALB/C mice after treatment with resveratrol (RSV) and vehicle. (A and B) Coronal small-animal PET tomographs showing subcutaneously implanted LLC tumor with 18F-FDG uptake (left; arrows) and image-based tumor-to-background uptake ratios (right). PET studies were performed 24 h after treatment with resveratrol and again 24 h after vehicle injection (top) or in reverse sequence (bottom). Animals received single dose (A; n = 2 per group) or 2 doses of resveratrol and vehicle (B; n = 4 or 5 per group) in opposite sequences. Bars are mean ± SD of uptake ratios. n.s. = not significant.
The small-animal PET study of mice with larger tumors that received 2 doses of agents 18 h apart showed similar results. Hence, tumor 18F-FDG uptake was significantly increased when resveratrol treatment was followed by vehicle injection (uptake ratio, 6.59 ± 1.83 vs. 9.91 ± 1.74), whereas it was largely unchanged when vehicle injection was followed by resveratrol treatment (uptake ratio, 7.54 ± 0.91 vs. 7.82 ± 1.45; Fig. 5B).
DISCUSSION
This study demonstrates that resveratrol induces a substantial suppression of glucose metabolism in cancer cells. 18F-FDG uptake was dose-dependently reduced by resveratrol in a manner that clearly surpassed its effect in decreasing relative cell content.
The ability of resveratrol to inhibit cancer cell proliferation and survival has previously been reported (5–8). For LLC cells, an antitumor effect was shown in mice treated with resveratrol (10). Our finding corroborates previous reports and shows that LLC cell content is reduced by resveratrol doses of over 10 μM. However, whereas previous studies were performed after 48 h of resveratrol exposure (5–8), our results show that a mild decrease in LLC cell content can be detected as early as 16 h after treatment.
Compared with the modest reduction of cell content by 24-h treatment with resveratrol, suppression of glucose uptake was more pronounced and 18F-FDG uptake normalized to protein content was reduced to less than half of control level for 3 types of cancer cells. Downregulation of cancer cell glucose metabolism by resveratrol has previously been observed (13–16). Although several signaling kinases have been implicated, the precise molecular mechanism through which resveratrol suppresses cancer cell glucose metabolism has largely remained elusive.
Oxidative stress is involved in the pathogenesis and invasiveness of a variety of cancers (17–20). Moreover, a prominent biologic property of resveratrol is its antioxidant actions (2,3). Our results reveal that resveratrol dose- and time-dependently reduces LLC cell ROS concentration in a manner that closely simulates 18F-FDG uptake. Scavenging of ROS similarly diminished both ROS and 18F-FDG uptake, indicating that reducing ROS is sufficient to suppress glucose uptake. Furthermore, multiple ROS inducers were able to restore glucose uptake to near control level in resveratrol-treated cells, indicating that reduction of ROS is necessary for the metabolic effect of resveratrol. Most cellular ROS arises from mitochondrial leakage or through NADPH oxidase—a membrane-bound enzyme complex that generates superoxide. In our results, NADPH inhibitors were able to suppress LLC cell 18F-FDG uptake, suggesting mitochondrial leakage rather than NADPH oxidase as the major source of ROS in these cells.
Control of glucose metabolism in cancer cells is largely orchestrated by the master transcription regulator HIF-1α (25). This protein is rapidly destroyed under normoxic conditions by hydroxylation of proline residues followed by proteosomal degradation. ROS generated from the mitochondrial electron transport chain can inhibit proline hydroxylation enzymes and stabilize HIF-1α (26). In our study, LLC cell HIF-1α level was markedly reduced by resveratrol treatment. We attempted to dissect contributions from suppressed transcription versus stabilization for this response. As a result, inhibition of new protein synthesis with cycloheximide reduced both HIF-1α levels and 18F-FDG uptake. Furthermore, silencing HIF-1α expression also significantly decreased 18F-FDG uptake. When we inhibited proteasome activity with MG132 for a short time, HIF-1α content and 18F-FDG uptake were partially restored in resveratrol-treated cells. Together, these findings show that reduced HIF-1α is sufficient to suppress LLC cell glucose uptake and suggest that this may be necessary for the metabolic effect of resveratrol.
Several kinase pathways have previously been implicated in downregulation of cancer cell glucose metabolism by resveratrol. Kueck et al. reported the effect in ovarian cancer cells was accompanied by reduced levels of phosphorylated Akt and mTOR (13). Faber et al. observed reduced glycolysis and Akt phosphorylation in diffuse large B-cell lymphoma cells treated with resveratrol (15). Massimi et al. suggested that adenosine monophosphate–activated protein kinase may be involved in reduced glucose utilization of HepG2 hepatoblastoma cells by resveratrol (14). Iqbal et al. showed that decreased glucose uptake by resveratrol in several cancer cell lines was mediated by downregulated pyruvate kinase M2 expression through inhibition of mTOR signaling (16). HIF-1α induction in malignant cells is closely linked to PI3K/Akt and mTOR signaling (27–29), which are frequently involved in cancer cell proliferation, metabolism, and survival (30). In breast cancer cells, estrogen-induced HIF-1α accumulation was shown to occur through the PI3K/Akt pathway leading to mTOR phosphorylation (31). In our results, resveratrol reduced activated Akt levels in LLC cells in a manner that preceded suppression of HIF-1α accumulation. Furthermore, chemical inhibitors of PI3K and mTOR and siRNA of PI3K could reduce 18F-FDG uptake. Reduced Akt activation has previously been observed to accompany suppression of glycolysis in cancer cells treated with resveratrol (16,17). Inhibition of mTOR has also been implicated to be involved in resveratrol-mediated inhibition of glucose metabolism in cancer cells (16,18). Furthermore, a recent study observed that liquiritigenin inhibited HIF-1α accumulation in HeLa cells by modulating Akt and mTOR signaling (32). Our study corroborates these reports by suggesting that PI3K/Akt and mTOR signaling may be involved in the capacity of resveratrol to suppress cancer cell glucose uptake. Reduction of glucose uptake by resveratrol in our study was linked to diminished glycolytic metabolism as evidenced by decreased lactate production. Among the major determinants of tumor glycolytic flux (33–35), this was shown to be due to reduced Glut-1 expression rather than hexokinase activity.
Finally, our small-animal PET imaging results showed that LLC tumors had lower 18F-FDG uptake after treatment with resveratrol, than vehicle. Although the effect of resveratrol on tumor 18F-FDG in our animal study may be considered modest, it should be noted that with presently available methods, resveratrol suffers from low bioavailability in vivo (36). Indeed, resveratrol is rapidly metabolized, with sharp drops in plasma concentration within an hour whether given intravenously or orally (37). Therefore, the modest difference of tumor 18F-FDG uptake between treatment groups in our study is likely contributed to by rapid metabolism of the administered resveratrol. Nevertheless, our results showed significant suppression of tumor 18F-FDG uptake by resveratrol treatment in vivo.
CONCLUSION
Resveratrol induces a suppression of glucose uptake and glycolysis in cancer cells. This metabolic response is dependent on the capacity of resveratrol to block intracellular ROS, which then downregulates HIF-1α accumulation, Glut-1 expression, and glycolytic flux. These findings may thus offer ROS and HIF-1α as a potential link between the metabolic effect of resveratrol and its anticancer properties.
DISCLOSURE
The costs of publication of this article were defrayed in part by the payment of page charges. Therefore, and solely to indicate this fact, this article is hereby marked “advertisement” in accordance with 18 USC section 1734. This study was supported by a grant of the Korean Health Technology R&D Project, Ministry of Health & Welfare, Republic of Korea (A110086). No other potential conflict of interest relevant to this article was reported.
Footnotes
Published online Nov. 12, 2013.
- © 2013 by the Society of Nuclear Medicine and Molecular Imaging, Inc.
REFERENCES
- Received for publication October 10, 2012.
- Accepted for publication August 14, 2013.


Jump to section
Related Articles
Cited By...
- No citing articles found.