


Abstract
We investigated the relation of carotid 18F-FDG uptake to high-sensitivity C-reactive protein (hsCRP) and Framingham risk score (FRS) in a large cohort of asymptomatic adults. Methods: Carotid artery 18F-FDG uptake was measured on the PET/CT scans of 1,181 asymptomatic subjects, and maximum target-to-background ratio (M-TBR) and intima-media thickness (IMT) were compared with clinical risk factors and hsCRP. The estimated 10-y risk for general cardiovascular disease was calculated by FRS. Results: FRS increased from 11.5% ± 7.8% to 14.8% ± 10.5% in subjects with an M-TBR ≥ 1.7, compared with < 1.7, and the odds ratio for an FRS ≥ 10% was 1.9 (95% confidence interval [CI], 1.4–2.5). Adjusting for age confirmed a significant association of M-TBR and IMT with FRS. Independent determinants of high M-TBR were abdominal fat (β coefficient [B], 1.1040; P < 0.0001), low-density lipoprotein (LDL) (B, 0.0006; P < 0.05), and FRS (B, 0.0025; P < 0.05) for subjects < 50 y and abdominal fat (B, 0.9740; P < 0.0001), age (B, 0.0040; P = 0.0001), LDL (B, 0.0008; P = 0.0001), and IMT (B, 0.1097; P < 0.01) for subjects ≥ 50 y. Although hsCRP also stratified subjects for FRS-based risk, no correlation was found between hsCRP and M-TBR or IMT, suggesting that they may have different inferences. Importantly, in the low-hsCRP (14.2% ± 9.7% vs. 11.3% ± 7.4%) and high-hsCRP groups (18.8% ± 14.3% vs. 13.3% ± 10.2%), FRS was significantly greater for subjects with high M-TBR than for those with low M-TBR. The odds ratio for FRS ≥ 10% between subjects with high and low M-TBR was 1.20 (95% CI, 0.90–1.60; P = 0.209) in the low-hsCRP group and 2.95 (95% CI, 1.48–5.86; P = 0.002) in the high-hsCRP group. Conclusion: High carotid 18F-FDG uptake in asymptomatic adults is associated with increased clinical risk factors and FRS. Furthermore, it appears to reflect aspects of atherosclerotic inflammation distinct from hsCRP concentration and may offer incremental information regarding cardiovascular risk.
Atherosclerotic disease remains the most common cause of death and disability in the developed world (1). However, a fifth of all cardiovascular events occurs in individuals who have no identifiable traditional risk factors (2). Risk-stratifying asymptomatic patients for cardiovascular events therefore remains challenging, emphasizing the need for additional indicators (3). Although cardiovascular risk is closely related to the severity of atherosclerotic lesions (4), anatomic imaging does not provide information on plaque composition, which critically affects patient outcome.
Because atherosclerosis is an inflammatory disease (5), biomarkers of inflammation are gaining attention as potentially useful predictors of cardiovascular events. PET using 18F-FDG and serum levels of high-sensitivity C-reactive protein (hsCRP) have emerged as particularly promising prognostic indicators. Macrophages avidly take up glucose in a manner that parallels inflammation severity (6,7). The magnitude of arterial 18F-FDG uptake has been shown to correlate to cardiac risk factors (8–9), and there is accumulating evidence suggesting that it may be a useful indicator of cardiovascular risk (10–12). hsCRP concentration is tightly linked to carotid atherosclerosis and plaque development (13,14). Moreover, elevated hsCRP has been shown to predict cardiovascular risk in apparently healthy men (15) and women (16) and in patients with unstable angina (17) or increased traditional risk factors (18).
Despite the significant roles of arterial 18F-FDG uptake and hsCRP as inflammatory markers of atherosclerotic disease, however, the precise relation between these indicators and their prognostic impact on cardiovascular outcome remains to be explored. Indeed, there have been only a few studies with relatively small numbers of subjects that compared circulating hsCRP and 18F-FDG uptake, and the findings have shown mixed results (19–21). In this study, we thus evaluated a large cohort of asymptomatic adults to investigate the relation of carotid artery 18F-FDG uptake, hsCRP concentration, and estimated risk based on general cardiovascular Framingham risk scores (FRSs).
MATERIALS AND METHODS
Study Subjects
Study candidates were 2,329 consecutive subjects who underwent 18F-FDG PET/CT as part of a health checkup program to screen for possible hidden malignancies at our institute between January 2009 and November 2009. From this population, 1,210 subjects who had also undergone carotid Doppler-based measurement of intima-media thickness (IMT) and had all clinical data necessary for FRS calculation were selected. Among these subjects, 29 cases were excluded for PET/CT data loss (n = 14), inaccessible electronic medical record (n = 1), or obscured carotid uptake by high activity adjacent tissue (n = 14). Thus, 1,181 subjects were finally included for analysis. None of the patients had cancer disease or cardiovascular symptoms. The institutional review board (IRB or equivalent) approved this retrospective study, and the requirement to obtain informed consent was waived.
All study subjects underwent anthropometric measurements for height, weight, blood pressure, waist circumference, and abdominal fat. Body mass index was calculated from the equation weight (kg)/height2 (m2). Information on age, sex, and medical history was obtained from electronic medical records. Current smoking was defined as having smoked in the last 30 d. Diabetes was defined as a fasting glucose ≥ 126 mg/dL or use of hypoglycemic medications. Hypertension was defined as a systolic blood pressure ≥ 140 mm Hg, diastolic blood pressure ≥ 90 mm Hg, or use of medication prescribed for hypertension. Use of medications was based on prescriptions entered by clinical staff. Laboratory tests included triglycerol, low-density lipoprotein (LDL), high-density lipoprotein (HDL), total cholesterol, fasting blood glucose, hemoglobin A1c (HbA1c), and serum hsCRP concentration. Carotid IMT was measured with a standard protocol using an automated IMT package and a high-resolution B-mode ultrasound (GE Healthcare). The average of bilateral measurements was used as the IMT level. All anthropometric and IMT measurements and laboratory tests were performed on the same day as the PET/CT study.
PET/CT Imaging
All subjects fasted for at least 6 h before the PET/CT study, and blood glucose levels were < 200 mg/dL at the time of 18F-FDG injection. Imaging was performed on an STE scanner (GE Healthcare; n = 1,174) or a Discovery LS scanner (GE Healthcare; n = 7). CT images were acquired first at 45 min after 18F-FDG (370 MBq) injection using an 8-slice (140 keV, 40–120 mAs adjusted to body weight; section width of 5 mm) or 16-slice helical CT scanner (140 keV, 30–170 mAs with an AutoA mode; section width of 3.75 mm). No intravenous or oral contrast materials were used. Emission PET images were then acquired from thigh to head for 4 min per frame in 2-dimensional mode. Attenuation-corrected PET images (voxel size, 4.3 × 4.3 × 3.9 mm) were reconstructed using CT data by an ordered-subsets expectation maximization algorithm (28 subsets, 2 iterations). Xeleris software (GE Healthcare) was used to coregister the PET and CT data.
Image Analysis
Transaxial 18F-FDG PET and PET/CT tomographic slices of 3.3-mm (Discovery LS) or 4.3-mm (STE scanner) thickness were analyzed on a Xeleris workstation. PET images were analyzed by a nuclear medicine physician masked to any clinical information including FRS and hsCRP results. Circular or ellipsoidal regions of interest were manually placed over the carotid arteries on every other tomographic slice beginning from the merging point with the brachiocephalic trunk or aortic arch up to 4–6 slices above the bifurcation site as previously described (22). Care was taken to include all arterial outer walls while excluding nonvascular tissue of significant activity. From each arterial region of interest, mean and maximum standardized uptake values (SUVs) were obtained. Blood-pool activity was measured by placing circular regions of interest in the mid lumen of the inferior vena cava on 5 different tomographic slices and averaging the values to obtain the background SUV. The mean and maximum SUVs of each arterial segment was averaged for both carotid arteries and divided by the background SUV to yield mean and maximum target-to-background ratios (M-TBRs) for each subject.
General Cardiovascular Risk Scoring
The FRS system was used to estimate the 10-y risk of general cardiovascular disease in our study subjects. The scores were calculated on an open accessible Web site (http://reference.medscape.com/calculator/framingham-cardiovascular-disease-risk). Under this scoring system, the risk of general cardiovascular disease at 10 y is 10% or less for those with low risk, 10%–20% for intermediate risk, 20%–30% for high risk, and over 30% for highest risk.
Statistical Analysis
Continuous variables were expressed as mean ± SD for tables and mean ± SE for figures. t tests and Mann–Whitney tests were used to compare difference between 2 groups, and ANOVA with post hoc Scheffe tests was used for 3 or more groups. Correlation between variables was assessed by linear regression analysis. Stepwise multiple regression analysis was performed using SPSS (version 16.0; SPSS Inc.) for Windows (Microsoft). P values of less than 0.05 were considered significant.
RESULTS
Clinical Characteristics of Study Subjects
The clinical characteristics of the study subjects are shown in Table 1. Subjects had a mean age (±SD) of 52.0 ± 6.5 y (range, 33–79 y) and a high male preponderance that reached 94.3% (1,114/1,181). On average, the subjects had an M-TBR of 1.60 ± 0.15, IMT of 0.65 ± 0.15 mm, FRS of 12.3% ± 8.7% (median, 9.9%; interquartile range [IQR], 6.6–14.9), and hsCRP of 1.2 ± 2.4 mg/dL.
Clinical Characteristics of Study Subjects Stratified by M-TBR and IMT
When divided by an M-TBR threshold of 1.7, there were 886 subjects with low 18F-FDG uptake and 295 subjects with high uptake. The high–M-TBR group displayed significantly greater age, abdominal fat, IMT, and FRS, with P < 0.001, than did the low–M-TBR group (Table 1). The odds ratio for FRS ≥ 10% between high– and low–M-TBR groups was 1.9 (95% confidence interval [CI], 1.4–2.5). There was also greater body mass index, waist circumference, and systolic blood pressure and higher levels of total cholesterol and LDL in the high–M-TBR group. Grouping subjects with mean TBR (threshold, 1.4) also demonstrated greater age, body mass index, waist circumference, abdominal fat, total cholesterol, LDL, IMT, and FRS for those with higher mean TBR (data not shown). However, there was no difference in hsCRP level between subjects with high TBR and low TBR. When M-TBRs of 1.5 and 1.7 were used to divide subjects into 3 groups, FRS significantly increased from 9.7% ± 6.2% (median, 7.9; IQR, 5.6–12.4) for subjects with an M-TBR < 1.5 (n = 287) to 12.3% ± 8.3% (median, 9.9; IQR, 6.8–14.7) for those with an M-TBR of 1.5–1.7 (n = 598; P < 0.0001). FRS further increased to 14.8% ± 10.6% (median, 11.8; IQR, 7.9–18.0) when M-TBR was ≥ 1.7 (n = 296; P < 0.0001). Again, there was no difference in hsCRP level between the 3 groups (all 0.1 ± 0.2 mg/dL; data not shown).
When subjects were divided by an IMT threshold of 0.75 mm (third quartile), the high-IMT group (293 subjects) displayed significantly greater age, body mass index, systolic blood pressure, abdominal fat, waist circumference, HbA1C, M-TBR, mean TBR, and FRS, with P values of < 0.001, than did the low-IMT group (888 subjects; Table 1). The odds ratio for an FRS ≥ 10% between high- and low-IMT groups was 2.6 (95% CI, 1.9–3.4). There was also greater fasting blood glucose and lower HDL in the high-IMT group.
When subjects were grouped by FRS categories, M-TBR was greatest for the highest-risk group (FRS ≥ 30%; 1.71 ± 0.17), followed by the high- and intermediate-risk groups (FRS, 10%–20% and 20%–30%, respectively; both 1.62 ± 0.15), and lowest for the low-risk group (FRS < 10%; 1.57 ± 0.15; Fig. 1A). Similar results were observed for IMT level, which was 0.79 ± 0.12 mm for highest-risk, 0.71 ± 0.14 mm for high-risk, 0.67 ± 0.15 mm for intermediate-risk, and 0.62 ± 0.12 mm for low-risk FRS groups (Fig. 1A). hsCRP levels were significantly higher for the highest-risk group (0.17 ± 0.25 mg/dL) than for the high-risk group (0.12 ± 0.16 mg/dL) and low-risk group (0.10 ± 0.23 mg/dL; Fig. 1A).
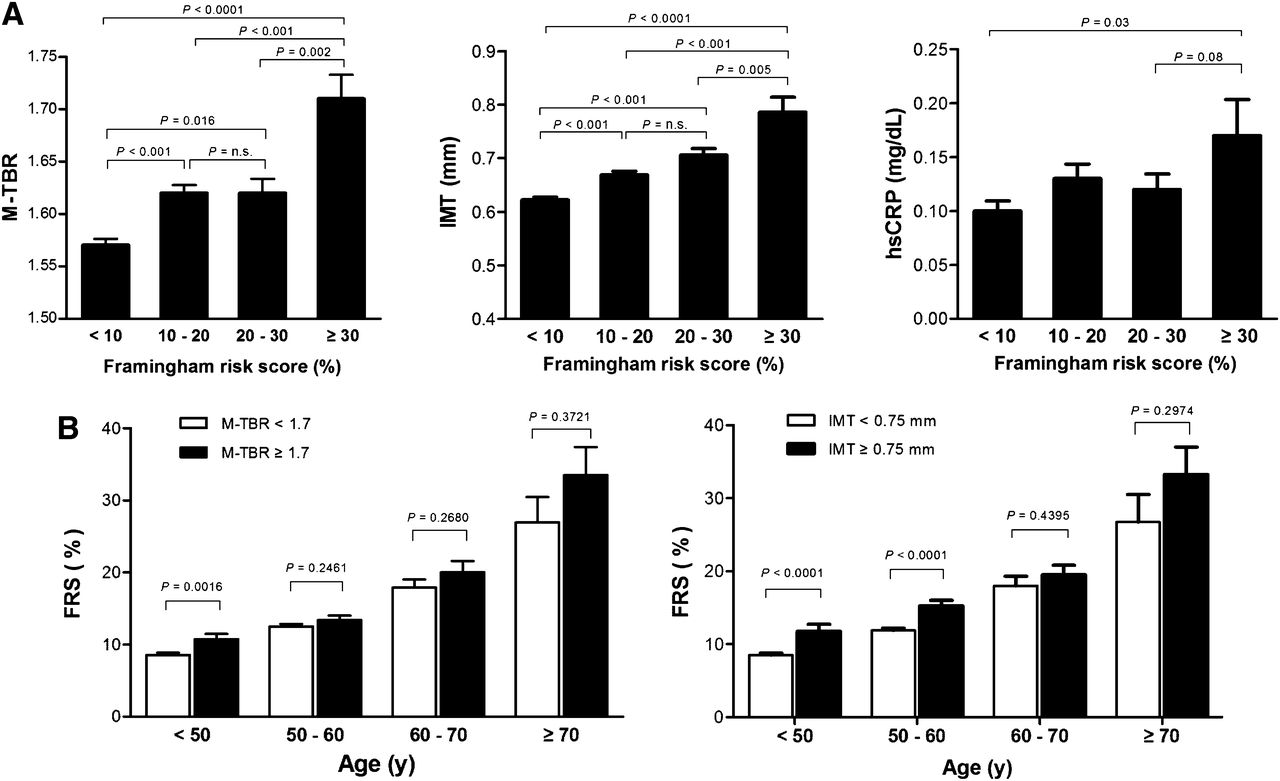
Relation of FRS to M-TBR, IMT, and hsCRP. (A) M-TBR (left), IMT (middle), and hsCRP levels (right) according to FRS categories. (B) FRS according to high and low M-TBR (left) and IMT groups (right), adjusting for age by stratification. P < 0.001 for age effects on M-TBR and IMT. Bars are mean ± SE. n.s. = not significant.
Independent Clinical Determinants of High Carotid 18F-FDG Uptake
Because age can act as a confounder by increasing both cardiovascular risk and arterial 18F-FDG uptake, we analyzed the relation of M-TBR and IMT with FRS, adjusting for age by stratification. Stratification by age confirmed a significant increase of FRS as subjects got older (P < 0.001), reaching 31.1% and 18.8% for subjects ≥ 70 y and 60–70 y, respectively. Among our study subjects, 451 (38.2%) were under 50 y of age. For this age group, FRS was significantly greater when M-TBR was ≥ 1.7 (10.73% ± 7.04%) than when M-TBR was < 1.7 (8.55% ± 5.59%; Fig. 1B). Subjects of older age groups also showed a tendency for greater FRS when M-TBR was ≥ 1.7, although this did not reach statistical significance. FRS was also significantly greater when IMT was ≥ 0.75 mm than when IMT was < 0.75 mm for subjects < 50 y (11.8% ± 8.0% vs. 8.5% ± 5.4%) and those between 50 and 60 y (15.2% ± 9.1% vs. 11.9% ± 7.0%; Fig. 1B).
Because the relations of M-TBR and IMT to FRS were influenced by age, we performed linear regression analysis between M-TBR or IMT and clinical variables in subjects divided into those under and over 50 y. The results showed that for subjects < 50 y, high M-TBR significantly correlated with age, abdominal fat, waist circumference, body mass index, systolic and diastolic blood pressure, total cholesterol, HDL, LDL, triglyceride, IMT, and FRS. For subjects ≥ 50 y, variables with significant correlation were age, abdominal fat, waist circumference, body mass index, total-cholesterol, HDL, LDL, bilateral IMT, and FRS (data not shown). Stepwise multiple regression analysis using variables with significant correlation revealed abdominal fat, LDL, and FRS as independent determinants of high M-TBR for subjects < 50 y. Independent determinants for subjects ≥ 50 y were age, abdominal fat, LDL, and IMT (Table 2).
Multiple Regression Analysis for Independent Determinants for M-TBR and IMT According to Age Group
Univariate analysis for IMT showed that in subjects < 50 y, high IMT significantly correlated with age, abdominal fat, waist circumference, body mass index, systolic and diastolic blood pressure, fasting blood glucose, total cholesterol, LDL, triglyceride, M-TBR, mean TBR, and FRS. For subjects ≥ 50 y, significant univariate variables were age, abdominal fat, waist circumference, body mass index, systolic blood pressure, total cholesterol, HDL, HbA1C, M-TBR, and FRS (data not shown). Among these, independent determinants of high IMT were abdominal fat, HbA1c, total cholesterol, and M-TBR for subjects < 50 y and age, abdominal fat, body mass index, FRS, and mean TBR for subjects ≥ 50 y (Table 2).
Carotid 18F-FDG Uptake Stratifies Estimated Risk Incremental to hsCRP
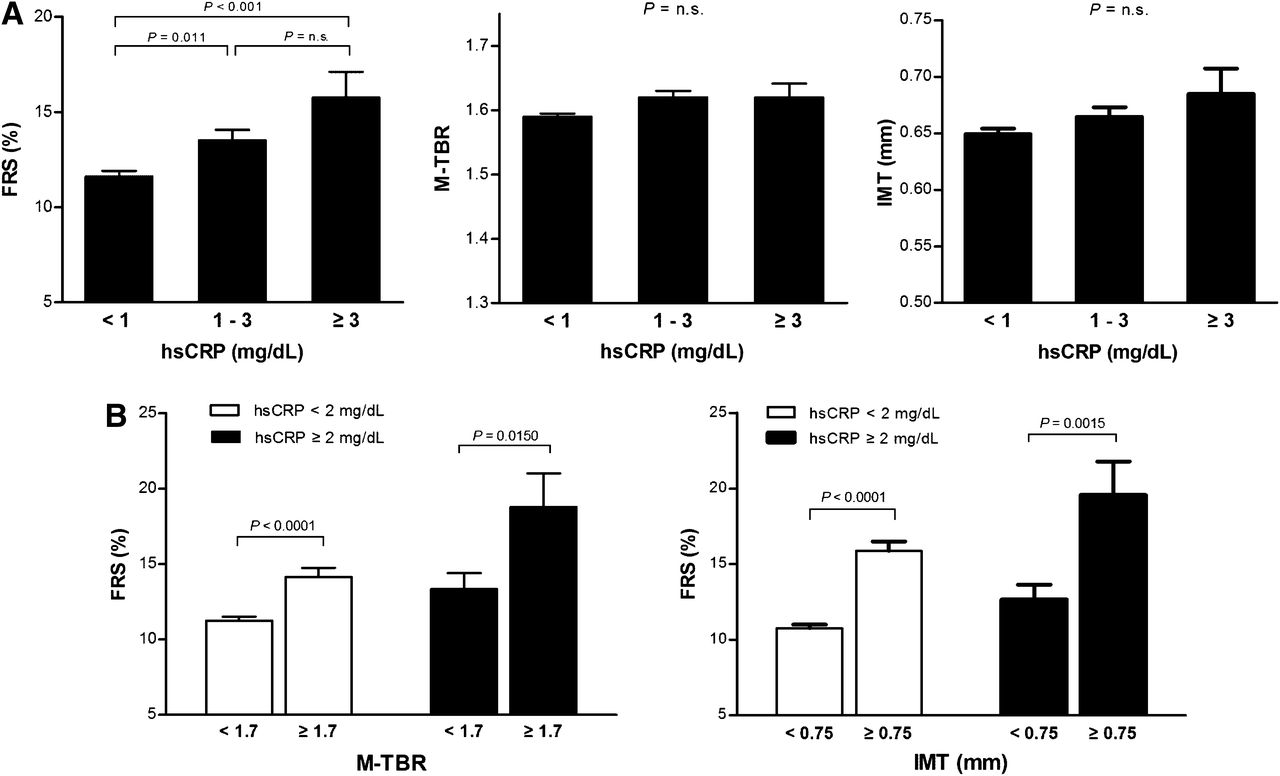
To evaluate whether carotid 18F-FDG uptake provides risk-associated information incremental to hsCRP, we first evaluated how FRS, M-TBR, and IMT are influenced by hsCRP level. As a result, FRS was found to significantly increase from 11.63% ± 8.13% for the low-hsCRP (<1 mg/L) group to 13.51% ± 8.67% for the intermediate-hsCRP (1–3 mg/L) group and further increased to 15.75% ± 12.23% for the high-hsCRP (≥3 mg/L) group (Fig. 2A). In contrast, according to hsCRP groups there was no significant difference in M-TBR (1.59 ± 0.15 for low-hsCRP, 1.62 ± 0.16 for intermediate-hsCRP, and 1.62 ± 0.19 for high-hsCRP groups) or IMT (0.65 ± 0.14 for low-hsCRP, 0.66 ± 0.13 for intermediate-hsCRP, and 0.67 ± 0.20 mm for high-hsCRP groups) (Fig. 2A).

Relation of hsCRP to FRS, M-TBR, and IMT. (A) FRS (left), M-TBR (middle), and IMT levels (right) according to hsCRP categories. (B) Estimated risk based on FRS in subjects categorized by hsCRP and substratified by M-TBR (left) or IMT level (right). Bars are mean ± SE. n.s. = not significant.
We next characterized traditional clinical risk factors and FRS in subjects stratified by hsCRP (threshold, 2 mg/L) and substratified by M-TBR (threshold, 1.7) or IMT (threshold, 0.75 mm). Among subjects with an hsCRP < 2 mg/dL, those with high M-TBR were associated with greater waist circumference, body mass index, systolic blood pressure, abdominal fat, total cholesterol, LDL, and IMT (Table 3). Among subjects with hsCRP ≥ 2 mg/dL, those with high M-TBR had significantly greater abdominal fat, LDL, IMT, and lower HDL (Table 3). Using mean TBR (threshold, 1.4) for stratification led to largely similar results (data not shown). Among subjects with an hsCRP < 2 mg/dL, those with high IMT had significantly greater age, body mass index, systolic blood pressure, waist circumference, abdominal fat, fasting blood glucose, HbA1c, and TBR (Table 4). Among subjects with hsCRP ≥ 2 mg/dL, those with high IMT had significantly greater age, waist circumference, abdominal fat, and TBR (Table 4).
Subject Characteristics Stratified by hsCRP and M-TBR
Subject Characteristics Stratified by hsCRP and IMT
Importantly, in subjects with an hsCRP < 2 mg/dL, FRS was significantly greater for those with high M-TBR than with low M-TBR (14.2 ± 9.7 vs. 11.3% ± 7.4%) and greater in those with higher hsCRP (18.8 ± 14.3 vs 13.3% ± 10.2%; Fig. 2B). The odds ratio for an FRS ≥ 10% between high and low M-TBR was 1.20 (95% CI, 0.90–1.60; P = 0.209) for subjects with hsCRP < 2 mg/dL and 2.95 (95% CI, 1.48–5.86; P = 0.002) with higher hsCRP (data not shown). FRS was also significantly greater for high IMT than for low IMT, both in subjects with hsCRP < 2 mg/dL (19.6 ± 14.9 vs. 12.7% ± 9.1%) and those with higher hsCRP (15.9 ± 10.1 vs. 10.8% ± 7.0%; Fig. 2B). The odds ratio for an FRS ≥ 10% between high and low IMT was 2.64 (95% CI, 1.96–3.56; P < 0.0001) for subjects with hsCRP < 2 mg/dL and 2.27 (95% CI, 1.06–4.85; P < 0.05) with higher hsCRP (data not shown).
DISCUSSION
This study compared carotid 18F-FDG uptake level to hsCRP concentration in a large number of asymptomatic adults and further investigated the relation of these inflammation markers to FRS as an estimate of cardiovascular risk. As a result, both carotid 18F FDG uptake and hsCRP correlated significantly with FRS but not with each other.
The PET examinations in the current study were part of a health checkup program to screen the whole body for possible hidden malignancy. It is not uncommon in clinical practice to encounter cases where whole-body 18F-FDG PET conducted for some other purpose detects unexpected cancers or premalignant lesions. As such, 18F-FDG PET is sometimes used for cancer screening, particularly in some Asian institutions. Previous reports from such institutions show that whole-body PET has the potential to reveal hidden malignancies in 1%–2% of unsuspecting subjects. However, it should be mentioned that there is controversy regarding the routine use of 18F-FDG PET in the screening setting, and future randomized prospective clinical trials are likely to be required to determine the efficacy or cost-effectiveness of 18F-FDG PET for this purpose (23).
In our subjects, high carotid 18F-FDG uptake was significantly associated with traditional cardiac risk factors including abdominal fat, waist circumference, body mass index, systolic blood pressure, and higher levels of total cholesterol and LDL. This finding is consistent with results of several previous observations (7–12). Although 18F-FDG uptake can be partly influenced by blood glucose concentration, there was no correlation of blood glucose and HbA1c levels measured on the morning of the PET study to maximum SUV or M-TBR of 18F-FDG uptake (data not shown), indicating that this was not a significant factor in the results of our study subjects. High 18F-FDG uptake in our study was also associated with greater IMT measurements and increased estimates of cardiovascular risk based on FRS. FRSs are used to determine an individual’s chance of developing cardiovascular disease within the next 10 y. Because the 2002 FRS predicts only future coronary heart disease events, the 2008 general cardiovascular FRS was developed to include risk for stroke, transient ischemic attack, and heart failure. Accordingly, the predicted risk for an individual usually is higher with the general cardiovascular FRS that we used than with the 2002 FRS.
Although the general cardiovascular FRS estimates an individual’s risk of having coronary heart disease events at 10 y, it is not a direct measure of cardiac events. The lack of actual outcome data is therefore a limitation of this cross-sectional study. Another limitation of the current study is that no comparison was performed between carotid 18F-FDG uptake and coronary calcium scores.
In contrast to several cardiac risk factors and FRS, no significant relation was found in our results between carotid 18F-FDG uptake and hsCRP concentration. Although 18F-FDG uptake and circulating hsCRP are both markers of inflammation, there is no clear consensus regarding their relation in atherosclerosis patients (19–21). Given the widely recognized role of hsCRP in predicting cardiovascular events, lack of correlation with 18F-FDG uptake suggests that the 2 markers may represent different aspects of atherosclerotic inflammation. Our finding is at variance with a recent study that observed a significant correlation between carotid 18F-FDG uptake and hsCRP in 120 subjects undergoing health screening (19). In addition to the relatively small number of subjects, however, this study measured only 10 slices of the right carotid artery, compared with the full length of both carotid arteries including segments above the bifurcation site analyzed in our study. Also, the study of Yoo et al. excluded patients with a history of significant diseases or inflammatory conditions (19), whereas our study was based on an unselected cohort of asymptomatic individuals undergoing health screening. Our study is therefore more likely to have included subjects with nonspecific inflammation elsewhere in the body that could have further weakened the relation between serum hsCRP concentration and carotid TBR level.
It was noted in our analysis that subjects with high 18F-FDG uptake were also of significantly greater age. A general connection between 18F-FDG uptake and age has been observed in the carotid (8,24) and larger arteries (25), and advanced age is an established risk factor for cardiovascular disease (26). We therefore reanalyzed the relation between carotid 18F-FDG uptake and FRS, adjusting for age by stratification. As a result, a significant relation between M-TBR and FRS was confirmed for subjects < 50 y. Stepwise multiple regression in this age group revealed FRS, along with abdominal fat and LDL, to be independent determinants of M-TBR. Although statistical significance was not reached, older age groups also displayed a tendency of increased FRS with higher M-TBR. Advanced age is possibly the strongest predictor of cardiovascular risk (26). In our study, mean FRS exceeded 30% for subjects over 70 y and approached 20% for those over 60 y. It is therefore likely that, in older age groups, the strong influence of age on FRS somewhat weakened its apparent relation to TBR.
In our results, serum hsCRP was significantly associated with FRS. This is consistent with the known role of CRP as an independent predictor of carotid atherosclerosis progression, poor cardiovascular outcome, incident myocardial infarction, ischemic stroke, and sudden cardiac death (11–18). Given the well-recognized predictive value of hsCRP, we explored whether carotid 18F-FDG uptake may provide incremental risk–related information. As a result, whereas both M-TBR and hsCRP were significant predictors of estimated cardiovascular risk based on FRS, the biomarkers displayed poor association between themselves. Indeed, although M-TBR correlated significantly with many other clinical risk factors, it showed no correlation to hsCRP, suggesting that any prognostic information these biomarkers hold could be independent of each other. Furthermore, among subjects with low hsCRP and those with high hsCRP, higher M-TBR substratified subjects with increased clinical risk factors and greater FRS. Taken together, these results suggest the possibility that carotid 18F-FDG uptake may offer risk-associated information incremental to hsCRP. Further prospective studies are thus warranted to determine the precise incremental prognostic value of carotid 18F-FDG PET for predicting the clinical outcome of patients with atherosclerosis.
CONCLUSION
High carotid 18F-FDG uptake in asymptomatic adults is associated with increased clinical risk factors and greater FRS. Furthermore, carotid 18F-FDG uptake appears to reflect aspects of atherosclerotic inflammation distinct from hsCRP level and may offer incremental risk–related information. These findings warrant the need for further investigations to illuminate the ability of carotid 18F-FDG uptake to predict cardiovascular risk independent of the effects of other risk factors.
DISCLOSURE
The costs of publication of this article were defrayed in part by the payment of page charges. Therefore, and solely to indicate this fact, this article is hereby marked “advertisement” in accordance with 18 USC section 1734. This work was supported by the Samsung Biomedical Research Institute grant C-A9-225-3 and In-Sung Foundation for Medical Research grant C-A9-862-1. No other potential conflict of interest relevant to this article was reported.
Footnotes
Published online Oct. 31, 2013.
- © 2013 by the Society of Nuclear Medicine and Molecular Imaging, Inc.
REFERENCES
- Received for publication January 15, 2013.
- Accepted for publication May 20, 2013.


Jump to section
Related Articles
Cited By...
- Joint Effect of Carotid Plaque and C-Reactive Protein on First-Ever Ischemic Stroke and Myocardial Infarction?
- Metabolic and Molecular Imaging of Atherosclerosis and Venous Thromboembolism
- PET/CT Imaging of Unstable Carotid Plaque with 68Ga-Labeled Somatostatin Receptor Ligand
- The Future of Cardiovascular Imaging
- Carotid FDG Uptake Improves Prediction of Future Cardiovascular Events in Asymptomatic Individuals
- Oxidized Low-Density Lipoprotein Stimulates Macrophage 18F-FDG Uptake via Hypoxia-Inducible Factor-1{alpha} Activation Through Nox2-Dependent Reactive Oxygen Species Generation
- 18F-FDG Imaging of Carotid Arteries for Identifying the Vulnerable Patient: Are We at the Beginning of the End?