


Abstract
Research and discovery of novel radiopharmaceuticals and targets thereof generally involves initial studies in cell cultures, followed by animal studies, both of which present several inherent limitations. The objective of this work was to develop a tissue bioreactor (TBR) enabling modulation of the microenvironment and to integrate the TBR with a small-animal PET scanner to facilitate imaging biomarker research and discovery and validation of radiopharmaceuticals. Methods: The TBR chamber is a custom-blown, water-jacketed, glass vessel enclosed in a circulating perfusion bath powered by a peristaltic pump, which is integrated within the field of view of the PET scanner. The chamber is in series with a gas exchanger and a vessel for degassing the system during filling. Dissolved oxygen/temperature probes and septa for injection or sampling are located at the inlet and outlet of the cell chamber. A pH probe is located at the chamber outlet. Effluent is collected in the fraction collector as mixed-cup samples. In addition, both medium and tissue chamber can be sampled to investigate tissue and secretory products through multiscale analysis. As a proof of concept, we studied the effects of lipids on glucose uptake using HepG2 cells. To that end, we varied the nutrient substrate environment over a period of approximately 27 d, before and after the addition of lipids, and studied the effects of pioglitazone, a peroxisome proliferator-activated receptor γ agonist, on lipid and glucose uptake. In parallel, the TBR was imaged by PET in conjunction with 11C-palmitate in the presence and absence of lipids to characterize 11C-palmitate uptake. Results: The O2 consumption, glucose consumption, lactate production, and free fatty acid consumption and production rates were consistent in demonstrating the effects of lipids on glucose uptake. Pioglitazone exhibited improved glucose uptake within 3 d of treatment. Semiquantitative analysis suggested that lipids induced greater 11C-palmitate uptake. Conclusion: The integrated TBR offers a platform to monitor and modulate the tissue microenvironment, thus facilitating tissue-specific imaging and therapeutic biomarkers of disease, identification of molecular diagnostic markers, and validation of radiopharmaceuticals in both rodent and human cell lines.
Research and discovery (R&D) of biomarkers of disease, both diagnostic and therapeutic, is an active area of research partly because of the availability of multiscale data (e.g., genomic and proteomic). These biomarkers, in turn, provide a foundation for the targeted development of PET radiopharmaceuticals. Validation of novel radiopharmaceuticals and targets thereof generally involves initial studies in cell cultures, followed by animal studies, both of which present several inherent limitations. For example, when cells are isolated from their in vivo environment, they are usually seeded in a monolayer environment with limited cell–cell contact and bathed in a static medium, resulting in the loss of spatiotemporal cues (1,2). Animal studies, on the other hand, are limited by a variety of factors including low blood volume (mice), the use of anesthesia, temperature variability, substrate environment, animal handling and stress, and the effects of fasting versus fed conditions (3–5), among others. To better mimic the cellular environment, 3-dimensional (3D) culture systems may complement animal studies for imaging R&D.
Indeed, 3D culture systems, formally defined as tissue bioreactors (TBRs), are increasingly being applied to study tissue mechanisms under well-defined culture conditions (6,7). A TBR is a versatile system designed to simulate the 3D structure and microenvironment of tissues in vivo, thus preserving the spatiotemporal cues that reside in the local microenvironment. To that end, a plethora of bioreactor designs has been described in the literature (8) primarily for in vitro applications, tissue engineering (9), and artificial support for patients (10). From an imaging research perspective, however, TBRs offer an environment in which biologic processes can be closely controlled and monitored (pH, temperature, pressure, nutrient supply, waste removal) by design (9). Moreover, bioreactors offer a platform for imaging R&D by allowing manipulation of specific tissue processes under controlled conditions to elucidate tissue-specific disease mechanisms and imaging biomarkers thereof. In light of these considerations, the objective of this work was to develop an integrated TBR for imaging research.
In designing the TBR, we sought to fulfill the following objectives: establish a 3D environment to mimic in vivo conditions; enable constant control and monitoring of the tissue microenvironment, thus facilitating interpretation and utility of radiopharmaceuticals; develop a platform to facilitate metabolite analysis of candidate radiopharmaceuticals; facilitate R&D of tissue-specific biomarkers for targeted imaging through tissue-specific manipulation of biologic processes; provide a means to sample both tissue and serum to facilitate R&D of biomarkers through subsequent multiscale analysis; develop a modular platform that could accommodate rodent or human cells to facilitate analysis and translation of radiopharmaceuticals (e.g., in characterizing variability in species metabolites); facilitate imaging and interpretation of response to drug therapy; and, finally, integrate the TBR with the microPET Focus F220 (Siemens, Inc.) to facilitate interpretation of imaging data.
In this work, we present the system design of the TBR and perform initial proof-of-concept studies. The TBR described within meets the objectives set out above. As a proof of concept, we studied the effects of lipids on glucose uptake using HepG2 cells, a hepatocellular carcinoma cell line. The choice of using a liver cell line at this stage in the development of the TBR was motivated by 2 factors. First, the liver is the primary organ of metabolism, thus we sought to confirm the feasibility of culturing a 3D liver cell line to facilitate radiopharmaceutical metabolite analysis. And second, the liver is integral in the pathogenesis of various metabolic diseases. To study the effects of lipids on glucose uptake, we varied the nutrient substrate environment over a period of approximately 27 d, before and after the addition of lipids, and studied the effects of pioglitazone, a peroxisome proliferator-activated receptor γ (PPARγ) agonist. In doing so, we confirmed previous observations with respect to the effects of lipids on glucose uptake in this cell line. Overall, the integration of artificial tissue bioreactors with PET imaging offers tremendous opportunities to facilitate imaging R&D and radiopharmaceutical validation.
MATERIALS AND METHODS
TBR System Description
A schematic diagram of the TBR system is shown in Figure 1A. The cell chamber is in a circulating perfusion path powered by a peristaltic pump (Watson-Marlow) with a tube-in-shell gas exchanger, septa for sampling or bolus injection, and another custom-blown vessel needed to degas the system during filling and priming. Dissolved oxygen (DO) probes with temperature sensors (Cole-Parmer) are located at the inlet and outlet of the cell chamber, and a pH probe (Cole-Parmer) is located at the chamber outlet. Fresh medium is pumped continuously into the TBR near the outlet of the degas vessel and circulated through the system. The effluent is collected in the fraction collector (VWR) as mixed-cup samples that can be stored for later analyses or is directed to waste. The TBR accepts bolus, step-pulse, and constant composition as 3 general modes of input to the system. The cell chamber (insert, Fig. 1B) is a custom-blown, water-jacketed, glass vessel containing borosilicate glass beads between 1.4 and 1.7 mm in diameter with a measured void space of 40%. Septa ports are located along the length of the chamber for obtaining cell samples for Western blots, reverse transcription polymerase chain reaction, and microarray assays. A platform designed to fit in the microPET Focus F220 scanner holds the cell chamber and sampling septa proximal to the chamber inlet and outlets. The system is computer-controlled using an Instrunet network card integrated with software data acquisition and process control with DASYLab (National Instruments). Additional details on the TBR system are provided in the supplemental section (supplemental materials are available at http://jnm.snmjournals.org).

Schematic diagram of TBR system integrated with microPET Focus F220. (A) Cell chamber is integrated with microPET Focus F220 scanner in series with sensor probes, gas exchanger, degas vessel, and peristaltic pump. (B) Detailed schematic of cell chamber. C = carbon dioxide; DO/TMP = combined dissolved O2 and temperature probe; MFC = mass flow controllers; N = nitrogen; O = oxygen; S = septa.
Reagents and Assays
HepG2 cells were obtained from American Type Culture Collection. Dulbecco modified Eagle medium (D5030; Sigma) without glucose, pyruvate, l-glutamine, phenol red, or bicarbonate was used throughout the experiment to allow modification of the feed composition as needed. A description of the final medium preparation is detailed in the supplemental section. The glucose concentration of the medium samples was measured using a commercial assay kit (GAGO20; Sigma-Aldrich) modified for use in 96-well microplates. Lactate was measured using a 96-well modification of the procedure given in the product information sheet for Sigma-Aldrich lactate dehydrogenase (L3916) (11). All of the reagents for this procedure were purchased from Sigma-Aldrich. The procedures and reagents for determining nonesterified fatty acids (NEFA) (HR Series NEFA-HR) and triglycerides (l-Type TG M) were obtained from Wako Diagnostics and performed by the Diabetes Research Center at Washington University School of Medicine.
Proof-of-Concept TBR Studies
As proof of concept, we designed a TBR study to investigate the effects of lipids on glucose uptake and fatty acid (FA) metabolism on HepG2 cells at various time points in the intervention. In addition, the therapeutic response was assessed with the addition of pioglitazone, which is known to stimulate glucose utilization (12,13). Finally, a PET imaging study was performed to assess response of the system in vivo.
Bioreactor Setup
The bioreactor was cleaned, autoclaved, and filled with prepared medium containing 5.55 mM glucose 2 d before inoculation to allow pH, temperature, and dissolved oxygen equilibration. HepG2 cells were maintained in prepared medium with 5.55 mM glucose (normal glucose) in a 37°C, 5% CO2, humidified incubator. The cells were expanded for inoculation under the same conditions in 3-layer T175 flasks (BD-Falcon). The cells from all flasks were trypsinized, combined, rinsed, and centrifuged. The pellet was suspended in 5 mL of fresh medium, drawn into a syringe, and injected into the bioreactor. The volume of cells injected was 1.4 mL or approximately 3.5 × 10⁸ cells.
Experimental Protocol
System perturbations were made according to the experimental protocol, which is outlined with corresponding time stamps in Table 1. The bioreactor was prepared, equilibrated, and inoculated (time zero) as described in the “Bioreactor Setup” section. Medium feed (normal glucose) was started once the cells had aggregated and settled into the bead matrix (Table 1, time stamp A). Effluent samples were collected every hour, except where noted, and the samples frozen and saved for later glucose, lactate, and NEFA analyses.
Event Time Stamps in TBR Experiments
The cell mass was allowed to expand for 5 d before the first glucose uptake test. The glucose concentration in the feed medium was reduced to 25 mg/dL (low glucose) approximately 20 h before bolus glucose dosing to simulate fasting conditions (Table 1, time stamp B). A bolus of concentrated glucose solution calculated to achieve a maximum plasma concentration (Cmax) of 300 mg/dL under no cell condition was injected (Table 1, time stamp C). The low glucose composition and input flow rate was kept constant during the glucose uptake test.
Samples were collected every 10 min for the first hour of the glucose uptake test, and then once per hour thereafter. After 24 h, the input medium flow was returned to normal glucose level and lipid added (Table 1 and Fig. 2, time stamp D). The glucose uptake test was repeated after exposure to lipid (Table 1, time stamps D–F) and after lipid exposure and treatment with pioglitazone for 3 d at 1 μg/mL (Table 1, time stamps G–I). This concentration of pioglitazone (a 15- to 45-mg tablet results in a 0.5–1.0 μg/mL blood Cmax) has been shown to reduce fat accumulation and improves glucose uptake in the liver (12,13). The glucose concentration measured on the effluent samples was used to evaluate glucose uptake.

Metabolic parameters during TBR study. (A) Concentration of glucose in feed, effluent (left axis), and consumption rate (right axis). (B) Concentration of FFA in feed, effluent (left axis), and production rate (right axis). (C) Concentration of lactate in feed, effluent (left axis), and production rate (right axis). Glucose, lactate, and FFA rate were calculated from piecewise function fitted curves. Refer to Table 1 for description of time stamps. Operational parameters throughout experiment: feed flow rate (Qfeed) = 0.5 mL/min, media recycle flow rate (Qrcy) = 50 mL/min, oxygen partial pressure (pO2) = 21%, pH set point = 7.3, and temperature = 37°C.
Estimation of Metabolic Rates
The global consumption and production rates (glucose, lactate, free fatty acid [FFA]) and oxygen were calculated using the discrete form of the continuity equation for a perfectly mixed stirred tank reactor and plug flow reactor, respectively, as detailed in the supplemental data.
Imaging of Integrated TBR
11C-Palmitate Metabolism in TBR Medium
To characterize the metabolism of 11C-palmitate in TBR medium, that is, to confirm that 11C-palmitate is not metabolized by serum and serum does not trap CO2 metabolites, we performed a set of experiments originally performed to characterize the metabolism of 11C-palmitate in blood samples (14). In particular, we added 5 μL of 37 MBq (1.0 mCi) of 11C-palmitate and 5 μL of 37 MBq (1.0 mCi) of 11C-CO2 to a control and test plates containing 5 mL of normal medium (2 tracers and 2 conditions in duplicate; 8 plates total). All plates were counted for initial activity (time, 0). In test plates, 11C-CO2 activity was quantified on the basis of the loss of 11C-CO2 under acidic conditions (14). The percentage of tracer extracted was calculated by the ratio of postactivity to preactivity, and the results are summarized in Table 2.
11C-Palmitate Metabolism in TBR Medium
PET Imaging of TBR
The cell chamber was affixed to a custom-designed platform, and the assembly was centered in the scanner. A 20-min transmission scan was obtained to correct for attenuation. A bolus of 37 MBq (1.0 mCi) of 11C-palmitate was injected downstream of the cell chamber to maximize mixing efficiency before reaching the cell chamber inlet. Subsequently, a 45-min dynamic PET acquisition was initiated 5 s after the injection. Eighteen medium samples (30–100 μL) were drawn manually from the septa located upstream and downstream of the cell chamber to quantify the input function. The fraction collector was set to collect a sample every minute. All samples were counted using an 8000 γ-counter (Beckman Coulter) and corrected for CO2 metabolites (14). On completion of this imaging session, the lipid was eliminated from the feed medium, the glucose concentration was returned to normal level, and the maintenance feed flow rate resumed. After 5 d, the PET imaging protocol was repeated on the cells equilibrated to lipid-free medium. In a separate run of the TBR, the TBR was imaged with 18F-FDG (37 MBq [1.0 mCi]) for approximately 80 min in order to compare the kinetics of 18F-FDG with those of 11C-palmitate in HepG2 cells. Kinetic time–activity curves for both 18F-FDG and 11C-palmitate are provided in Supplemental Figure 1 and highlight differences in substrate preference by the cells. All imaging studies were performed using the Focus F220 small-animal PET scanner.
Image Reconstruction
Image sinograms were reconstructed using filtered backprojection with 26 frames. All frames were summed into a single image to facilitate drawing regions of interest. A region of interest was drawn over the entire TBR chamber to capture the entire area where cells may be present and over smaller subregions within the matrix to examine heterogeneity of 11C-palmitate uptake.
Statistical Analysis
Linear regression and coincidence of slope (15) tests were used to determine significant changes in oxygen consumption rates. A Student t test was performed to assess differences in glucose uptake under the various interventions.
RESULTS
Metabolic Rates in Presence of High Lipid Levels
In this feasibility study, we monitored glucose consumption rate, lactate production rate, and FFA consumption and production rate. The graphs of these processes are shown in Figure 2. In Figure 3, we depict the O2 consumption rate along with the pH and the pCO2 necessary to maintain it. The letter time stamps on the time axis are identified in Table 1.

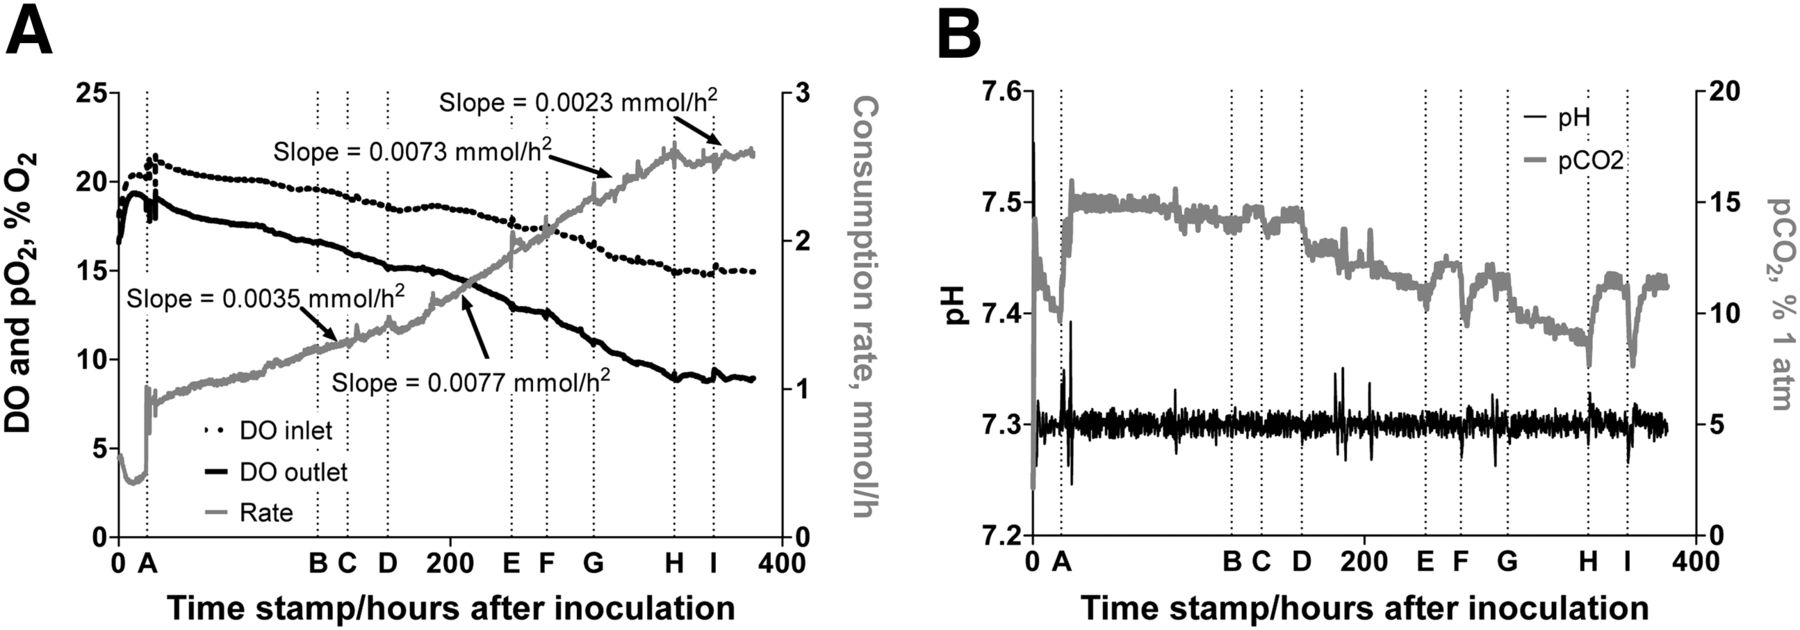
Physiologic parameters during TBR study. (A) DO and oxygen partial pressures (pO2) (left axis) and O2 consumption rate (right axis). (B) pH (left axis) and CO2 partial pressure (pCO2) needed to maintain pH (right axis). Operational parameters throughout experiment: feed flow rate (Qfeed) = 0.5 mL/min, media recycle flow rate (Qrcy) = 50 mL/min, pO2 = 21%, pH set point = 7.3, and temperature = 37°C.
In the period between inoculation at time zero and the start of feed (time stamp A), metabolic substrates are consumed and metabolic products and byproducts accumulate as seen in Figures 2A, 2B, and 2C, respectively. The decreases in O2 consumption and pCO2 (Fig. 3A) during this period are likely attributable to decreasing substrate supply and accumulation of acidic products, respectively. Nutrient levels are quickly reestablished, and accumulated products are flushed from the system after the start of fresh medium flow. The O2 consumption rate increases steadily thereafter, reflecting cell growth. A major utility of these plots is the ability to examine the interaction among the various metabolic processes and observe the responses of all processes when a perturbation is made to only one. It is observed that, when the glucose concentration is reduced there is a subsequent reduction in lactate concentration and increase in pCO2 (Fig. 3B). Conversely, a glucose bolus or increase in feed concentration resulted not only in the expected glucose rise, but also in increased lactate and decreased pCO2.
The early points in Figure 2B show that HepG2 cells produced FFA when the concentration in the feed is limited to that supplied with the serum, but it is unexpected that the addition of high FFA to the feed would result in a higher net production of FFA (the FFA composition of the effluent was not determined). The concurrent doubling of the slope of the O2 consumption curve (Fig. 3A) suggests that the increased FFA in the feed stimulated cell growth, which in turn stimulated the cells to produce more FFA. The fact that cancer cells produce FFA even when the endogenous level is high has been shown in vivo (16). The further increase in FFA corresponding to glucose deprivation (time stamp E) is most likely a result of TG breakdown rather than increased FFA production. The addition of pioglitazone resulted in higher glucose consumption rate; however, an increase in FFA production on glucose deprivation is not observed. In fact, there is a decrease in the FFA production rate and O2 consumption rate is substantially reduced. These observations are consistent with recent use of PPARγ agonist as antitumor drugs (17–22). After the removal of pioglitazone, the O2 consumption rate again increased as the cells were expanded for the imaging portion of the experiment (DO was about 3.9% at start of imaging studies; data not shown).
The areas under the curve (AUC), corrected for baseline differences, for the 3 glucose uptake tests are plotted in Figure 4A. Consistent with the data above, glucose uptake is impaired in the presence of a high concentration of FAs; glucose consumption was restored by treatment with pioglitazone. The intercellular FFA and TG content of the cell samples obtained through the septa of the cell chamber are plotted in Figure 4B. The intercellular FFA and TG level is high before the addition of lipid to the feed. There is a large decrease in the FFA and TG levels after the introduction of the lipid, although there was a substantial increase in FFA in the bioreactor effluent beyond that attributable to the amount added. It is possible that the increased lipid in the effluent was caused by breakdown of TG and secretion of excess FFA. One caveat to recognize is that the cell sampling alternated between the upper and lower septa, and because there is measured O2 gradient along the length of the chamber, other metabolic gradients may exist as well. There is a drastic decrease in FA and TG with the introduction of pioglitazone, and the levels continue to drop through the glucose deprivation and subsequent glucose uptake test.

(A) AUCs for 3 glucose uptake tests. Glucose concentration before bolus injection was used as baseline for integration. AUC represents integral between time of glucose injection, which is defined as baseline, to time when concentration returns to baseline in Figure 2. (B) Intercellular FFA and TG content of cell samples taken from chamber. Open symbols were sampled from upper septum; closed symbols were sampled from lower septum. Averages and SD represent data from multiple sampling of chamber at given location in time. Glu = glucose; PGZ = pioglitazone.
11C-Palmitate Metabolism in Medium
Table 2 shows the percentage of tracer extracted from each sample. For medium samples containing 11C-palmitate, virtually all activity was recovered, indicating that the medium itself does not metabolize the tracer. In samples containing 11C-CO2, we extracted all the 11C activity in the untreated control plate; however, when the 11C-CO2 extraction scheme was applied to the plate (14), virtually all the 11C-CO2 was eliminated, leaving none to be extracted. This shows that the medium also does not trap any 11C-CO2 metabolites.
PET Imaging of TBR
After completion of the glucose uptake test studies, the pioglitazone was removed from the feed and the composition restored 100 mg/dL glucose and 100 μM FFA. The cell mass was expanded to increase cell density for better image resolution. The inlet and outlet DO levels, which were used to gauge changes in cell number, decrease from 14.9% and 8.9%, respectively, to 11.8% and 3.7%, respectively, over this period, and at the end of the experiment 3.4 mL of packed cell volume was removed from the chamber. PET imaging was performed with 11C-palmitate to quantify FA uptake. A summed dynamic image from the first scan session (high lipid in feed) is shown in Figure 5. In Figure 6A, we compare the image-derived input curve with that obtained manually at the inlet to the chamber and to that of the effluent. Figure 6B highlights regional heterogeneity in 11C-palmitate uptake. The time–activity curves in Figure 7 compare the kinetic profiles of the entire TBR chamber in the presence and absence of lipids. The distribution volume (DV) ratio of 11C-palmitate relative to the activity in medium in the absence of lipids is DV(−) = 4.04 whereas in the presence of lipids it is DV(+) = 5.62, representing approximately a 40% increase.

Coronal and sagittal views of TBR highlighting heterogeneity within chamber. Arrows indicate direction of flow from top of chamber to bottom. Max = maximum.

Representation of input function curve (A) in absence of cells in chamber (solid line) depicting transient kinetics and in presence of HepG2 cells with sampled obtained manually from inlet to chamber (•), effluent (■), and image (◆). (B) Kinetics of 2 regions of interest depicting heterogeneity of 11C-palmitate uptake in TBR chamber as shown in Figure 5. SUV = standardized uptake value.

Serum and TBR chamber 11C-palmitate kinetics in presence and absence of lipids. (A) Normalized standardized uptake value kinetics of 11C-palmitate in medium in presence and absence of lipids. (B) Region of interest drawn in TBR chamber depicting total uptake of 11C-palmitate in presence and absence of lipids. SUV = standardized uptake value.
DISCUSSION
In this work, we showcased the development of a TBR for use in imaging R&D. Additionally, we performed initial proof-of-concept studies using HepG2 cells to highlight a potential application and concluded by imaging the TBR through its integration with the microPET Focus F220. The role of lipids in monolayer HepG2 cultures has been used to study the mechanism for the inhibition of glucose uptake (23,24) and to demonstrate the effectiveness of potential antidiabetic compounds including geniposide (25), berberine (26), and genistein (27). To that end, we chose to demonstrate the effects of lipids on glucose uptake in HepG2 to highlight the scope of the technology and the feasibility of using the TBR for PET imaging.
The metabolic parameters provide a means for consistency checks that allow for more confidence in data interpretation (Fig. 2). For instance, changes in glucose consumption coincided with changes in lactate production, indicating that a sizable portion of the glucose is metabolized by the glycolytic pathway. It is also consistent with glycolysis in that the pCO2 needed to maintain a constant pH changes with the level of lactic acid. An unexpected metabolic response was that the FFA production rate increased dramatically with the introduction of FFAs in the feed. One explanation for this increase is that the simultaneous introduction of increased glucose and lipid induced the cells to reproduce faster, thus enhancing lipid production for membrane requirements. It has been demonstrated that cancer cells produce FAs even in the presence of high exogenous levels of FAs (16). Induced cell growth is also supported by the significant increase in the slope of the O2 consumption curve from 0.0035 mmol/h2 before lipid addition to 0.0077 mmol/h2 after the addition of pioglitazone (Fig. 3A, time stamp D), which was not observed in monolayer experiments. The reason that this increased FFA production rate was not observed in monolayer experiments using HepG2 cells is that the cells in these experiments were serum-starved before and during monolayer experiments (13,23–27), which would inhibit cell growth. The increased growth rate (indicated by increased O2 consumption) without a concurrent increase in glucose consumption is consistent with the HepG2 cells having inhibited glucose uptake in the presence of a high concentration of lipids (24–27).
Deficiencies in tissue glucose uptake and its reversal after treatment with pioglitazone is seen from the glucose uptake test AUC values shown in Figure 4A and in the changes of the steady-state glucose consumption rates seen in Figure 2. We observed changes in the glucose uptake test as early as 5 d after the addition of lipids; within 4 d of pioglitazone treatment, we demonstrated response to therapy. After about 1 d of treatment with pioglitazone, the O2 consumption rate ceases to increase and maintains a steady-state level throughout the treatment period (Fig. 3A). In parallel, we see a decrease in intracellular FFA and TG levels in cells derived from the chamber (Fig. 3B), suggesting increased FA oxidation and TG breakdown. Because the O2 consumption rate began to increase again on removal of the pioglitazone in preparation of the PET imaging studies (data not shown), it is likely that the pioglitazone arrested the growth of the HepG2 cells. This observation is consistent with the current testing of the PPARγ agonist as anticancer agents (28).
The PET images show clearly that 11C-palmitate uptake is heterogeneous. At this stage in the development of the TBR, however, it cannot be determined whether the heterogeneity is a result of cell distribution, perfusion, or 11C-palmitate uptake rate, or combination thereof. Generally, higher activity is seen in the lower portion of the cell chamber. It is evident from Figure 2 that an O2 gradient exists across the cell chamber, and visual observation clearly showed that the cell density was greater in the matrix closer to the medium inlet. Therefore, it is most likely that the difference in activity observed between the upper and lower section of the chamber is due to a nutrient gradient. It has also been shown that hepatocytes in culture will adapt for different functions depending on their oxygen availability (29). We demonstrated an overall difference in the 11C-palmitate uptake between hepatocytes in the presence and absence of lipids. One confounding factor in imaging the TBR is partial-volume effects. Generating an image mask of the void space and convolving it with a kernel for the spatial resolution of the F220 scanner (full width at half maximum = FWHM ∼1.7 mm) suggests that the recovery coefficient is on the order of 38%. Thus, future studies will focus on optimizing quantification schemes for the TBR or variations thereof.
One of the stated objectives for the development of the TBR was to establish a 3D environment to mimic the in vivo conditions of tissue. Although in the current work we used HepG2 cells, on a broader scale other cell lines and tumor models may be used for imaging R&D, specifically in search and validation of tumor-specific imaging and therapeutic biomarkers. Indeed, in recent years there has been a great interest in the role of the tumor microenvironment on tumor biology (30,31). If tumor progression, whether invasive or metastatic, is viewed as the maladaptive response of an entire tissue to both genetic and epigenetic stress, then knowledge and control of the immediate microenvironment within a developing tumor becomes as important as the corresponding knowledge and control of the dysfunctional cells within that tumor. Moreover, several lines of evidence suggest that hypoxic tumors can modulate the microenvironment to secrete proteins and exosomes designed to enhance its angiogenic and metastatic potential (32). In this regard, the TBR is amenable to coculturing with multiple cells such as fibroblasts, myeloid cells, and mesenchymal stem cells, among others. In parallel, the TBR can aid in studying the interplay among oxygen tension, treatment, repopulation, and imaging of tumors.
Of the unique features of the TBR is the ability to sample both the tissue and the serum to obtain tissue-specific samples and byproduct for subsequent analysis. Tissue-specific samples can be used for validation of imaging and therapeutic biomarkers. Conversely, tissue byproducts secreted through the serum can lead to the elucidation of tissue-specific molecular diagnostic markers to correlate tissue response with tissue output. In addition, the ability to perform metabolite analysis on novel pharmaceuticals can facilitate optimization of lead radiopharmaceuticals. To that end, human cells can be used in lieu of animal cells, thus facilitating translation of radiopharmaceuticals from animals to human applications.
At present, the proof-of-concept studies represent 1 run of the TBR system to highlight the utility of the platform. In general, multiple runs or experiments in biology (i.e., biologic replicates) are needed to account for variability in the microenvironment (e.g., substrate environment) in both animal and human studies. In one respect, the TBR system may represent a paradigm shift in imaging research; because all aspects of the system environment are controlled and monitored, biologic replicates may not be necessary or minimized. To address the need for biologic replicates, one conceptual design is a system in which multiple chambers in parallel configurations are imaged. Thus, overall, additional work is needed to further characterize, optimize, and refine the utility of the TBR platform for imaging research.
CONCLUSION
We anticipate that this system will complement animal experiments in validation of PET radiopharmaceuticals, molecular and imaging biomarker development, and drug development using rodent or human cells. The TBR enables complete control and measurement of environmental factors that could influence tissue or tumor response and allows measurements of numerous metabolic parameters that can be correlated with tissue response. With that in mind, the TBR has the capacity to elucidate and characterize therapeutic and imaging biomarkers in longitudinal studies of targeted therapy through tissue-specific manipulation of biologic processes. Moreover, it can be used to obtain pharmacokinetic and pharmacodynamic parameters for experimental therapeutics and imaging applications under clinically relevant multicourse regimens. Finally, the system can be integrated with additional preclinical imaging instruments. The integration will facilitate the use of existing and novel radiopharmaceuticals in translating insights derived from TBR studies to preclinical animal studies to clinical evaluation.
DISCLOSURE
The costs of publication of this article were defrayed in part by the payment of page charges. Therefore, and solely to indicate this fact, this article is hereby marked “advertisement” in accordance with 18 USC section 1734. This work was supported by NIH grant 5R01DK085298 and partly by internal MIR funding. The work utilized core-services provided by the Diabetes Research Center (DRC), grant P60DK020579, and the Nutrition Obesity Research Center (NORC), grant P30DK056341. No other potential conflict of interest relevant to this article was reported.
Acknowledgments
We thank the Preclinical PET/CT Imaging Facility at Washington University School of Medicine for technical support and the Washington University Cyclotron Facility for production of radiopharmaceuticals.
Footnotes
↵* Contributed equally to this work.
Published online Aug. 26, 2013.
- © 2013 by the Society of Nuclear Medicine and Molecular Imaging, Inc.
REFERENCES
- Received for publication January 9, 2013.
- Accepted for publication May 13, 2013.


