


Abstract
We have noted that bone lesions on CT respond differently from soft-tissue lesions to treatment with [177Lu-DOTA0,Tyr3]octreotate (177Lu-octreotate). We therefore compared the response of bone lesions with that of soft-tissue lesions to treatment with 177Lu-octreotate in patients with gastroenteropancreatic and bronchial neuroendocrine tumors (NETs). Methods: Forty-two patients with well-differentiated NETs who had bone metastases that were positive on [111In-DTPA0]octreotide somatostatin receptor scintigraphy (SRS) before treatment, and who had soft-tissue lesions, were studied. All patients had had a minimum of 1 follow-up CT scan. Lesions were scored on CT and bone lesions also on SRS before and after treatment. Tumor markers (chromogranin A and 5-hydroxyindoleacetic acid) before and after treatment were compared. Results: Because bone lesions were not visible on CT before treatment in 11 of 42 patients (26%), bone and soft-tissue lesions were evaluated in 31 patients. Whereas bone lesions increased in size, soft-tissue lesions decreased in size. The percentage change in bone and soft-tissue lesions was significantly different at all time points up to 12 mo of follow-up (P < 0.001). The intensity or number of bone lesions on SRS decreased after treatment in 19 of 23 patients (83%) in whom SRS after treatment was available. The tumor markers also decreased significantly after treatment. In 1 patient, bone lesions became visible on CT after treatment, mimicking progressive disease with “new” bone lesions, although there was an overall treatment response. Conclusion: In patients with NETs, the apparent increase in size of bone lesions or the appearance of new bone lesions on CT after treatment with 177Lu-octreotate should be interpreted cautiously, as this finding may be therapy-related rather than indicative of tumor progression.
- neuroendocrine tumor
- peptide receptor radionuclide therapy
- [177Lu-DOTA0,Tyr3]octreotate
- bone metastases
- treatment response
Gastroenteropancreatic and bronchial neuroendocrine tumors (NETs) are rare neoplasms that usually grow slowly and have a relatively indolent course. These tumors were formerly called either (bronchial) carcinoids or islet-cell tumors. Today, new classifications, such as the World Health Organization (1) and TNM (2,3) classifications, are being used for the staging and grading of NETs. The primary treatment is surgery with curative intent or debulking of the tumor mass. In cases of metastatic disease, cytoreductive options are limited. A relatively new therapy, peptide receptor radionuclide therapy with radiolabeled somatostatin analogs, is currently available in several centers (reviewed in 4).
The prevalence of bone metastases in NETs is 7%–22% (5–7). Bone metastases are associated with poor clinical outcome (6–10) and can have multiple sequelae, including bone pain, pathologic fractures, nerve root compression, spinal cord compression, and hypercalcemia (11,12). The detection of bone metastases may change the clinical management in NET patients; chemotherapy or localized radiation may be indicated, instead of liver-directed therapy (5,6).
Bone metastases in NETs can be visualized with several imaging modalities, including conventional radiography, CT, MRI, somatostatin receptor scintigraphy (SRS), bone scintigraphy, and PET/CT with, for example, 68Ga-DOTA-Tyr3-octreotide or 6-18F-fluoro-l-DOPA (5,13–16). MRI has the highest sensitivity for the detection of bone metastases in NETs (nearly 100% (17)); however, a limitation of MRI is that usually only a part of the skeleton is scanned. Therefore, it is advocated that SRS be used as a total-body screening method. SRS has an acceptable sensitivity of around 80% (18). MRI can be used to evaluate the possibility of pathologic fractures or spinal cord compression in areas of intense uptake on SRS.
In our clinical practice, we have noted that on CT, the response of bone metastases to treatment with [177Lu-DOTA0,Tyr3]octreotate (177Lu-octreotate) tends to differ from that of, for example, liver metastases. We therefore compared the radiologic response on CT of bone lesions in NETs with that of soft-tissue lesions after treatment with 177Lu-octreotate. We also evaluated the imaging characteristics of bone and soft-tissue lesions in NETs on CT performed before and after treatment with 177Lu-octreotate.
MATERIALS AND METHODS
Patients
From the patients with NETs who had been treated with 177Lu-octreotate according to protocol in our institution between January 2000 and January 2010, we retrospectively selected those with bone metastases that were positive on [111In-DTPA0]octreotide scintigraphy (SRS) before treatment, with soft-tissue lesions on CT, with digitally available CT, with a minimum of 1 follow-up CT scan, and with lesions at baseline that met the Response Evaluation Criteria in Solid Tumors (RECIST) criteria (19) for a measurable lesion (i.e., longest diameter on CT ≥ 10 mm). Exclusion criteria included radiotherapy, chemotherapy, hepatic artery embolization or chemoembolization 3 mo or less before the treatment with 177Lu-octreotate, or the presence of a second primary tumor. This study was part of the ongoing prospective study on NET patients treated with 177Lu-octreotate at the Department of Nuclear Medicine of Erasmus University Medical Center Rotterdam, which was approved by the local medical ethical committee. All patients gave written informed consent to participate in the study.
Treatment
[DOTA0,Tyr3]octreotate was obtained from Mallinckrodt. 177LuCl3 was obtained from the Nuclear Research and Consultancy Group and was distributed by IDB-Holland. 177Lu-octreotate was locally prepared as described previously (20).
Granisetron (Kytril; Roche), 3 mg, was injected intravenously 30 min before the start of the 177Lu-octreotate infusion. To reduce the radiation dose to the kidneys, an infusion of amino acids (2.5% arginine and 2.5% lysine, 1 L) was started 30 min before administration of the radiopharmaceutical and lasted 4 h. The radiopharmaceutical was coadministered using a second pump system. Cycle doses were 7.4 GBq, injected over 30 min. The interval between treatments was 6–10 wk. Patients were treated with up to a cumulative intended dose of 22.2–29.6 GBq. If dosimetric calculations indicated that the radiation dose to the kidneys would exceed 23 Gy with a dose of 29.6 GBq, the cumulative dose was reduced to 22.2–27.8 GBq. Routine testing of hematology and liver and kidney function was performed before each therapy and at follow-up visits.
Comparison of Bone and Soft-Tissue Lesions
Bone and soft-tissue lesions were scored on CT (Somatom, Sensation 64; Siemens Healthcare) at baseline; 6 wk after treatment; 3, 6, and 12 mo after treatment; and when progressive disease (PD) occurred. Soft-tissue lesions were categorized as liver lesions or as other lesions.
A maximum of 3 bone lesions, 5 liver lesions, and 3 other lesions was chosen. If patients had received previous radiotherapy, only nonirradiated lesions were chosen for measurements. If a liver lesion had been treated with radiofrequency ablation, it was not assessed. If the liver was enlarged and liver lesions could not be measured separately, the size of the total liver was measured instead. This decision was made by an experienced radiologist.
Lesions were measured according to RECIST (19) and the Southwest Oncology Group criteria (21). For RECIST, the sum of the longest diameters of lesions was calculated. For the Southwest Oncology Group criteria, the sum of the products of the perpendicular diameters of lesions was calculated.
SRS and Laboratory Values
The intensity and number of bone lesions on SRS before and after treatment were compared visually. Various tumor markers and potential tumor-volume–related determinants in serum at baseline were compared with the values at the time point of best response, which was defined as the time point of the best response achieved in soft-tissue lesions according to RECIST.
Aspect of Lesions
In addition to lesion size measurement, various aspects of lesions were scored. For all lesions, the visual appearance of a boundary with surrounding tissue was scored and the Hounsfield units (HUs) were determined by placing a region of interest as large as possible. For bone lesions, cortical destruction was also assessed. Liver metastases (which were assessed in the venous phase of contrast enhancement) were also scored according to homogeneity or heterogeneity of lesions, aspect of heterogeneity if applicable, and density of lesions when compared with normal liver parenchyma (hypodense, hyperdense, or isodense).
Best-Response Categories
Best-response category was defined as the best response according to RECIST achieved in soft-tissue lesions after treatment. Best response had to be confirmed on a subsequent CT scan. If a patient had only 1 follow-up scan (and thus no confirmatory scan), the best response was unknown.
Statistics
Independent t tests, paired t tests, Wilcoxon signed-rank tests, McNemar tests, Mann–Whitney U tests, and χ2 tests (or, if applicable, Fisher exact tests) were used. To compare the response of bone and soft-tissue lesions, paired t tests were used and a repeated-measurement analysis was performed. In this analysis, different regression lines were fitted for bone and soft-tissue lesions. The dependency between measurements of the same tumor was fitted using an unstructured covariance matrix. The SPSS (version 15.0; IBM) and SAS (version 9.2; SAS Institute Inc.) packages were used. Two-sided P values are reported. P values of less than 0.05 were considered to be significant.
RESULTS
Seventy-five patients had bone metastases and soft-tissue lesions. In 23 patients, a baseline CT scan was not digitally available (which was necessary for HU measurement). Four patients had no follow-up CT scan. Six patients did not meet other inclusion criteria. Thus, 42 patients were evaluated. All patients had well-differentiated (G1 or G2) tumors (2,3). None of the patients were pretreated with 90Y-coupled somatostatin analogs. Bone metastases were not visible on CT before treatment in 11 of 42 patients (26%). In 2 of these patients, bone metastases occurred on CT after treatment. In 1 patient, this was probably due to PD, because new bone lesions were also seen on posttherapy scintigraphy. In the other patient, PD was unlikely, since SRS after treatment showed a reduced number of bone lesions, and CT showed a reduction of liver metastases, consistent with a partial response (PR). Baseline characteristics of the 42 patients are presented in Table 1. Patients with a primary tumor in the small bowel had visible bone lesions on CT before treatment less often than patients with a bronchial NET.
Baseline Characteristics of Patients With and Without Bone Lesions Visible on CT Before Treatment with 177Lu-Octreotate
Bone and soft-tissue lesions were evaluated in 31 patients: liver lesions in 25 patients, the total liver in 3 patients, mediastinal lymph nodes in 2 patients, and a pancreatic tumor in 1 patient. The results below apply to this group of 31 patients.
Comparison of Bone and Soft-Tissue Lesions
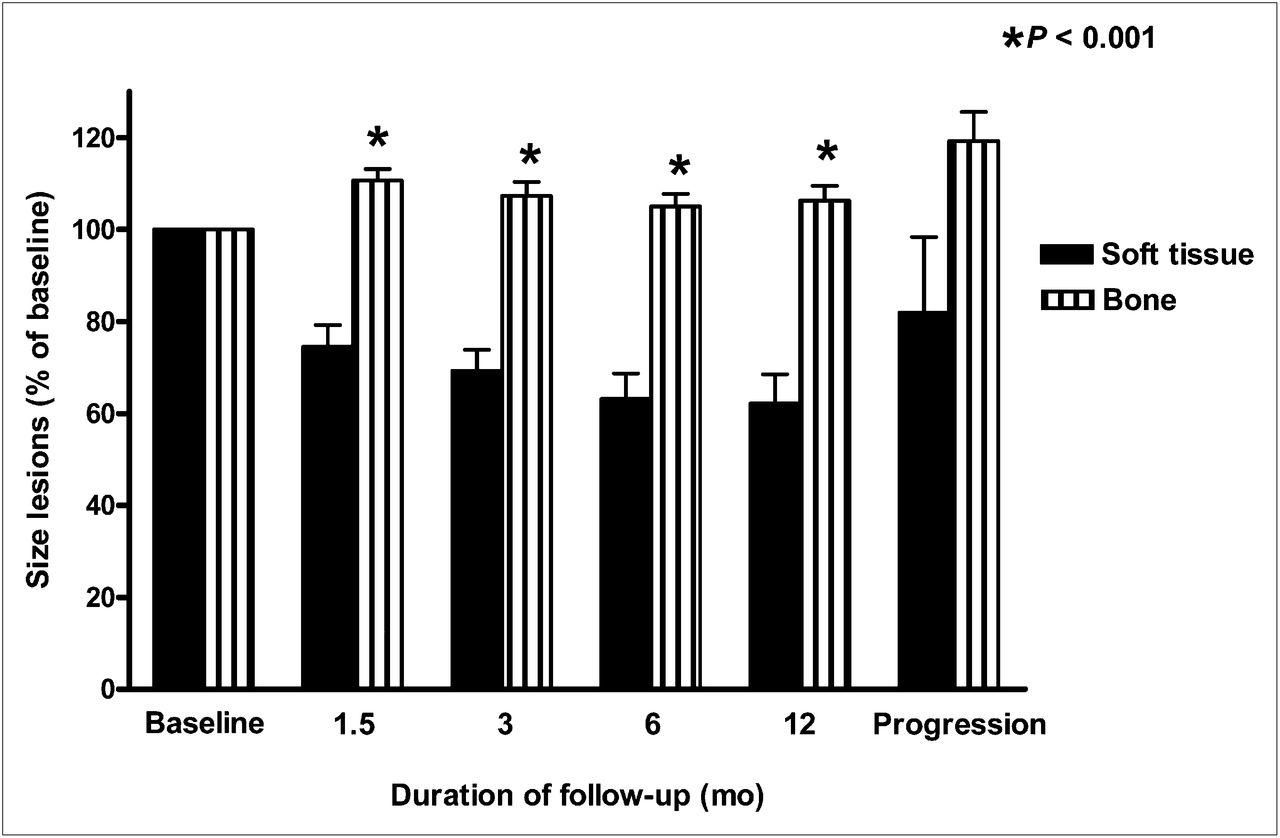
Figure 1 compares the response of bone and soft-tissue lesions on CT after treatment with 177Lu-octreotate according to RECIST. Whereas, on average, bone lesions increased in size, soft-tissue lesions regressed. The percentage change in bone and soft-tissue lesions was significantly different at all time points up to 12 mo of follow-up (P < 0.001). These outcomes were the same when the Southwest Oncology Group criteria were used, when separate analyses were done according to categorized treatment outcome, and when repeated-measurement analysis was performed.

Size of bone lesions and soft-tissue lesions on CT as percentage of baseline at various time points (mean ± SEM). P < 0.001 for difference between mean bone and soft-tissue lesion size (paired t test).
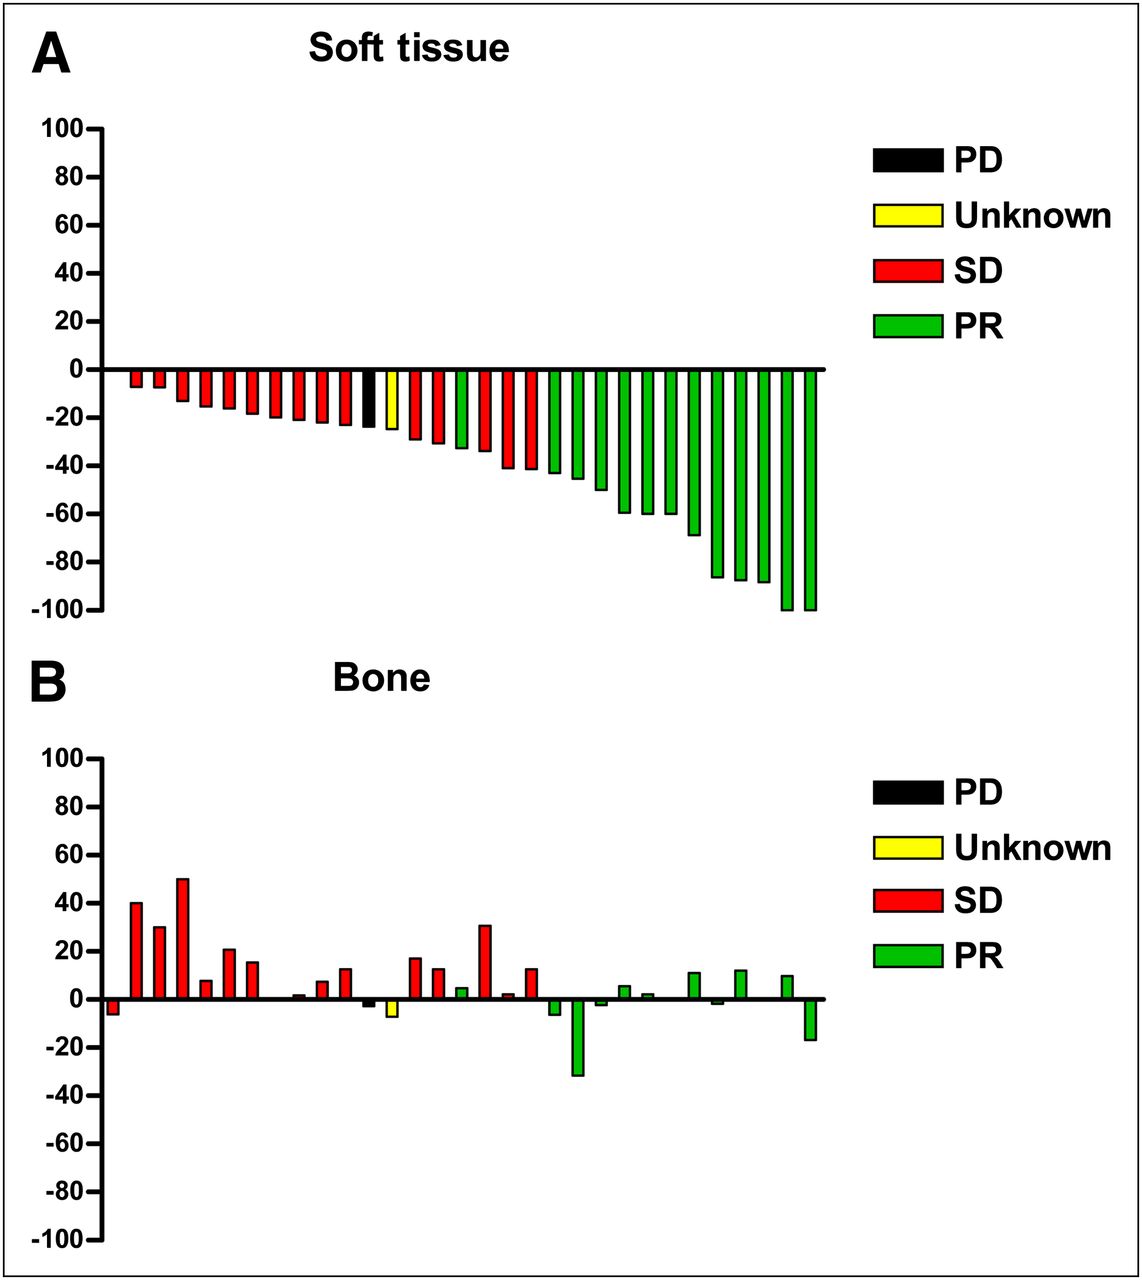
Figure 2 shows the best response (percentage change) on CT of soft-tissue lesions and the corresponding bone lesions at the same time point in the same patients. The best response did not always match the best-response outcome category, since the confirmation criterion was not always met. There was a clear difference in response between bone and soft-tissue lesions. An example of a patient whose bone metastases apparently progressed on CT (i.e., “new” bone lesions appeared) after treatment is shown in Figure 3 (this patient had no measurable bone metastases on CT before treatment and does not belong to the abovementioned group of 31 patients).

(A) Best CT response (percentage change) of soft-tissue lesions. (B) Corresponding bone lesions at same time point in same patients (n = 31). Colored bars indicate best-response outcome categories based on assessment of soft-tissue lesions according to RECIST.

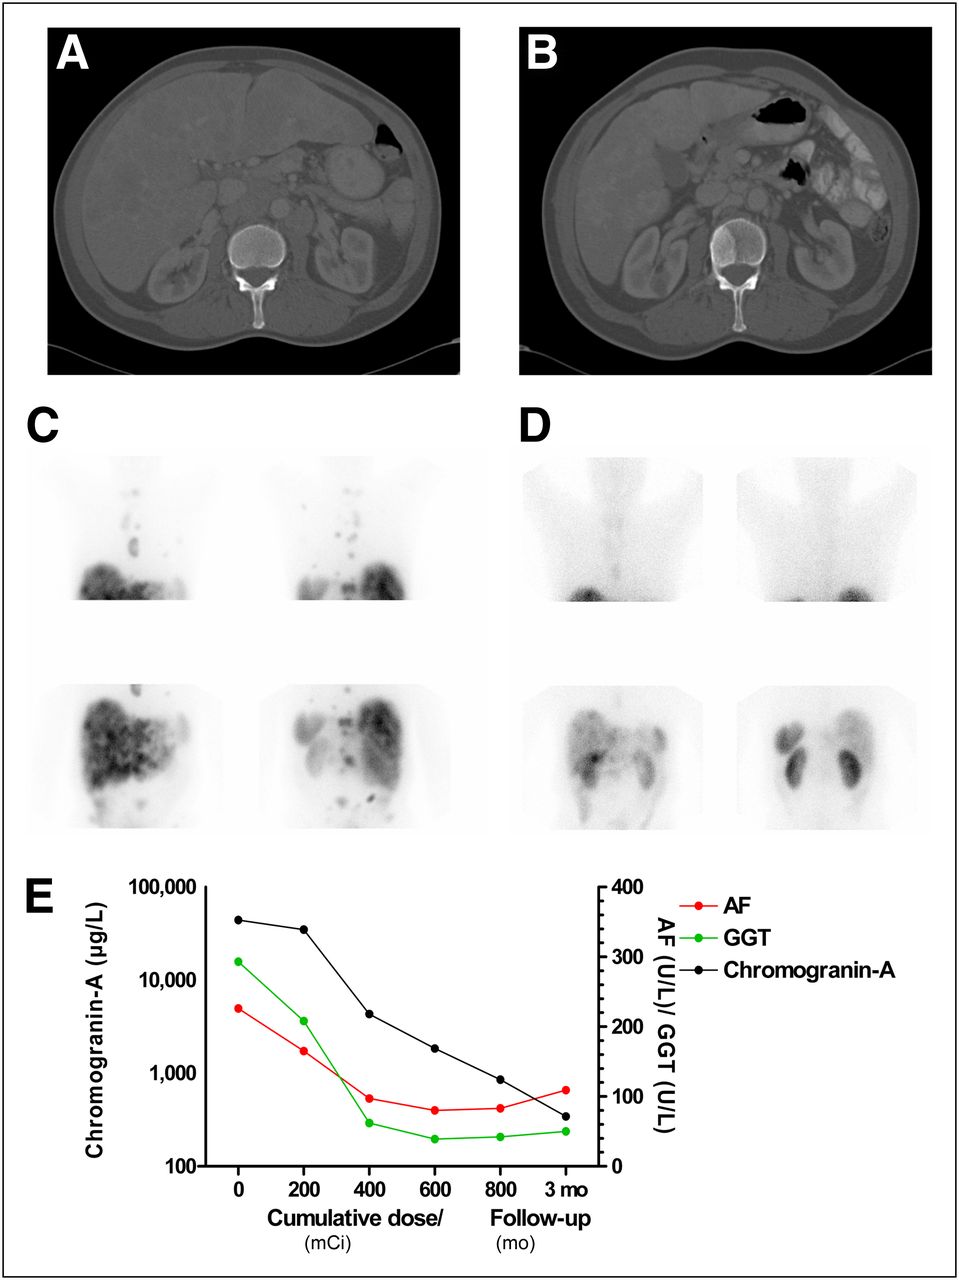
Comparison of CT, [111In-DTPA0]octreotide scintigraphy, and tumor-volume–related determinants in serum of patient with a NET of unknown origin with multiple liver and bone metastases before and after treatment with 30.1 GBq (800 mCi) of 177Lu-octreotate. (A) CT (bone window; transversal slice) before treatment with 177Lu-octreotate, with no evidence of bone metastases. (B) CT (bone window; transversal slice) 6 wk after treatment with 177Lu-octreotate, showing bone metastasis located at L2 and shrinkage (pseudocirrhosis) of liver. (C) [111In-DTPA0]octreotide scintigraphy (anterior and posterior views) before treatment with 177Lu-octreotate showing uptake in multiple liver and bone metastases. (D) [111In-DTPA0]octreotide scintigraphy (anterior and posterior views) 4 mo after last treatment with 177Lu-octreotate, showing reduction of liver and bone metastases and shrinkage of liver. (E) Serum alkaline phosphatase, γ-glutamyl transpeptidase, and chromogranin A levels in same patient during and 3 mo after treatment with 177Lu-octreotate, showing significant decrease, indicating tumor response. AF = alkaline phosphatase; GGT = γ-glutamyl transpeptidase.
SRS and Laboratory Values
The intensity or number of bone lesions on SRS decreased after treatment in 19 of 23 patients (83%) in whom SRS after treatment was available. This decrease was observed in 11 of 13 patients (85%) with a PR and in 8 of 10 patients (80%) with stable disease (SD) as the best response. In the remaining 8 patients, SRS was not available for the following reasons: death in 5 patients, PD in 1 patient, and loss to follow-up in 2 patients.
Table 2 shows various tumor markers and potential tumor-volume–related determinants in serum before treatment and at the time point of best response in patients with elevated values at baseline. Median chromogranin A and mean 5-hydroxyindoleacetic acid (5-HIAA) levels decreased significantly after treatment.
Tumor Markers and Tumor-Volume–Related Determinants in Serum Before Treatment with 177Lu-Octreotate and at Time of Best Response in Patients with Elevated Values at Baseline
Aspect of Lesions
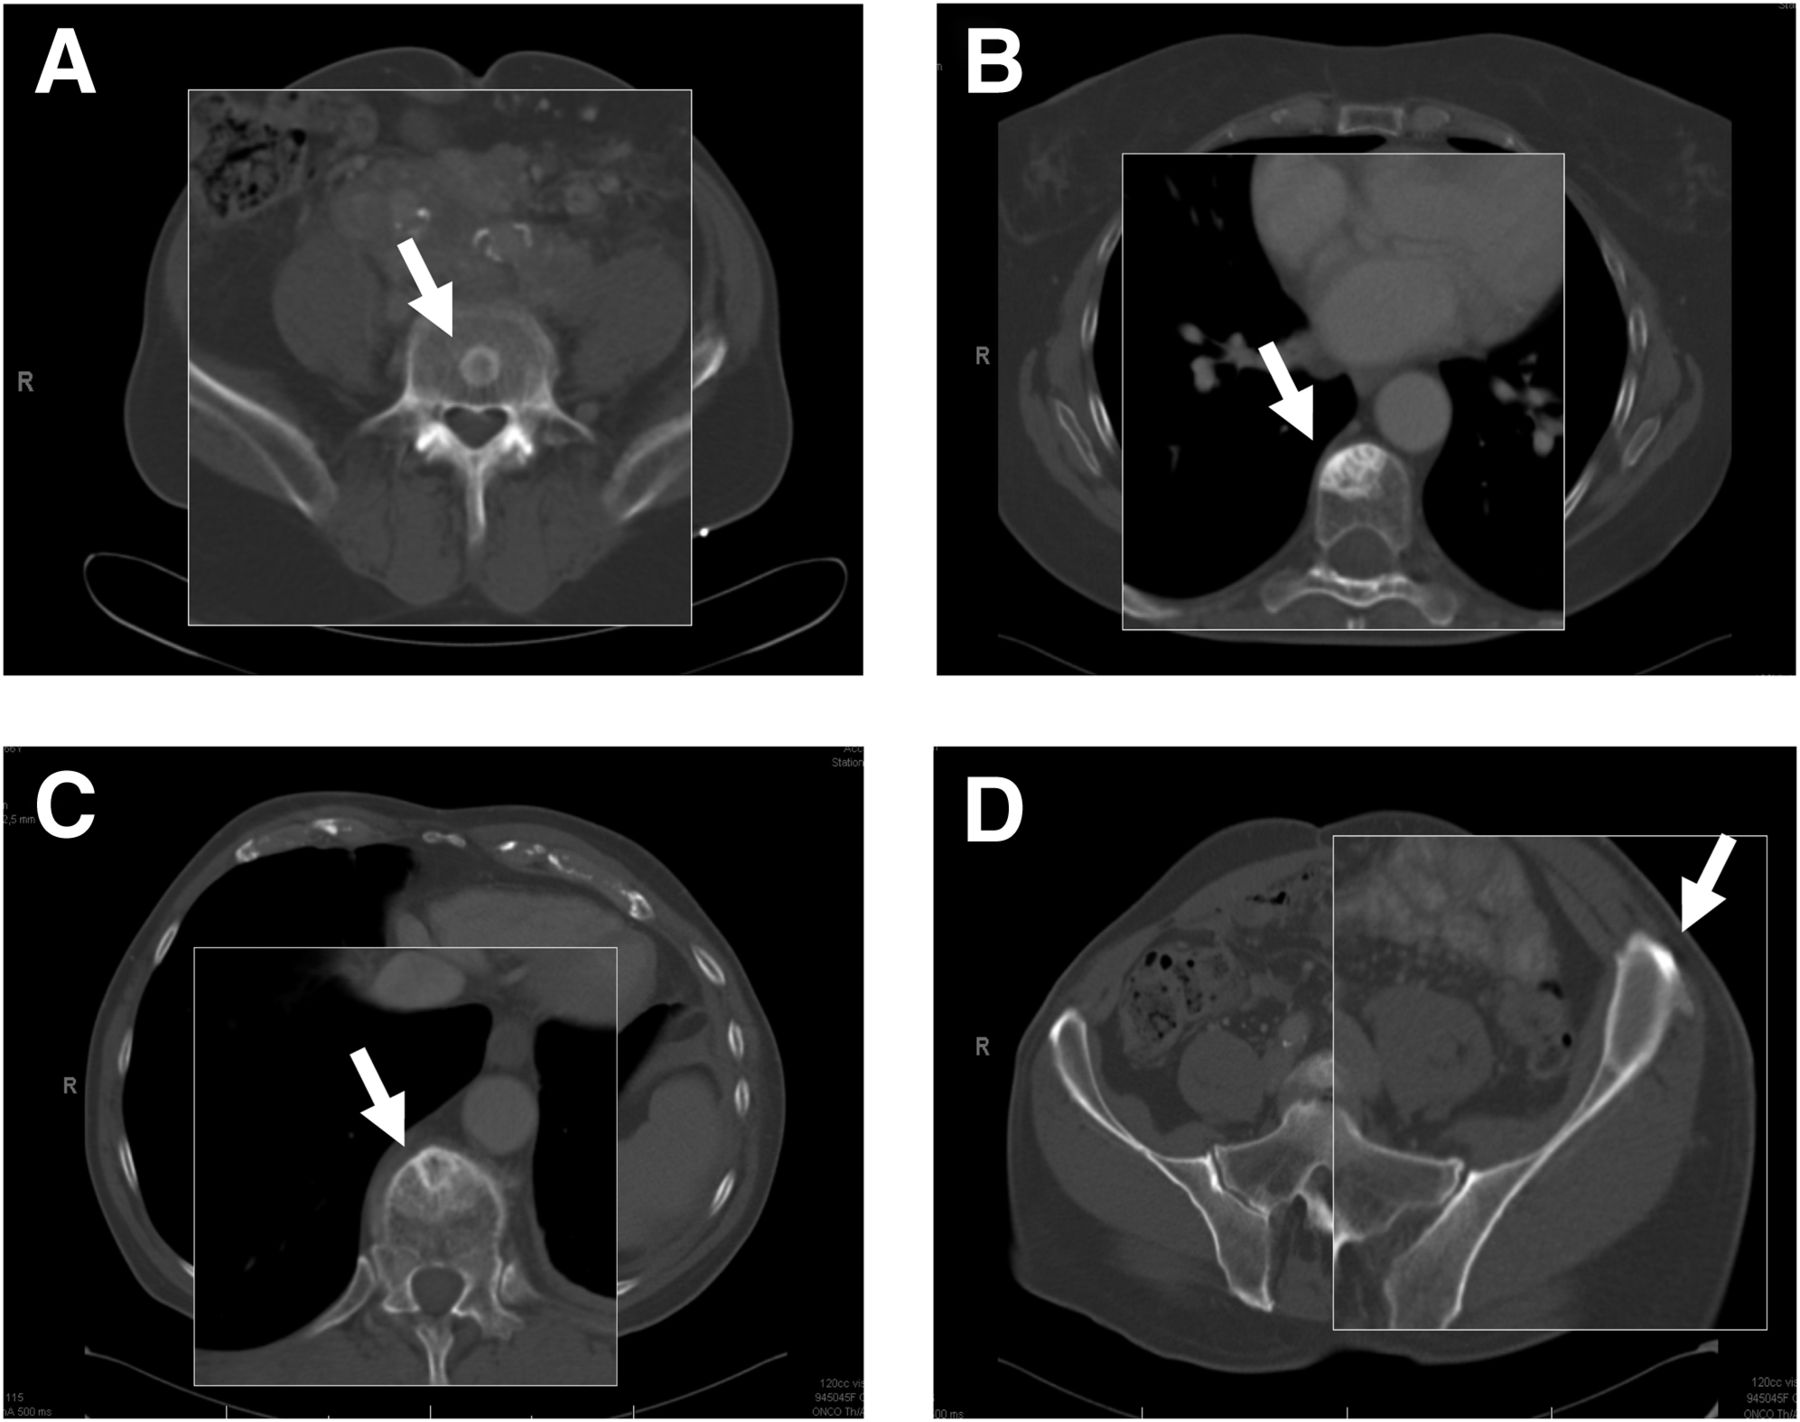
Sixty bone lesions were sclerotic, whereas 4 were lytic with a sclerotic rim. Cortical boundaries were intact in all lesions. Table 3 lists the various aspects of bone lesions at baseline and at the time point of best response. Figure 4 shows examples of bone lesion aspects. The distribution of these categories was not significantly different according to primary tumor or the presence of elevated 5-HIAA. The presence of a boundary or demarcation of bone lesions was more pronounced after treatment. The mean HUs of bone lesions increased significantly after treatment in the group with elevated 5-HIAA levels at baseline (Table 3).
Characteristics of Bone, Liver, and Other Lesions Before Treatment with 177Lu-Octreotate and at Time of Best Response

Roentgenologic CT appearance (transversal slices; zoomed in on bone metastases) of gastroenteropancreatic and bronchial NETs. Arrows indicate relevant bone lesion. (A) Small sclerotic rim. (B) Larger sclerotic area. (C) Vague sclerotic area with sclerotic rim inside. (D) Lytic lesion with sclerotic rim.
Supplemental Figure 1 shows the microscopic appearance of a bone metastasis and the reactive changes in bone in one of the patients.
One hundred three liver lesions were assessed. Table 3 shows the various aspects of liver lesions at baseline and at the time point of best response. Supplemental Figure 2 shows examples of liver lesion aspects. The presence of a boundary or demarcation of liver lesions was less pronounced after treatment. The mean HUs of liver lesions decreased significantly after treatment in patients with a PR as the best response, whereas in patients with an SD no difference was observed. The mean HUs also decreased significantly in the group with a primary tumor located in the small intestine or in the colon or rectum. In these 2 groups, the percentage of patients with a PR was identical to that of the groups with other primary localizations (50% vs. 48%, P = 1.00, for small intestine; 50% vs. 48%, P = 1.00, for colon or rectum).
The various aspects of other lesions did not change significantly (Table 3).
Typical examples of the radiologic response of bone lesions and a liver lesion after treatment with 177Lu-octreotate are shown in supplemental Figure 3. Of interest are the increased sclerosis of the bone lesions after treatment and the presence of a fluid–fluid level in the liver metastasis—a finding that is characteristic of a NET metastasis (22).
DISCUSSION
Peptide receptor radionuclide therapy is a promising treatment modality for NET patients, with high tumor response rates and symptomatic control in most patients (7,23–26). We performed this study to explore our observation that, on CT, bone lesions tended to respond differently from soft-tissue lesions to treatment with 177Lu-octreotate.
In this study we found that, on average, bone lesions increased in size on CT after treatment with 177Lu-octreotate, whereas soft-tissue lesions regressed. In 1 patient, bone lesions became visible on CT after treatment, mimicking PD with “new” bone lesions, although there was an overall treatment response. An additional finding was that bone metastases were not visible on CT before treatment in a considerable number of patients. A difference in visibility of bone lesions on CT for bronchial and small-bowel NETs was seen. Lastly, a change in the HUs of bone or liver lesions in specific patient subgroups was observed after treatment.
The difference in response between bone and soft-tissue lesions on CT as seen in this study poses a clinical dilemma. The apparent progression of bone lesions on CT could be a therapy effect but is, in itself, indistinguishable from PD. Because the intensity or number of bone lesions on SRS declined in 83% of patients, and because the tumor markers chromogranin A and 5-HIAA decreased significantly after treatment, it appears that a real therapy effect is more likely and that the apparent increase in size of bone lesions reflects a healing response to treatment.
The mechanism for this difference in treatment response is not clear. It can be hypothesized that bone lesions had a lower degree of uptake of 177Lu-octreotate than did soft-tissue lesions, resulting in a decreased radiation dose and hence a decreased treatment response. In our study, however, this possibility seems unlikely, because bone metastases were clearly visible on SRS and posttherapy scintigraphy. The intensity or number of bone lesions on SRS also decreased after treatment according to treatment outcome, which supports our hypothesis that there was a true response.
A similar difference in response between bone and other lesions has been described in some case reports (27,28) on patients with bronchial adenocarcinoma treated with epidermal growth factor receptor inhibitors, and in a study (29) describing the response after systemic therapy assessed by 18F-FDG PET in metastatic breast cancer patients. However, these studies could make no distinction between therapy effect and PD.
Moreover, osteoblastic bone flare, defined by an increase in the number or intensity of lesions on bone scintigraphy in the presence of a well-documented response of other tumor sites to treatment, is a well-recognized phenomenon in breast cancer (30). The phenomenon seen on CT as described in our study could be analogous to this bone flare, since in our study we observed an increased density of bone lesions that probably represents a favorable reaction to therapy.
Several guidelines can be used to assess tumor response. The widely used RECIST and Southwest Oncology Group criteria consider bone lesions as nonmeasurable; new bone lesions are considered PD. The recently revised RECIST criteria (version 1.1) (31) consider lytic or mixed lytic–blastic bone lesions as measurable lesions if they have an identifiable soft-tissue component measuring 10 mm or more on CT. However, osteoblastic lesions, which occur mainly in NETs, remain unmeasurable. Lastly, the M.D. Anderson criteria (32) consider the finding of sclerosis of previously undetected lesions on CT as PR and new lesions as PD. However, the distinction between this sclerosis and new lesions is difficult. When bone metastases are visible on SRS before treatment, the appearance of “new” bone lesions on CT corresponding to places positive on SRS is most likely “sclerosis of previously undetected lesions,” as was demonstrated in 1 patient in our study.
In patients with “new” bone lesions on CT after treatment, although there is an overall treatment response we advise that a new SRS be performed to assess the response of bone metastases, provided that the bone metastases were visible on SRS before treatment. The assumption that these patients have PD based on “new” bone lesions on CT could lead to the erroneous alteration of an effective treatment.
Recently, Ezziddin et al. showed that the response of bone metastases after treatment with 177Lu-octreotate could indeed be evaluated efficiently by [111In-DTPA0]octreotide scintigraphy or 68Ga-DOTA-Tyr3-octreotide PET scan (33). However, because tumor response evaluation is being performed mainly by CT, we think it is important that clinicians be aware of the difference in treatment response found in this study.
Although bone metastases were not visible on CT before treatment, they were visible on SRS in 11 of 42 patients (26%). This finding is in line with other studies that found bone lesions of NETs to be visualized more often by 68Ga-DOTA-Tyr3-octreotide PET (13) or 6-18F-fluoro-l-DOPA PET (16) than by CT.
Patients with a primary tumor in the small bowel had visible bone lesions on CT before treatment less often than patients with a bronchial NET. A possible explanation for this difference could be that bronchial NETs produce histamine and 5-hydroxytryptophan, the precursor of 5-hydroxytryptamine (serotonin), unlike small-bowel NETs, which produce serotonin (34,35). It may be hypothesized that CT better visualizes a bone reaction caused by secretion of 5-hydroxytryptophan than that caused by serotonin. The mean HUs of bone lesions increased significantly after treatment in the group of patients with elevated 5-HIAA levels at baseline; this finding indicates increased sclerosis. It is uncertain whether this sclerosis could be attributed to elevated levels of serotonin or 5-hydroxytryptophan, since 5-HIAA is the breakdown product of both.
The mean HUs of liver lesions decreased significantly after treatment in patients with a PR as the treatment outcome. It is difficult to explain this observation. One might hypothesize that although the first step in tumor response to treatment is necrosis, which reduces HUs, the necrosis is followed by fibrosis, which increases HUs. It might be postulated that at the time of best response, lesions consist merely of fibrosis, but our findings did not support this line of thought. The lower HUs at the time of best response might nonetheless be explained by the slow response that NETs usually display, resulting in late tumor-size reductions and perhaps even later signs of fibrosis, not necessarily coinciding with the time of best response.
We recognize that a major inherent limitation of the study is its retrospective design. However, we believe that the study nevertheless gives important and valuable information about the difference in treatment response between bone and soft-tissue lesions in patients with this rare tumor entity.
CONCLUSION
This study demonstrated that bone lesions increased in size on CT after treatment with 177Lu-octreotate even in patients who had a PR as the treatment outcome. Tumor markers and intensity or number of bone lesions on SRS decreased after treatment. Therefore, the apparent increase in the size of bone lesions or the appearance of new bone lesions on CT after treatment with 177Lu-octreotate should be interpreted cautiously, as this finding may be therapy-related rather than indicative of tumor progression.
DISCLOSURE STATEMENT
The costs of publication of this article were defrayed in part by the payment of page charges. Therefore, and solely to indicate this fact, this article is hereby marked “advertisement” in accordance with 18 USC section 1734.
Acknowledgments
We thank all the personnel of the Department of Nuclear Medicine and Internal Medicine of Erasmus University Medical Center for their expert help and cooperation. Special thanks are given to our research nurses, Daniëlle Verwaal, Els Montijn, Agnes Keursten, and Carla van ‘t Noordende. No potential conflict of interest relevant to this article was reported.
Footnotes
Published online Jul. 10, 2012.
- © 2012 by the Society of Nuclear Medicine and Molecular Imaging, Inc.
REFERENCES
- Received for publication January 10, 2012.
- Accepted for publication March 29, 2012.


