


Abstract
Aortic valve calcification (AVC) is recognized as a manifestation of systemic arteriosclerosis. However, it is unclear whether AVC is associated with myocardial ischemia. Stress myocardial perfusion SPECT (MPS) is widely used for the diagnosis of myocardial ischemia. However, routine MPS is not recommended, particularly in asymptomatic patients. Accordingly, we investigated the hypothesis that the presence of AVC is strongly associated with inducible myocardial ischemia, even among asymptomatic patients. Methods: We investigated 669 consecutive patients who underwent both adenosine stress 201Tl MPS and echocardiography. We evaluated the extent and severity of myocardial ischemia by the summed difference score (SDS). We defined the presence of myocardial ischemia as SDS ≥ 3 and moderate to severe ischemia as SDS ≥ 8. We classified the severity of AVC according to the number of affected aortic leaflets. We also compared the mean SDS and the prevalence of SDS ≥ 3 and SDS ≥ 8 among patients stratified by the severity of AVC. Results: The presence of AVC was significantly associated with myocardial ischemia (odds ratio [OR], 1.56; 95% confidence interval [CI], 1.10–2.23; P = 0.013) and moderate to severe ischemia (OR, 2.16; 95% CI, 1.26–3.80; P = 0.0061). In 311 asymptomatic patients, AVC was strongly associated with moderate to severe ischemia (OR, 4.31; 95% CI, 1.67–12.8; P = 0.0043). However, the SDS value and the prevalence of SDS ≥ 3 and SDS ≥ 8 did not increase with increasing number of affected aortic leaflets. Conclusion: The presence of AVC may be associated with the presence of myocardial ischemia, particularly in asymptomatic patients. However, we found no association between the extent of AVC and inducible myocardial ischemia. The presence of AVC may be a useful anatomic marker to help identify patients at high risk of myocardial ischemia, particularly asymptomatic patients.
Aortic valve calcification (AVC) detected by echocardiography is considered to be a manifestation of systemic arteriosclerosis. The presence of AVC is associated with several arteriosclerotic risk factors (1–3) and increased risk of cardiovascular death, myocardial infarction, and coronary artery disease (CAD) (4–13). However, it is unclear whether AVC is associated with myocardial ischemia.
Stress myocardial perfusion SPECT (MPS) is usually used for the diagnosis and quantification of myocardial ischemia. The assessment of the presence and severity of inducible myocardial ischemia provides valuable information for risk stratification and for guiding therapeutic strategies (14,15). However, performing routine MPS is inefficient and it is not recommended for use in screening programs (16). Similarly, routine MPS is not recommended in asymptomatic patients (17). Therefore, a diagnostic strategy should be established to detect patients likely to have myocardial ischemia, particularly among asymptomatic patients, because the prognosis of these patients with myocardial ischemia is worse than in patients without myocardial ischemia (18–20). Accordingly, we investigated the hypothesis that AVC is a marker for inducible myocardial ischemia, even among asymptomatic patients.
MATERIALS AND METHODS
Study Population and Clinical Characteristics
Between April 2008 and March 2011, 1,153 consecutive patients underwent both adenosine stress 201Tl MPS and echocardiography at Hiroshima University Hospital, Japan. We excluded patients with prosthetic aortic valves, bicuspid valves, or aortic valve stenosis (n = 59).We also excluded patients with prior myocardial infarction or coronary revascularization therapy (n = 386) and patients undergoing hemodialysis (n = 39). Finally, 669 patients were included in this study (Fig. 1).
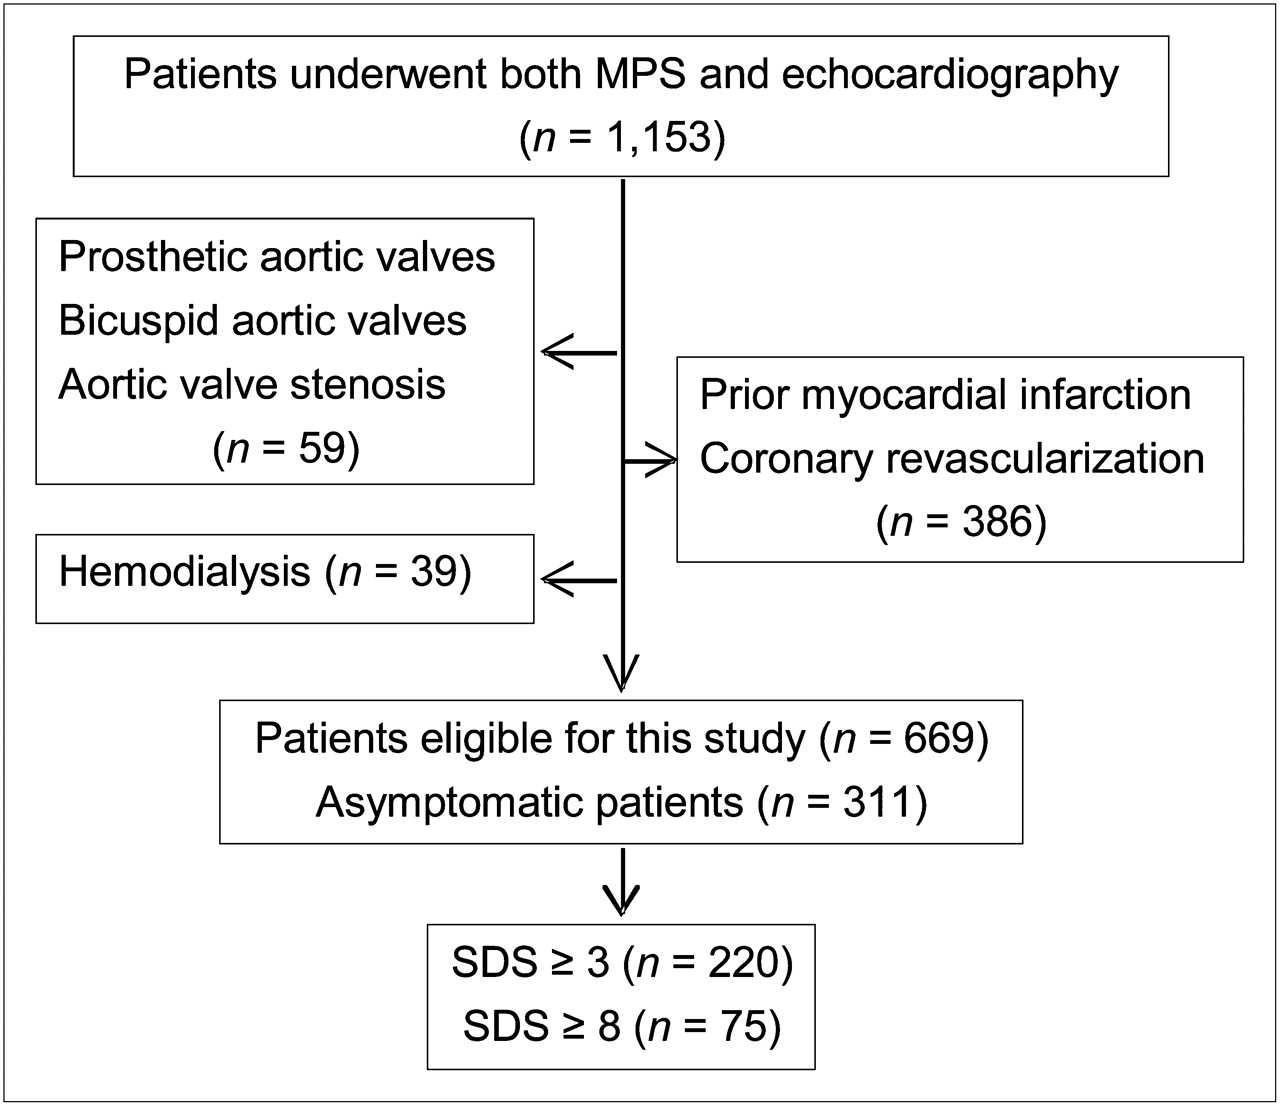
Patient disposition and results of MPS. Numbers of asymptomatic patients are also shown.
At the time of the MPS test, all patients provided information on their demographic characteristics, medical history, medication use, and symptoms (including whether they had no symptoms). In 311 asymptomatic patients, the main reasons for the MPS test, other than having arteriosclerotic risk factors, included having an abnormal resting electrocardiogram (n = 152), having inconclusive results of other modalities to detect CAD (n = 121), and being scheduled for high-risk surgery (n = 38). We assessed the presence or absence of hypertension, diabetes mellitus, dyslipidemia, hyperuricemia, chronic kidney disease, and current smoking, because these are established risk factors for the presence of AVC (1–4,6–10). Hypertension was defined as either systolic or diastolic blood pressure ≥ 140/90 mm Hg or current antihypertensive therapy. We defined diabetes mellitus as HbA1c ≥ 6.5% (21) or current use of hypoglycemic agents. Dyslipidemia was defined as total cholesterol ≥ 220 mg/dL, low-density lipoprotein cholesterol ≥ 140 mg/dL, high-density lipoprotein cholesterol < 40 mg/dL, or current treatment with lipid-lowering medication. Hyperuricemia was defined as serum uric acid ≥ 7.0 mg/dL or current antihyperuricemic therapy. Chronic kidney disease was defined as estimated glomerular filtration rate < 60 mL/min. Patients were considered current smokers if they had smoked at least one cigarette per day within the previous month. We also evaluated the results of coronary angiography performed within 3 mo of the MPS test. Obstructive CAD was defined as >50% stenosis in the epicardial coronary arteries.
Echocardiographic Images
Echocardiography was performed using commercially available systems (iE33Vision [Philips Electronics N.V.], ARTIDA [Toshiba Medical Systems Co.], or Vivid7 Dimension [GE Healthcare U.K. Ltd.]). Echocardiographic data were recorded on a digital recording system (Prime VITA; Nihon-koden) and were interpreted by cardiologists who were unaware of the MPS findings.
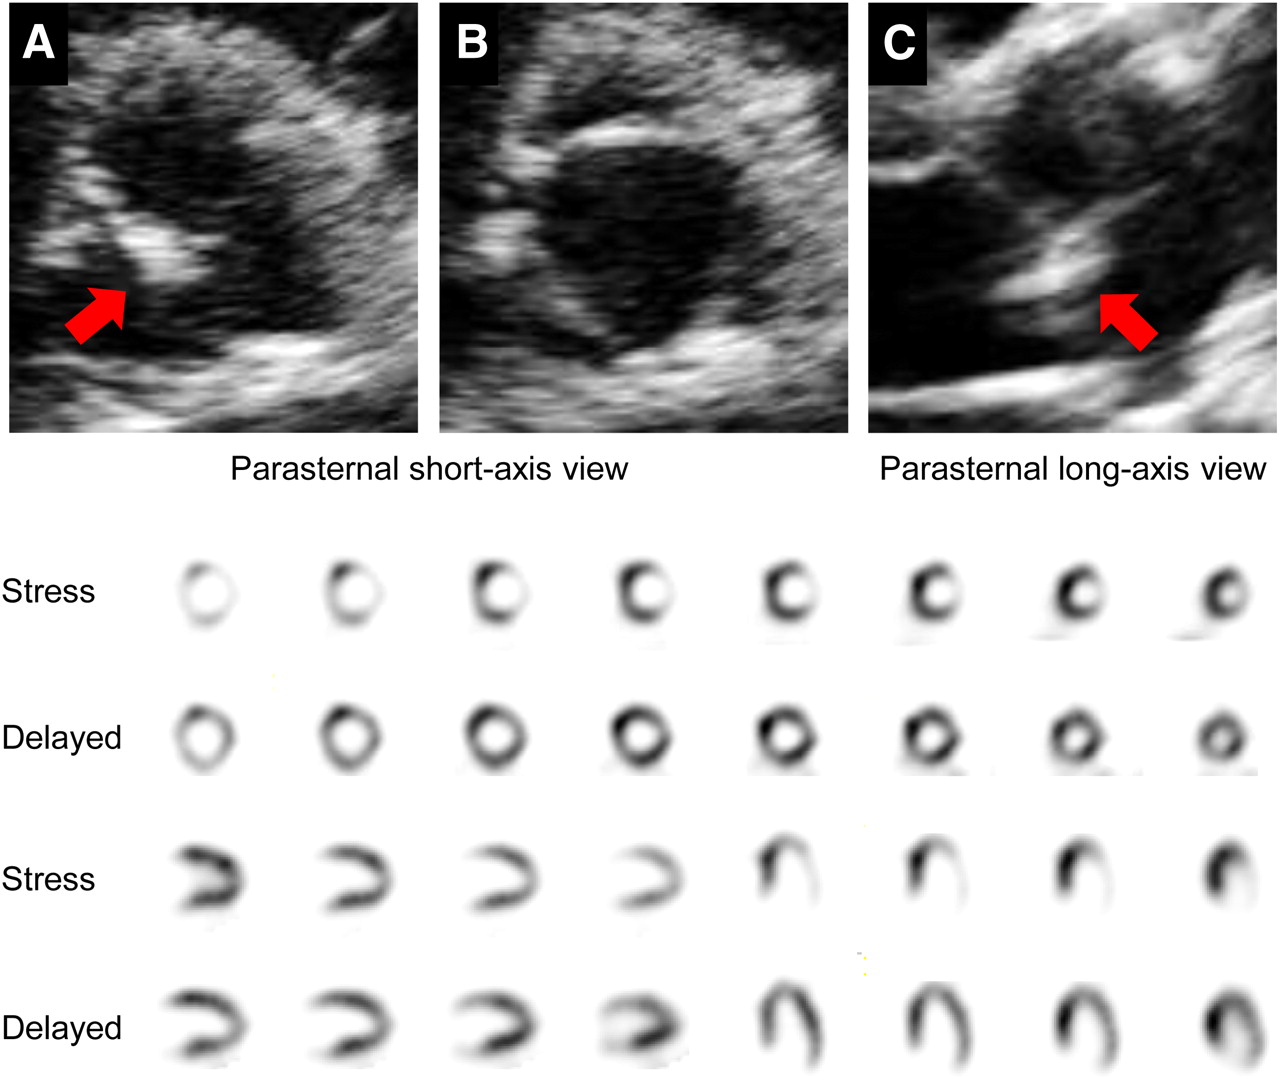
Two-dimensional assessment of AVC was performed from the parasternal long-axis, short-axis, and apical long-axis views, with appropriate gain settings. Peak antegrade flow across the aortic valve was measured from apical views by continuous-wave Doppler. Aortic valve stenosis was defined as thickened leaflets with a reduced systolic opening on a 2-dimensional echocardiogram and increased antegrade velocity (≥2.5 m/s on continuous-wave Doppler). Using previously reported criteria (1,4), we defined AVC as circumscribed changes of the aortic valve detected by echocardiography. Changes included marked increases in local thickness or echogenicity and no restriction of the aortic valve opening in the systolic phase. We also classified the severity of AVC according to the number of aortic valve leaflets with calcified lesions as 1, 2, or 3 affected leaflets. Figure 2 shows echocardiograms and MPS images of a representative case of AVC.

Representative case of aortic valve calcification. (A–C) Echocardiography shows focal area of increased echogenicity and thickness at noncoronary cusp of aortic valve (A and C, arrows). There are no restrictive leaflets, and valve opens well (B). (D) MPS shows extensive and severely reduced tracer uptake at lateral wall in stress images. Complete redistribution is observed in delayed images.
Adenosine Stress Test and SPECT Acquisition
All patients underwent an adenosine stress test in combination with low-level exercise (ergometry, 10 or 20 W), where possible. Adenosine was infused over 6 min (120 μg/kg/min), and 201Tl (111 MBq [3.0 mCi]) was injected 3 min after the start of the adenosine infusion. During the stress test, blood pressure and 3-lead electrocardiographs were continuously monitored, and 12-lead electrocardiographs were recorded every minute during the procedure.
The stress 201Tl SPECT acquisition was started almost 5 min after the end of the stress test. Four hours later, delayed 201Tl SPECT images were also obtained. Electrocardiogram-gated SPECT images were acquired with a dual-detector 90° γ-camera system (E.CAM; Siemens Medical Solutions). Images were acquired with the following parameters: 32 total projections; 180° from right anterior oblique to left posterior oblique and a noncircular orbit; 64 × 64 matrix; 0.6-cm pixel size; 8 frames per cardiac cycle; low-energy, high-resolution collimation; and 40 s per stop. 201Tl SPECT images were acquired with a 10% symmetric window over the 80-keV 201Tl photopeak. The raw projection datasets were filtered with a Butterworth filter (order, 5; cutoff frequency, 0.65 cycles/pixel for rest and stress images). No scatter or attenuation correction was applied.
SPECT Interpretation
Semiquantitative visual interpretation of SPECT images was performed with the short and vertical long axes divided into 17 segments for each study, as recommended in guidelines from the American Society of Nuclear Cardiology (22). Each segment was scored using a 5-point scoring system (0, normal uptake; 1, mildly reduced uptake; 2, moderately reduced uptake; 3, severely reduced uptake; and 4, absence of detectable radiotracer in a segment). Tracer uptake in each segment was evaluated by 2 observers in consensus. The summed stress score (SSS) was obtained by adding the scores for the 17 segments of the stress 201Tl SPECT images for each patient. If reduced tracer uptake was identified on stress images (SSS ≥ 1), reversibility of the defect was estimated as the summed difference score (SDS), which represents the extent and severity of ischemic myocardium. An SDS of 1 or 2 was considered to represent borderline ischemia, SDS ≥ 3 was defined as (any) myocardial ischemia, and SDS ≥ 8 was defined as moderate to severe ischemia for which revascularization was recommended (14,15). Only reversible abnormal defects were considered to represent inducible myocardial ischemia. Reverse redistribution on delayed 201Tl SPECT images was not reflected in the SDS.
Statistical Analysis
Continuous variables are expressed as mean ± SD or median. Categoric variables are described as the number and percentage. After dividing the patients into 2 groups according to the presence or absence of AVC, continuous variables were compared using the Wilcoxon rank-sum test based on the distribution, and χ2 tests were used for binary variables.
Multiple logistic regression analyses were used to calculate adjusted odds ratios (ORs) with 95% confidence intervals (CIs) for the presence of myocardial ischemia (SDS ≥ 3), moderate to severe ischemia (SDS ≥ 8), and obstructive CAD. Analyses were adjusted for age, sex, hypertension, diabetes mellitus, dyslipidemia, hyperuricemia, chronic kidney disease, current smoking, and AVC. We also calculated ORs for a subgroup of asymptomatic patients.
All analyses were conducted using JMP statistical software (version 8.0.1; SAS Institute). P values of 0.05 or less were considered statistically significant.
RESULTS
Table 1 summarizes the clinical characteristics of all patients, their use of medications, and the results of MPS. Comparisons between patients with and without AVC are also shown in Table 1. Patients with AVC were significantly older (74 ± 8 vs. 67 ± 11 y; P < 0.0001) and more frequently had hypertension (76% vs. 69%; P = 0.037), diabetes mellitus (43% vs. 35%; P = 0.021), hyperuricemia (33% vs. 25%; P = 0.036), and chronic kidney disease (54% vs. 45%; P = 0.022) than patients without AVC. Compared with patients without AVC, those with AVC showed a non–statistically significant trend toward higher rates of myocardial ischemia (36% vs. 30%; P = 0.061) and moderate to severe ischemia (14% vs. 9.0%; P = 0.062) (Table 1). Overall, 212 patients (31.7%) underwent coronary angiography. The proportion of patients who underwent coronary angiography was slightly, although not significantly, higher among those with AVC than among those without AVC (32.5% vs. 30.9%; P = 0.063). The prevalence of obstructive CAD that corresponded to the areas of SPECT abnormalities was significantly higher in patients with AVC than in patients without AVC (73.4% vs. 57.4%; P = 0.0010).
Patient Characteristics and Comparison of Patients With and Without AVC
Multiple logistic regression analyses demonstrated that only the presence of AVC was an independent predictor for myocardial ischemia (OR, 1.56; 95% CI, 1.10–2.23; P = 0.013) and moderate to severe ischemia (OR, 2.16; 95% CI, 1.26–3.80; P = 0.0061) (Table 2). We also found that the presence of AVC was independently associated with the presence of obstructive CAD (OR, 2.25; 95% CI, 1.16–4.49; P = 0.017).
Multiple Logistic Regression Analyses for Inducible Myocardial Ischemia in All Patients
Overall, 311 patients (47%) were asymptomatic. Among these asymptomatic patients, AVC was independently associated with myocardial ischemia (OR, 1.98; 95% CI, 1.15–3.45; P = 0.014) and moderate to severe ischemia (OR, 4.31; 95% CI, 1.67–12.8; P = 0.0043) (Table 3).
Adjusted ORs of AVC for SDS ≥ 3 and SDS ≥ 8 in All Patients and Asymptomatic Patients
Among 342 patients with AVC, 148, 113, and 81 patients had 1, 2, and 3 affected leaflets, respectively. We found no significant differences in SDS values among these 3 groups of patients (1, 2, and 3 affected leaflets, 3.03 ± 4.32, 3.23 ± 4.48, and 2.70 ± 4.25, respectively; P = 0.71) or the prevalence of SDS ≥ 3 (37.8%, 38.9%, and 29.6%, respectively; P = 0.36) or SDS ≥ 8 (14.2%, 12.4%, and 13.6%, respectively; P = 0.91) (Table 4).
Comparison of Severity of Myocardial Ischemia According to Number of Calcified Leaflets in Patients with AVC (n = 342)
DISCUSSION
AVC is thought to be clinically associated with coronary atherosclerosis (8,9,12,13). In this study, we found that AVC detected by echocardiography was associated with SPECT abnormalities and that AVC was independently associated with the presence of inducible myocardial ischemia. Interestingly, these associations were stronger in asymptomatic patients than in all patients. Therefore, these data suggest that AVC may offer useful information to identify high-risk patients who should undergo MPS.
We evaluated the association between the presence of AVC and the severity of inducible myocardial ischemia. The presence of myocardial ischemia, even mild ischemia, significantly influences the patient’s prognosis (14). These results further support those of earlier studies showing that patients with AVC had a higher prevalence of new coronary events than those without AVC (4–7). Moreover, in patients with moderate to severe ischemia (i.e., SDS ≥ 8), revascularization therapy is more beneficial than pharmacologic therapy (14,15). Considering these results, the assessment of AVC may help us to identify high-risk patients who would likely benefit more from revascularization therapy than pharmacologic therapy.
AVC is thought to be a marker of arteriosclerotic changes (8,9,12,13). Indeed, in our study, patients with AVC had a higher prevalence of obstructive CAD than did those without. Moreover, it has been demonstrated that AVC is not simply a consequence of aging, and the presence of AVC is associated with several arteriosclerotic risk factors (1–3) and a high prevalence of new coronary events (4–7). In addition to these clinical relationships between AVC and coronary disease, previous studies have revealed that aortic valve lesions and atherosclerotic changes show similar characteristics, including focal chronic inflammation (23,24), lipoprotein deposits (25,26), endothelial dysfunction (27), and the effects of medications (7,28,29). On the basis of these earlier results, there may be many similarities in the characteristics of AVC and arteriosclerotic changes, and AVC is not an arteriosclerotic risk but rather an anatomic marker for advanced arteriosclerotic changes. Because redistribution on SPECT images is based not only on obstructive CAD but also on coronary microvascular disturbance and endothelial dysfunction, these earlier results and our results suggest that the presence of AVC may be related to a manifestation of coronary arteriosclerotic changes in inducible myocardial ischemia.
An association between the presence of AVC and silent myocardial ischemia was also shown in this study. In a previous study, the presence or absence of symptoms did not influence the presence or extent of the ischemic myocardium (18), and patients with silent myocardial ischemia experience more events than do those without (19,20). However, the indications for MPS to detect silent myocardial ischemia are not well established (17), despite the worse prognosis of these patients (18–20). Hence, it is necessary to prospectively identify high-risk asymptomatic patients. Assessing the presence or absence of AVC may be useful to help us identify high-risk asymptomatic patients because of the potential to predict silent myocardial ischemia.
In our study, the severity of AVC defined by the number of affected leaflets was not associated with the severity of inducible myocardial ischemia, although the presence of AVC was associated with the presence and severity of inducible myocardial ischemia. These findings were consistent with our previous study, which showed that valvular calcification was associated with the presence of a coronary plaque but that the quantified severity of valvular calcification was not associated with the extent of coronary plaques assessed by 64-multidetector CT (12). In a prospective population-based study using electron-beam CT, the appearance of AVC was associated with atherosclerotic risk factors, whereas the progression of established AVC was independent of cardiovascular risk factors but was associated with higher baseline calcification (30). Similarly, in a retrospective multicenter study in Japan, the clinical factors associated with calcific aortic valve disease differed between the early and late stages of its progression (31). On the basis of these earlier results and our results, we think that the presence of AVC may be a marker for the presence of inducible myocardial ischemia, but severe AVC does not necessarily correspond to the presence of severe ischemia.
In this study, there were several limitations. The study population was limited by the inclusion of high-risk patients who underwent MPS. Therefore, the present results may not support the evaluation of AVC in the general public or in low-risk patients. Furthermore, the study population was relatively small and represented a cross-section of patients attending a single institute. We examined only Japanese people and could not evaluate possible racial differences. Therefore, a multicenter longitudinal study is necessary to confirm the association between AVC and inducible myocardial ischemia. In this study, we could not investigate the detailed associations among other cardiovascular calcifications (e.g., mitral annular calcification and coronary artery calcification), other arteriosclerotic changes (e.g., increased carotid intima-media thickness and the presence of peripheral artery disease), and inducible myocardial ischemia. Further prospective studies are required to evaluate these possible associations.
CONCLUSION
The presence of AVC may be associated with the presence of myocardial ischemia (SDS ≥ 3) and moderate to severe ischemia (SDS ≥ 8). Similar results were obtained in asymptomatic patients. However, we found no association between the extent of AVC and inducible myocardial ischemia. On the basis of these results, we suggest that the presence of AVC may be a useful anatomic marker that can help to identify patients at relatively high risk of inducible myocardial ischemia.
DISCLOSURE STATEMENT
The costs of publication of this article were defrayed in part by the payment of page charges. Therefore, and solely to indicate this fact, this article is hereby marked “advertisement” in accordance with 18 USC section 1734.
Acknowledgments
No potential conflict of interest relevant to this article was reported.
Footnotes
Published online Jun. 29, 2012.
- © 2012 by the Society of Nuclear Medicine and Molecular Imaging, Inc.
REFERENCES
- Received for publication October 12, 2011.
- Accepted for publication March 5, 2012.


Jump to section
Related Articles
Cited By...
- No citing articles found.