


Abstract
The purpose of this study was to determine how clinical interpretations of the 18F-amyloid tracer florbetapir compares diagnostically with 18F-FDG PET when evaluating patients with Alzheimer disease (AD) and controls. Methods: Nineteen patients with a clinical diagnosis of AD and 21 elderly controls were evaluated with both 18F-florbetapir and 18F-FDG PET scans. Scans were interpreted together by 2 expert readers masked to any case information and were assessed for tracer binding patterns consistent with AD. The criteria for interpreting the 18F-florbetapir scan as positive for AD was the presence of binding in the cortical regions relative to the cerebellum. 18F-FDG PET scans were interpreted as positive if they displayed the classic pattern of hypometabolism in the temporoparietal regions. Scans were interpreted as either positive or negative for AD. In addition, a relative scoring system was used to assess the degree of either hypometabolism or amyloid binding in specified regions. The metabolism and amyloid binding scores for each region were compared across subjects. An overall ratio was calculated on the basis of values in regions expected to be affected by AD and those not expected to be affected. The metabolic ratio and amyloid ratio were then correlated with the mini-mental status examination (MMSE) score. Results: The sensitivity and specificity, compared with the clinical diagnosis of AD or controls, for the 18F-florbetapir scans were 95% and 95%, respectively, and for the 18F-FDG scans 89% and 86%, respectively. When a comparison with MMSE scores was made, 18F-FDG significantly correlated with MMSE when both controls and AD patients were included (r = 0.79, P < 0.0001) and in AD patients alone (r = 0.70, P = 0.001). The 18F-florbetapir scores significantly correlated with MMSE scores only when both controls and AD patients were included (r = 0.62, P < 0.001) but not in the AD group alone (r = 0.12, P = 0.66). Conclusion: Overall, both scans performed well in detecting AD in patients with known clinical AD. Both scans correlated well with cognitive status as determined by MMSE when the entire cohort of controls and AD patients was evaluated. However, only the 18F-FDG scans correlated with cognitive status when AD patients were evaluated separately.
Alzheimer disease (AD) is a brain disorder of older adults, with symptoms of progressive decline in memory and other cognitive functions. A definitive diagnosis of AD can be established only by demonstrating the presence of abundant senile plaques and neurofibrillary tangles in postmortem brain sections (1,2). During life, most patients are diagnosed by clinical criteria that imperfectly track with postmortem pathologic findings. The criteria for the diagnosis of AD were defined by the Working Group of the National Institute of Neurologic and Communicative Disorders and Stroke and the Alzheimer Disease and Related Disorders Association in 1984 (3). By most diagnostic criteria in use today, AD is a diagnosis of exclusion based on evidence of chronic, progressive cognitive and functional decline of insidious onset in middle-aged and elderly patients with no identifiable alternative explanations, such as major stroke, tumor, or systemic disease. Unfortunately, although it is possible to make an accurate diagnosis of dementia in most patients with moderate or severe disease, it can be difficult to differentiate between AD and other dementing disorders in patients with early or mild disease (4,5). Molecular or functional neuroimaging studies with PET should help establish an earlier and more accurate diagnosis of AD and help monitor disease progression. These goals are particularly relevant to current and future clinical trials of disease-modifying treatments for AD, in which recruitment of participants who are at high risk of developing or who already have prodromal AD increases trial efficiency, offers the opportunity to follow disease progression and response to therapy, and determines specific patterns of pathology in AD.
Since the 1980s, 18F-FDG PET has been considered one of the most accurate nuclear medicine imaging tests for detecting AD. Initial 18F-FDG PET studies, comparing cerebral metabolic rate for glucose consumption (CMRGlc) in patients with AD with age-matched, healthy controls, showed that there is a 20%–30% decrease in whole-brain CMRGlc values in patients with AD when compared with healthy age-matched controls (6). Other studies showed that patients with AD have decreased CMRGlc, whereas the bilateral parietal and temporal lobes are particularly affected (7–9). In general, this classic pattern of temporoparietal lobe hypometabolism has demonstrated a sensitivity and specificity of approximately 80%–90%\ (10–13).
Because the definitive diagnosis of AD requires the presence of abundant amyloid-β deposits throughout the cerebral cortex of AD patients, in vivo imaging agents that are specific and sensitive for detecting amyloid plaques would be extremely useful for the molecular diagnosis of AD (14,15). The early development of such imaging agents includes several 11C- and 18F-labeled tracers such as 6-OH-BTA-1 ([N-methyl-]2-(4′-methylaminophenyl)-6-hydroxybenzothiazole (16), SB-13 (4-N-methylamino-4′-hydroxystilbene) (17,18), and FDDNP (2-(1-{6-[(2-18F-fluoroethyl)(methyl)amino]2-naphthyl}ethylidene)malononitrile) (19), and there have been several studies evaluating their ability to accurately diagnose AD.
18F-florbetapir has been studied in several completed phase I and phase II clinical trials and ongoing phase III clinical trials (20,21). It has been shown to accurately detect amyloid in the brain and help differentiate patients with AD from controls (22,23).
Because 18F-FDG is still the most widely used PET agent for the evaluation of dementia patients, comparison with 18F-FDG is appropriate for newer radiopharmaceuticals that bind to pathophysiologic molecules in the brain such as amyloid plaques. Such a precedent has already been set with the evaluation of 11C-Pittsburgh compound B (11C-PIB), in which the first human studies compared uptake of 11C-PIB with cerebral metabolism. The findings showed a relatively strong inverse correlation between the 11C-PIB uptake and hypometabolism in various cortical areas, particularly the parietal lobes. In fact, a recent study comparing 18F-FDG and 11C-PIB PET scans for 7 AD patients and 14 controls demonstrated a good concordance of hypometabolism and amyloid binding, particularly in the frontal, parietal, and temporal cortices (24). Thus, an adequate evaluation of amyloid tracers should include a comparison with clinical 18F-FDG PET to assess the extent of correlation between the 2 scans and their ability to differentiate AD patients from cognitively normal controls.
There have been no direct comparisons between 18F-florbetapir and 18F-FDG PET in the same subjects. The purpose of this study was to compare 18F-florbetapir and 18F-FDG PET results in the same AD and control subjects to determine diagnostic accuracy and also to compare metabolism with amyloid burden. The current paper presents the initial results based on qualitative evaluations by expert readers. Although future studies will likely compare computer-based semiquantitative measures of metabolism or plaque burden, most nuclear medicine scans are qualitatively interpreted by radiologists or nuclear medicine physicians, and therefore, it is important to determine the utility of these scans in such a clinical setting as well.
MATERIALS AND METHODS
Subject Selection
Nineteen patients with a clinical diagnosis of AD (8 men and 11 women; mean age ± SD, 73 ± 9 y) and 21 elderly cognitively normal controls (13 men and 8 women; mean age ± SD, 67 ± 13 y) were evaluated with both 18F-florbetapir and 18F-FDG PET scans. The patients were given the diagnosis of probable AD on the basis of the criteria of the National Institute of Neurologic and Communicative Disorders and Stroke and the Alzheimer Disease and Related Disorders Association Work Group and had no other underlying disease process that could have caused or maintained the dementia. All subjects were given a mini-mental status examination (MMSE), with possible scores of 0 (severely demented) to 30 (normal). The mean MMSE was 20 ± 7 for the AD patients and 29 ± 1 for the controls.
18F-FDG PET
18F-FDG PET was done according to the Alzheimer’s Disease Neuroimaging Initiative protocol (25). Briefly, an intravenous catheter was inserted. The patient’s eyes were open, ears were unoccluded, and ambient noise was kept to a minimum during the study. The patients were then injected with 185 MBq (5 mCi) of 18F-FDG. Scanning was initiated 30 min after the administration of 18F-FDG. Images were obtained over 30 min, followed by a transmission scan for attenuation correction. The head was fixed in place throughout the study by a head holder, and the correct position was monitored by an investigator or technologist. At the completion of the scanning, the images were reconstructed in the transaxial planes using an iterative reconstruction process (26).
18F-Florbetapir PET
18F-florbetapir PET was performed according to the prior protocols (20). Briefly, an intravenous catheter was inserted. The patients were then injected with 370 MBq (10 mCi) of 18F-florbetapir. Scanning was initiated 50 min after the administration of 18F-FDG. Images were obtained over 10 min, followed by a transmission scan for attenuation correction. The head was fixed in place throughout the study by a head holder, and the correct position was monitored by an investigator or technologist. At the completion of the scanning, the images were reconstructed in the transaxial planes using an iterative reconstruction process.
Image Interpretation
All PET scans were interpreted by 2 board-certified nuclear medicine physicians with extensive experience interpreting brain PET scans. The reviewers interpreted all the scans together by consensus in a randomized order for both the 18F-FDG and the 18F-florbetapir scans. This study was not designed to assess how different readers perform when evaluating these 2 different PET scans, but rather for them to make an optimal visual evaluation of the 2 scans and compare the ability of the scans to diagnose Alzheimer disease. The reviewers were masked to any clinical information. Future studies with a larger sample size will be needed to better evaluate interreader reliability and consistency.
Two assessments were made for the interpretation of each PET scan. The first assessment yielded a categoric determination of AD or not AD based on the pattern of activity observed on the 2 scans. For the 18F-FDG PET scans, a pattern of temporoparietal hypometabolism was used to distinguish AD from controls. For the 18F-florbetapir scan, the presence of uptake in the cortical regions, compared with the cerebellum, was used to distinguish AD from controls.
The second assessment was to qualitatively rate the activity in 3 major cortical brain regions, the frontal, temporal, and parietal lobes, for both the 18F-FDG and the 18F-florbetapir scans. The metabolic activity of each anatomic structure on the PET scan was given a score of 4 for normal activity, 3 for mildly decreased activity, 2 for moderately decreased activity, 1 for severely decreased activity, and 0 for no activity. 18F-florbetapir PET images were assessed visually using a similar semiquantitative score ranging from 0 (no amyloid) to 4 (high levels of cortical amyloid). This approach was similar to that in a recent comparison study of 18F-florbetapir to neuropathologic diagnosis (20). The sum of the values obtained for each of the cortical areas was compared between scans and also with the severity of cognitive impairment as determined by the MMSE.
Data Analysis
The diagnoses based on the 18F-FDG and 18F-florbetapir PET scans were compared with the clinical diagnoses. Sensitivity and specificity were determined. Linear regression models were used to compare the sum of the uptake scores in the frontal, temporal, and parietal regions with the MMSE for the entire cohort of AD and control subjects and just for AD subjects. Similarly, linear regression models were used to compare the sum of the amyloid uptake in the same regions with the MMSE for the entire cohort of AD and control subjects as well as just for AD subjects. Finally, the uptake for the 18F-FDG and 18F-florbetapir scans was compared with each other for specific regions of the frontal, temporal, and parietal lobes as well as the overall sum, using regression models.
RESULTS
The sensitivity and specificity, compared with the clinical diagnosis of AD or controls, were 95% and 95%, respectively, for the 18F-florbetapir scans and 89% and 86%, respectively. for the 18F-FDG scans. 18F-florbetapir PET disagreed with the clinical diagnosis in only 2 subjects. In a single control subject, 18F-florbetapir PET was rated as positive—interestingly, this subject also had an 18F-FDG scan rated as positive for AD (Fig. 1). In addition, in a single probable-AD subject, 18F-florbetapir PET was negative (Fig. 2). This patient was found on follow-up clinical evaluation to have symptoms that might suggest a frontotemporal dementia. In this patient, the 18F-FDG PET scan (interpreted as positive for AD) did reveal a temporoparietal pattern, although the frontal lobes also had decreased metabolism.
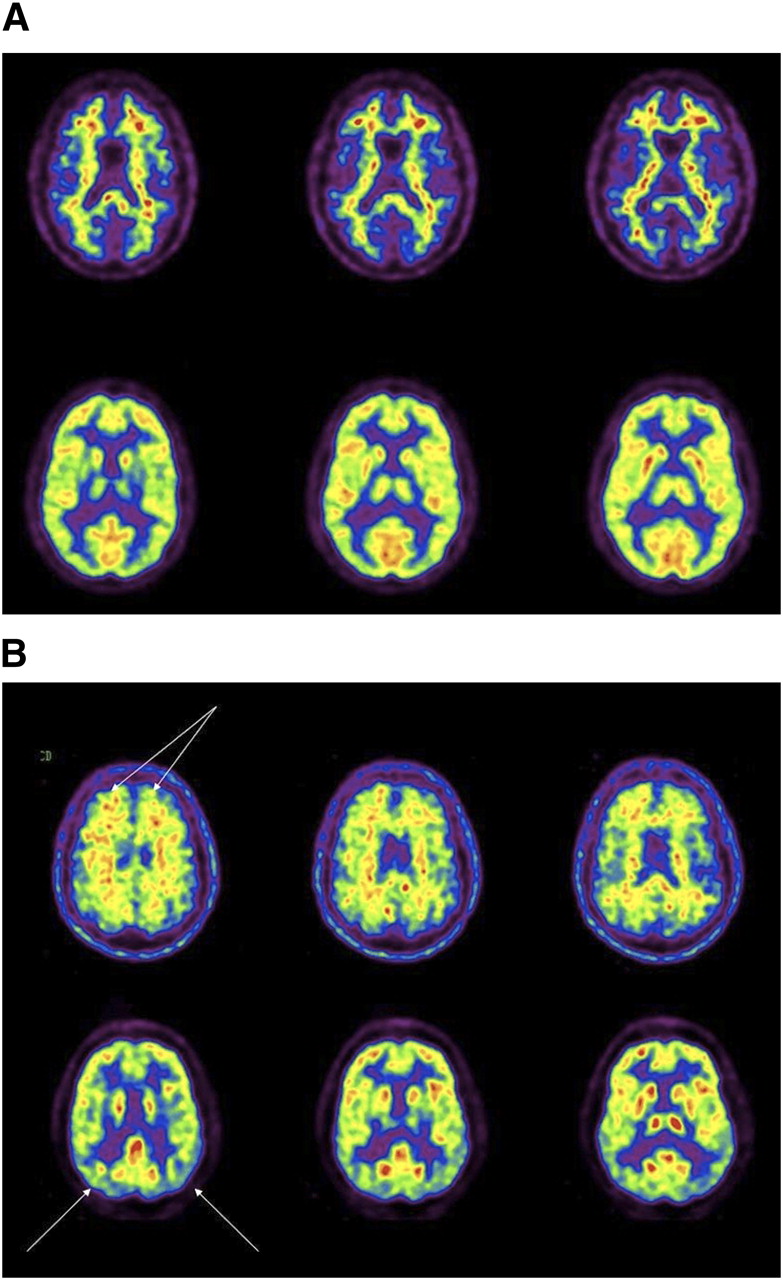
18F-florbetapir (top) and 18F-FDG (bottom) images of control subject with negative findings on both scans (A) and control subject with positive findings on both scans (B) (arrows on 18F-florbetapir scan points to uptake in frontal cortex and arrows on the 18F-FDG scan show mildly decreased metabolism in temporoparietal regions).
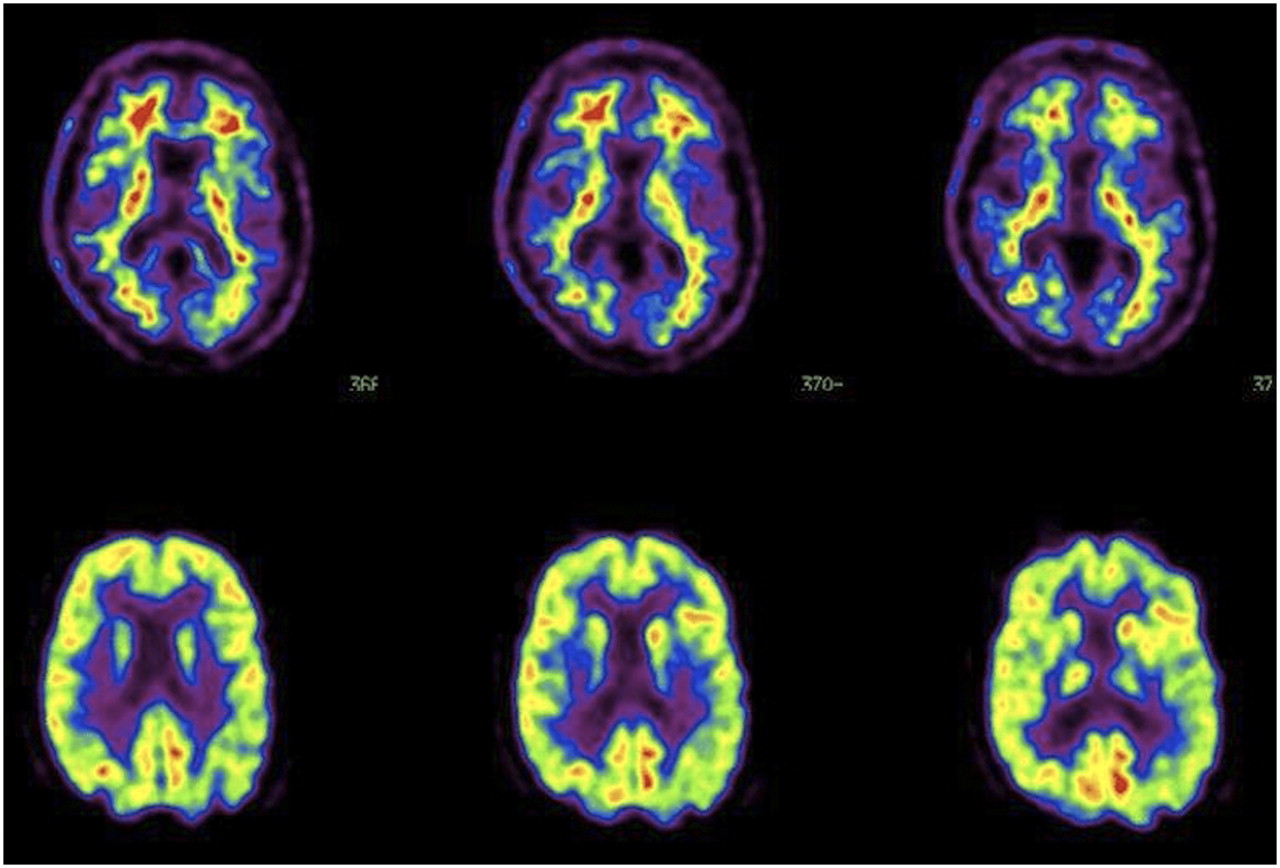
18F-florbetapir (top) and 18F-FDG (bottom) images of patient initially diagnosed with probable AD, which was negative on 18F-florbetapir scan and mildly positive on 18F-FDG scan (mildly decreased metabolism in temporoparietal area is shown with arrows). However, this patient, on longer follow-up, was suspected of having frontotemporal dementia instead.
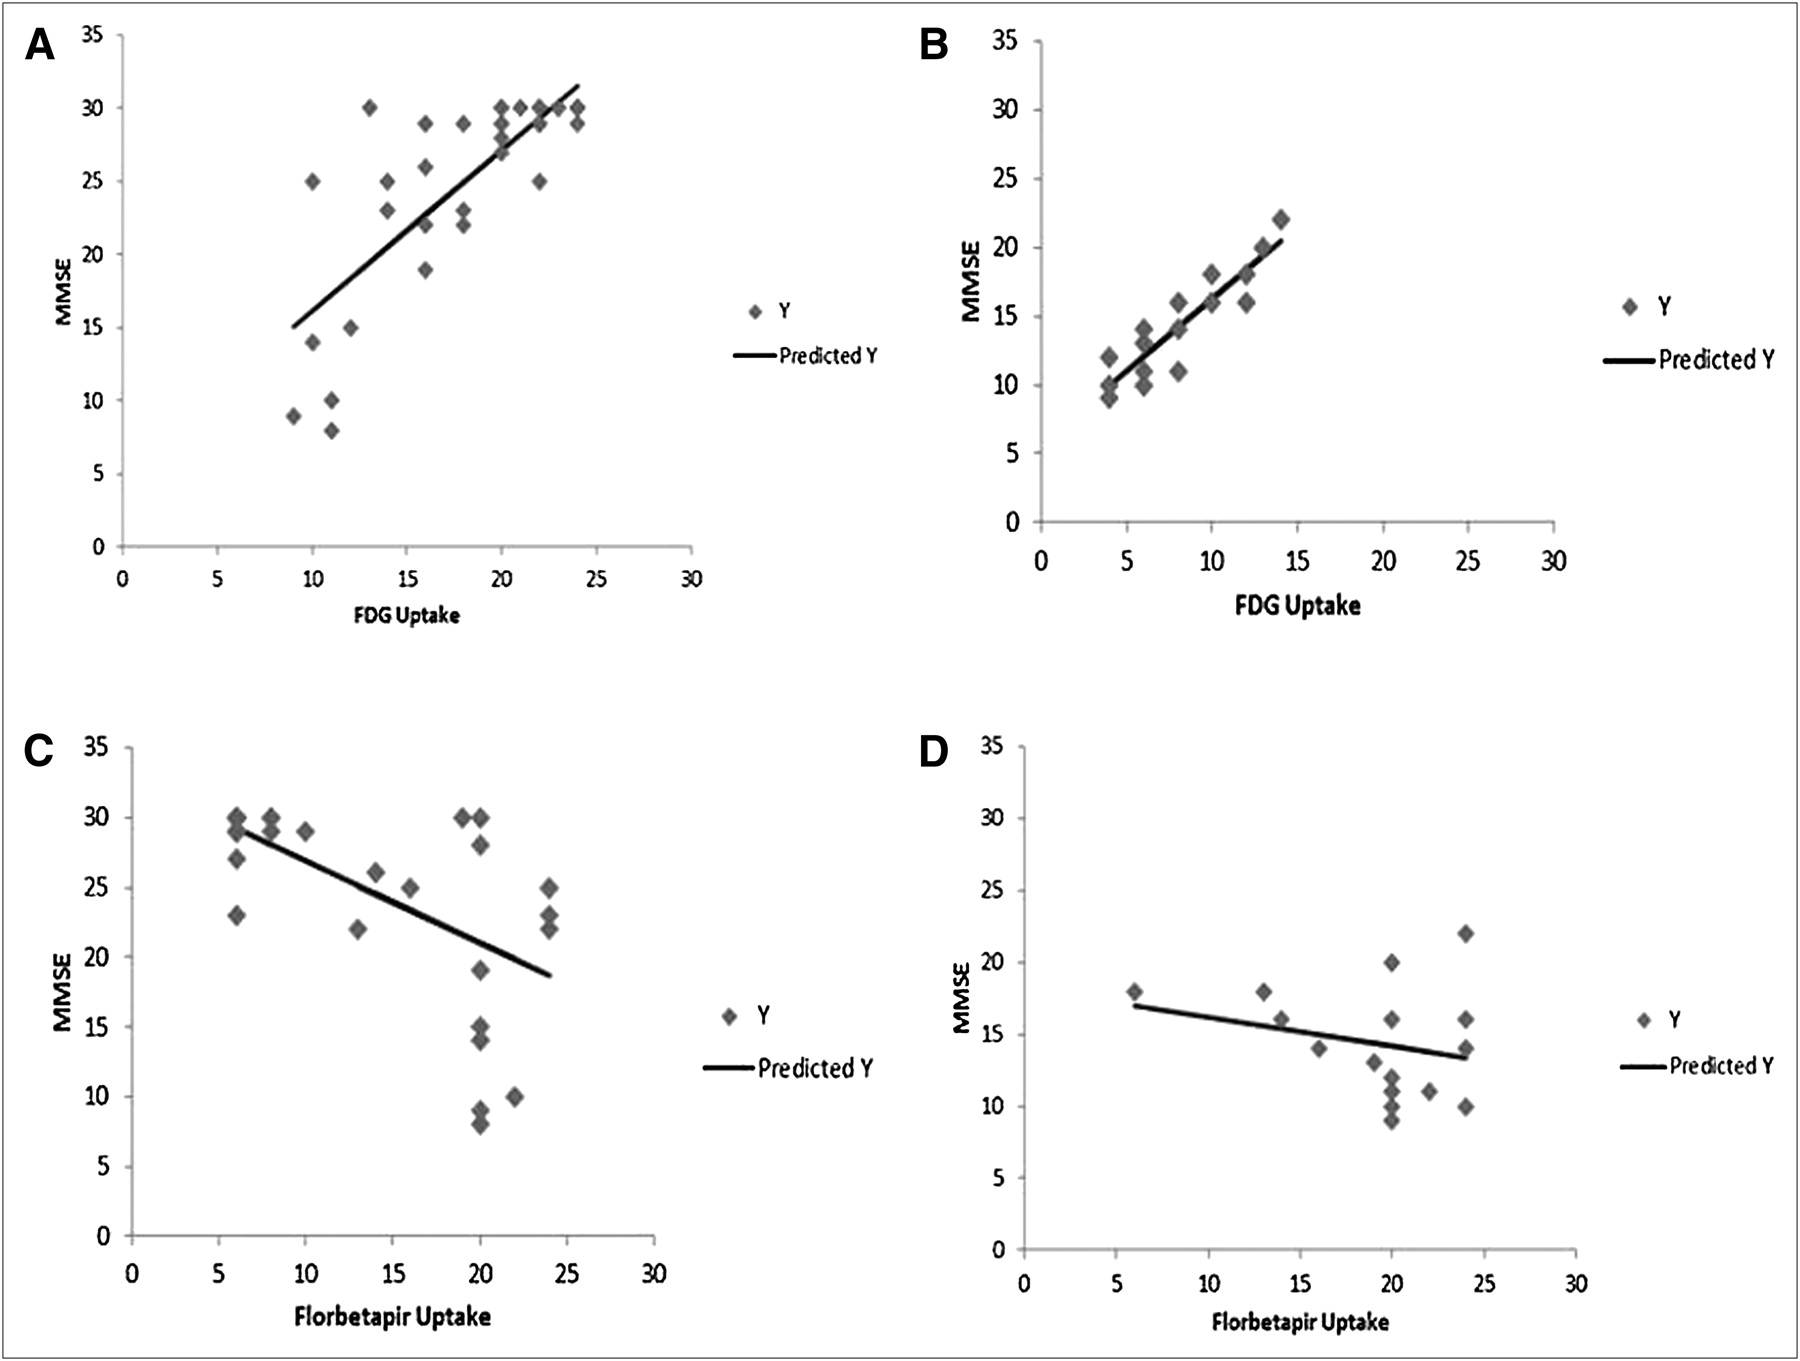
When a comparison with MMSE scores was made (Fig. 3), 18F-FDG significantly correlated with MMSE when both controls and AD patients were compared (r = 0.79, P < 0.0001) and when AD patients were compared separately (r = 0.90, P = 0.0001). The 18F-florbetapir results significantly correlated with MMSE scores when both controls and AD patients were compared (r = 0.64, P < 0.0001) but not when only AD patients were compared separately (r = 0.26, P = 0.34).

Correlation analysis for MMSE vs. 18F-FDG and 18F-florbetapir uptake scores. Graphs show correlation between MMSE and 18F-FDG uptake scores summed for temporal, parietal, and frontal cortical regions for entire set of AD and control subjects (A); correlation between MMSE and 18F-FDG uptake scores summed for temporal, parietal, and frontal cortical regions for AD subjects only (B); correlation between MMSE and 18F-florbetapir uptake scores summed for temporal, parietal, and frontal cortical regions for entire set of AD and control subjects (C); and correlation between MMSE and 18F-florbetapir uptake scores summed for temporal, parietal, and frontal cortical regions for AD subjects only.
When the 18F-FDG and 18F-florbetapir scans were compared for the entire group of patients, the following correlations were obtained. There were significant inverse correlations between 18F-FDG uptake and 18F-florbetapir uptake in the frontal, parietal, and temporal lobes, consistent with the notion that areas of amyloid deposition have decreased metabolism (Table 1). However, when 18F-FDG and 18F-florbetapir scans were compared only in the AD patients, there was a trend toward an inverse correlation in the frontal lobes (right frontal lobe, R = 0.44, P = 0.06, and left frontal lobe, R = 0.47, P = 0.04), but no significant correlations were observed in the other brain regions. This is consistent with the above findings in which 18F-FDG uptake correlated better with severity of disease in AD patients. Thus, amyloid deposition correlates with decreased metabolism, but the amount of amyloid binding by 18F-florbetapir does not correlate with the amount of metabolic deficit in the AD patients, particularly as it relates to cognitive impairment.
Correlation Between 18F-FDG Uptake and 18F-Florbetapir Binding in Major Cortical Regions
DISCUSSION
Encouraging results reported with amyloid tracers in AD patients suggest that development of imaging agents for mapping amyloid plaques in the living human brain may be extremely useful for detecting disease. Further, it is hoped that amyloid imaging may be useful for detecting changes in amyloid plaque burden, especially as it pertains to treatment approaches that attempt to target amyloid plaque burden. However, this is the first study, to our knowledge, to directly compare 18F-florbetapir with18F-FDG PET.
For almost 2 decades, 18F-FDG PET has been available and clinically used for helping with the diagnosis of AD. In fact, since 1980, many studies have used 18F-FDG PET in the assessment of patients with AD (27–29). These studies showed that the bilateral parietal and temporal lobes and the posterior cingulate gyrus are particularly hypometabolic in patients with AD (7,8). This temporoparietal hypometabolism is often referred to as representing the typical pattern of AD and may be particularly pronounced in patients with an age less than 65 y (30). Physiologically, this temporoparietal hypometabolism represents neuronal dysfunction resulting from the disease process in AD. Several recent studies, including a metaanalysis of 15 studies using 18F-FDG PET in the diagnosis of AD, showed a sensitivity and specificity of approximately 86% for this temporoparietal hypometabolism pattern (12,13). The results from this current study are consistent with these previous 18F-FDG PET findings. Such findings have led to 18F-FDG PET being used and reimbursed by payers (including the Centers for Medicare and Medicaid Services) for the clinical diagnosis of AD and its differentiation from frontal lobe dementia. However, the temporoparietal hypometabolism pattern is not pathognomonic for AD and may be seen in patients with Parkinson disease, bilateral parietal subdural hematomas, bilateral parietal stroke, and bilateral parietal radiation ports (31). Other areas (e.g., the sensorimotor and visual cortices, subcortical nuclei, brain stem, and cerebellum) have more preserved CMRGlc but can also be abnormal in patients with specific neuropsychologic deficits (32–34). Thus, 18F-FDG PET has its limitations from a diagnostic perspective.
Considering several other issues with 18F-FDG PET, including medication effects and sensory stimulation that can interfere with metabolism, it seems appropriate to try to find other radiopharmaceuticals that are more specific for detecting the pathophysiologic hallmarks of AD such as amyloid burden. This need led to the development of compounds such as 18F-florbetapir, but it is also clear that the ability of 18F-florbetapir to diagnose AD must be compared with the same ability of 18F-FDG PET. In this initial study, it appears that 18F-florbetapir has a higher sensitivity and specificity for AD. This result is expected given the more disease-specific association of the 18F-florbetapir.
This is the first study, to our knowledge, to compare these 2 imaging tracers head to head in the same subjects. This initial study sought to assess the ability of visual clinical interpretations by expert reviewers to assess the scans for the diagnosis of AD and also to help assess severity of disease. Although future studies will likely compare computer-based semiquantitative measures of metabolism or plaque burden, most nuclear medicine scans are qualitatively interpreted by radiologists or nuclear medicine physicians. Therefore, it is important to determine the utility of these scans in such a clinical setting, focusing on the qualitative interpretation. One of the current issues that has arisen with the interpretation of 18F-florbetapir scans is the determination of interreader reliability. This particular issue was not evaluated in the current study and will need to be assessed in a larger sample of patients.
The results of the current study are similar to those of previous single-radiopharmaceutical studies in terms of the ability of 18F-FDG or 18F-florbetapir to diagnose AD. However, this is the first time the 2 tracers have been compared head to head in the same subjects. Although the cohort is relatively small, the sensitivity and specificity obtained in this study for 18F-FDG were 89% and 86%, respectively, similar to previous reports. The sensitivity and specificity of 18F-florbetapir scan results were 95% and 95%, respectively. This is the first report in the literature of these values when compared with the clinical diagnosis, although a previous comparison of 18F-florbetapir uptake demonstrated a 96% concordance with amyloid plaque observed on postmortem neuropathologic evaluation (20).
Another important aspect of different tracers is not only to determine their diagnostic accuracy but also to assess their ability to correlate with disease severity. Several earlier studies have shown that the magnitude and extent of hypometabolism observed on 18F-FDG PET scans generally correlate with the severity of the dementia symptoms (35). The more severe the metabolic abnormalities, the worse the patient generally functions both on cognitive tests and on measures of activities of daily living. Longitudinal studies have shown that CMRGlc values decrease more rapidly over time in patients with AD than in age-matched control subjects, and therefore, 18F-FDG PET may be a useful marker for disease progression over time (36). One study observed this association in 120 AD patients undergoing 18F-FDG PET (37), in which there was a significant correlation between cerebral metabolism and the Clinical Dementia Rating score. A comparison of amyloid imaging tracers with 18F-FDG PET can provide an additional measure of disease severity and would help demonstrate the ability of 18F-florbetapir to correlate with the disease severity.
In the current study, 18F-FDG PET results again correlated well with disease severity as measured by MMSE. The correlation was strongest when the entire cohort of AD patients and controls was compared. This strong correlation is anticipated because of the expected normal metabolism in control subjects and abnormal uptake in AD patients. However, 18F-FDG uptake also did well when compared with MMSE for only the AD patients, suggesting that cerebral glucose metabolism as measured by 18F-FDG is strongly correlated with disease severity. 18F-florbetapir values correlated significantly with disease severity when the entire cohort of controls and AD patients was evaluated. However, the correlation between amyloid binding and MMSE did not hold when evaluated only in the AD patients. This result suggests that amyloid binding does not increase as clinical measures of disease severity worsen and is expected given the currently observed clinical relationship between pathologic amyloid binding and disease progression. However, a larger database with quantitative analysis of the 18F-florbetapir will be needed to confirm this finding.
Although the scans were not analyzed quantitatively, we evaluated the metabolism and amyloid binding by providing a qualitative score based on the interpretation for the frontal, temporal, and parietal regions. There were significant correlations in these regions when we compared the entire cohort of both AD and control subjects. Thus, the greater the amyloid binding, the lower the metabolism in these regions—consistent with a recent study comparing 18F-FDG scans with 11C-PIB PET scans in subjects with AD and mild cognitive impairment and controls (38). We also compared the amyloid binding with metabolism in controls and AD subjects as well as AD subjects alone. When 18F-florbetapir binding and 18F-FDG uptake were compared within the AD patients only, no significant correlations were found. This result is consistent with the finding that 18F-FDG uptake correlated with disease severity in the AD patients whereas 18F-florbetapir uptake did not. This is also similar to the findings reported when comparing 11C-PIB with 18F-FDG (38).
CONCLUSION
Future studies should more effectively quantify the results from the 2 scans, but the purpose of this initial evaluation was to base the findings as much as possible using the manner that would typically be used in a clinical setting.
DISCLOSURE STATEMENT
The costs of publication of this article were defrayed in part by the payment of page charges. Therefore, and solely to indicate this fact, this article is hereby marked “advertisement” in accordance with 18 USC section 1734.
Acknowledgments
This work was supported in by NIH grant AG028688. No other potential conflict of interest relevant to this article was reported.
Footnotes
Published online May 10, 2012.
- © 2012 by the Society of Nuclear Medicine, Inc.
REFERENCES
- Received for publication October 17, 2011.
- Accepted for publication January 12, 2012.


