


Abstract
Separate measurements of Bmax, the density of available receptors, and KD, the equilibrium dissociation constant in the human brain, with PET have contributed to our understanding of neuropsychiatric disorders, especially with respect to the dopamine D2/D3 receptor system. However, existing methods have limited applications to the whole striatum, putamen, or caudate nucleus. Improved methods are required to examine Bmax and KD in detailed functional striatal subdivisions that are becoming widely used. Methods: In response, a new method (bolus-plus-infusion transformation [BPIT]) was developed. After completion of a validation study for 11C-raclopride scans involving 81 subjects, age-associated changes in Bmax and KD were examined in 47 healthy subjects ranging in age from 18 to 77 y. Results: The BPIT method was consistent with established reference tissue methods regarding regional binding potential. BPIT yielded time-consistent estimates of Bmax and KD when scan and infusion lengths were set equal in the analysis. In addition, BPIT was shown to be robust against PET measurement errors when compared with a widely accepted transient equilibrium method. Altogether, BPIT was supported as a method for regional binding potential, Bmax, and KD. We demonstrated age-associated declines in Bmax in all 5 functional striatal subdivisions with BPIT when corrected for multiple comparisons. These age-related effects were not consistently attainable with the transient equilibrium method. Irrespective to methods, KD remained unchanged with age. Conclusion: The BPIT approach may be useful for understanding dopamine receptor abnormalities in neuropsychiatric disorders by enabling separate measurements of Bmax and KD in functional striatal subdivisions.
Measurements of Bmax, the density of available receptors, and KD, the equilibrium dissociation constant in humans, with PET have contributed to our understanding of neuropsychiatric disorders, in particular on the role of dopamine D2/D3 receptors in schizophrenia (1–3). From the methodologic standpoint, the transient equilibrium method (TEM) (as referred to by Hietala et al. (4)) that was advanced by Farde et al. (5) is of particular significance, being widely used with the reversible radioligand 11C-raclopride. TEM, using the cerebellum as the reference region, yielded Bmax and KD values in the putamen and caudate nucleus that were indistinguishable from those given by more invasive methods that required metabolite-corrected plasma time–activity curves. However, Bmax and KD determined with TEM or with plasma input function methods were associated with larger between-subject variability than binding potential (BPND) as measured with regional SD across subjects: a 26% coefficient of variation (COV) for Bmax (6), compared with typically less than 10% COVs for BPND (7) for age- and sex-similar samples. Furthermore, Bmax determined with TEM or with plasma input function methods showed larger test–retest variability than BPND (4). The authors ascribed their findings to low signal-to-noise ratio (i.e., due to low counts) of the low-specific-activity (LSA) scans. Another potential contributing factor could be the fact that TEM and other published methods (5) used an instant moment when the change in the bound amount becomes zero to obtain the amount of bound nonradioactive ligand and the bound-to-free ratio to calculate Bmax and KD.
To overcome this concern, a new method was developed using a formula that predicted regional time–activity curves of the PET experiments using the bolus-plus-infusion (B/I) scheme (8). The formula has been validated for prediction purposes for several PET ligands including 11C-raclopride (9–11). Here, we extend the formula for the derivation of BPND, Bmax, and KD for bolus injection PET experiments. The proposed transformation of bolus injection time–activity curves to hypothetical B/I time–activity curves (heretofore referred to as the bolus-plus-infusion transformation [BPIT]) is expected to generate a prolonged steady state (>30 min) on which variables for Scatchard plots are obtained. Therefore, it was anticipated that the proposed BPIT may improve robustness against PET measurement errors over TEM, although it is yet to be examined.
Although Bmax and KD measurements were conventionally limited to whole putamen and caudate nucleus, the recent introduction of functional subdivisions of the striatum, which include 5 motor, affective, and limbic subdivisions per side (12,13), is a new focus in dopamine system research with PET. Subsequent studies demonstrated differential involvements of the subdivisions in various neuropsychologic and substance addiction conditions, including schizophrenia (14,15), Tourette syndrome (7), and alcoholism (16,17). Therefore, methods for Bmax and KD calculation of dopamine D2/D3 receptors have to be validated against smaller subdivisions that are expected to be associated with greater PET measurement errors. The primary aim of this study was to examine whether TEM and BPIT are robust when applied to functional striatal subdivisions.
To this end, we examined age-associated changes in Bmax and KD in striatal subdivisions. Age-associated decreases in dopamine D2/D3 receptors have been established in the human brain in vivo with PET (18,19) and in postmortem studies (20,21). Further, age-associated decreases in BPND have been reported to differ among striatal subdivisions (22,23). Regarding Bmax and KD, Rinne et al. (24) showed an age-related decrease in Bmax on the whole striatum using TEM. When left and right putamen and caudate nucleus were treated separately, the decrease in Bmax remained statistically significant in the right putamen only. These findings suggested a possibility that TEM was prone to a lower signal-to-noise ratio in smaller volumes. Therefore, examination of age-related changes in Bmax and KD in striatal subdivisions should serve as a challenging test for the utility of TEM and BPIT in smaller volumes of interest (VOIs). It was anticipated that these methods, when validated for functional subdivisions through this study, would provide useful tools for improving our understanding of the roles of dopamine D2/D3 receptors in normal human functions and in neuropsychiatric disorders.
MATERIALS AND METHODS
Theory
Carson et al. (8) advanced the following prediction formula for time–activity curves of regions, AT(t) of B/I experiments using observed time–activity curves, and A(t) of bolus injection scans:
Here, we demonstrate mathematically that the Bmax and KD of receptor systems can be obtained by BPIT via 1 pair of high-specific-activity (HSA) and LSA bolus injection PET scans, as conventionally used (5). In LSA experiments in which the amount of bound ligand is not negligible, we have the following set of differential equations (5):
In practice, Bmax and KD/fND are determined using available AC − RC and AC/RC − 1 in place of BC and BC/FC, respectively, in Equation 4. FC is in fact equal to RC, assuming negligible regional differences in nondisplaceable distribution volume, VND (i.e., K1/k2 = K1R/k2R) (25). BPND is defined for HSA scans only where BC is negligible:
It appears possible to set TI in BPIT independent of the scan length (TS) for the purpose of data analysis. We theorized that setting TI and TS to equal values (i.e., TI = TS) would yield time-consistent estimates of Bmax and KD, and that setting TI and TS to unequal values would result in systematic biases. If validated, this would demonstrate that BPIT settings for TI and TS must be equal as originally predicted by the formula in Equation 1 (8).
Subjects
Eighty-one subjects who underwent HSA and LSA 11C-raclopride PET scans are included in this analysis. Subjects were participants of 3 ongoing research projects. One project (26) comprised patients with restless legs syndrome (n = 23; mean age ± SD, 59.3 ± 9.3 y; 13 women and 10 men) and healthy subjects (n = 32; mean age ± SD, 59.3 ± 8.2 y; 17 women and 15 men). Inclusion and exclusion criteria for restless legs syndrome subjects are described elsewhere (26). Participants of the other 2 projects (n = 27; mean age ± SD, 24.2 ± 4.3 y; 14 women and 13 men) were healthy subjects (McCaul and Wand, unpublished data, 2012; (7)). Briefly, healthy subjects were without a current or past history of neurologic and psychiatric diseases and substance addiction or dependence and showed no abnormal findings on physical examination at the time of participation. Detailed inclusion and exclusion criteria can be found elsewhere (7,17,26). Data of all 81 participants were used for evaluation of analysis methods. All healthy subjects who underwent the 2 scans during the daytime (n = 47; age range, 18–77 y; 23 women and 24 men) were included for examination of age-related changes in BPND, Bmax, and KD. Subjects gave signed informed consent before their participation. The consent forms were approved by the institutional review board of the Johns Hopkins University.
PET and MRI Procedures
PET Procedures
PET was performed on an Advance scanner (GE Healthcare) with a 14.875-cm axial field of view. Before the scan, a catheter was placed in the antecubital vein of the participant's left arm for the tracer injection. In selected subjects (n = 33), another catheter was inserted in the right radial artery to obtain arterial blood samples. Then, the subject was positioned in the scanner with the head lightly immobilized with a custom-made thermoplastic mask to reduce head movement during the scan. After a transmission scan with a 68Ge source for attenuation correction, a 90-min emission scan in 3-dimensional mode was started with a slow bolus injection of 11C-raclopride (714.1 ± 44.4 MBq [19.3 ± 1.2 mCi]). In scans with an arterial catheter, arterial blood was sampled at rapid intervals (<5 s) initially and with prolonging intervals toward the end of the emission scan. Selected samples were analyzed by high-pressure liquid chromatography for radioactive metabolites in plasma using previously reported methods (27). 11C-raclopride was synthesized with minor changes in purification and formulation according to the published procedure (28). In LSA scans, nonradioactive raclopride was added to the 11C-raclopride solution targeting to achieve an SA of 555 MBq (15 mCi)/μmol. The final SA adjusted to the injection time was used for the calculation of Bmax and KD. Observed SA averaged 383.2 ± 244.2 GBq (10,357.0 ± 6,601.2 mCi)/μmol (range, 60.0–1,330.6 GBq [1,622.8–35,961.0 mCi]/μmol) and 640.1 ± 148 MBq (17.3 ± 4.0 mCi)/μmol (range, 366.3–1,098.9 MBq [9.9–29.7 mCi]/μmol) for HSA and LSA scans, respectively.
Each emission scan was reconstructed to 35 transaxial images of 128 ×128 voxels by a backprojection algorithm using the manufacturer-provided software corrected for attenuation, scatter, and dead time. The resulting resolution was approximately 6 mm in full width at half maximum (29).
MRI Procedures
On a separate occasion, a spoiled-gradient-sequence MRI scan was obtained for each subject using the following parameters: repetition time, 35 ms; echo time, 6 ms; flip angle, 458; slice thickness, 1.5 mm with no gap; field of view, 24 × 18 cm; and image acquisition matrix, 256 × 192, reformatted to 256 × 256.
PET Data Analysis
VOIs
VOIs for the putamen, caudate nucleus, and cerebellum were defined on the MR image using the 3-dimensional interactive-segmentation mode of a locally developed VOI-defining tool (VOILand) (30). Then, striatal VOIs were subdivided to the ventral striatum and anterior and posterior putamen and caudate nucleus (5 subdivisions per side (13)) using a semiautomated method (30) that incorporated anatomic guidance based on postmortem human materials (31). The anterior putamen and anterior and posterior caudate nucleus were classified as associative striatum, whereas the posterior putamen represented motor striatum and the ventral striatum consisted of limbic striatum (12). VOIs were transferred from MRI to PET space according to MRI-to-PET coregistration parameters obtained with an SPM5 module for this purpose ((32); available at www.fil.ion.ac.uk/spm5) and applied to PET frames to obtain regional time–activity curves.
Optimization of TB
First, TB was optimized by minimizing the sum of the SDs of AT(t), RT(t), and CT(t) across PET frames from t* to 90 min for a t* of 30, 40, and 50 min for each scan for subjects with arterial blood samples. Values of AC, RC, and CC were obtained as respective means of AT(t), RT(t), and CT(t) between t* and 90 min. To evaluate achievement of plateaus in BPIT quantitatively, normalized residual sums of squares (nRSS) across t*- to 90-min frames were compared between BPIT and the multilinear reference tissue method with 2 parameters (MRTM2 (33)). Calculation formulas for nRSS are Σ(AT(t) − AC)2/AC for BPIT and Σ(A(t) − eA(t))2/AC for MRTM2, where eA(t) stands for model-predicted A(t) given by MRTM2. MRTM2 was applied to LSA scans for this evaluation after confirming small differences in nRSS between HSA and LSA scans, although the biologic significance of estimated parameters are unclear for LSA scans. After confirming that AT(t), RT(t), and CT(t) reached respective plateaus at least at 40 min on visual inspection and by means of nRSS (see the “Results” section), BPIT was applied to all subjects, setting t* at 40 min without including C(t) in the analysis.
Evaluation of BPIT
Regional estimates of BPND were compared between BPIT, MRTM2 (33), and reference tissue graphical analysis (RTGA (34)) for HSA scans. Then, estimates of Bmax and KD were compared among the following conditions: both TI and TS set at 80 or 90 min (TI = TS) and TI set at 80 or 100 min with TS fixed at 90 min (i.e., TI ≠TS), as explained in the “Theory” section.
After methodologic evaluations, age-associated changes in Bmax and KD were examined in functional subdivisions of the striatum using TEM and BPIT.
Statistical Approaches
Data were summarized as means and SD. The coefficient of determination (R2) was used to evaluate correlations between methods and approaches. Pearson correlation coefficients (r) and P values were reported to evaluate correlations of BND, Bmax, and KD to age using the Matlab (The MathWorks) function “corr.” ANOVA was used to compare methods across regions (2-way ANOVA) using the Matlab function “anova2.”
RESULTS
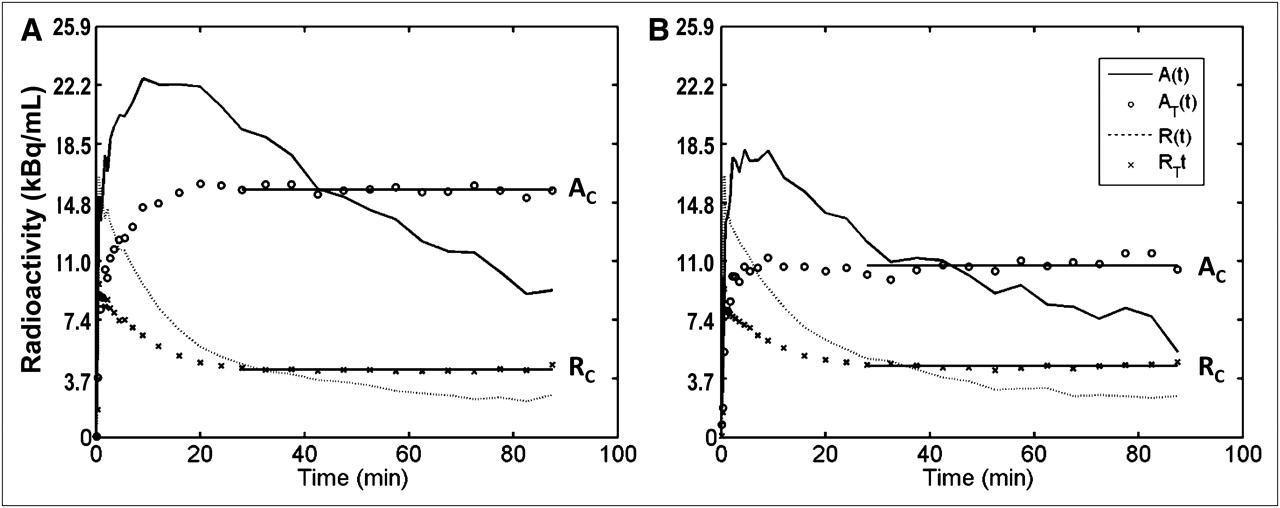
Plots of AT(t) and RT(t) approached respective plateaus by 30 min in all HSA and LSA scans, as shown in Figure 1. In cases with arterial plasma samples, CT(t) also remained unchanged after 40 min. BPIT showed about 5 times less nRSS than MRTM2 (Table 1) (main effect, F1 = 848.78; P < 10−10). Significant region effects were observed (F9 = 83.7; P < 10−10), probably because of smaller volumes of posterior caudate nucleus and ventral striatum. For the cases with plasma blood samples, CT(t) showed nRSS (543.9 ± 318.2 Bq [14.7 ± 8.6 nCi]/mL) that were similar to those of the ventral striatum (t370 = 1.735; P > 0.05) for a t* of 40 min. These findings confirmed that AT(t), RT(t), and CT(t) reached respective plateaus at 40 min and consequently that FT(t) and then BT(t) also approached respective plateaus in this time frame. Accordingly, regional BPND values were identical between the plasma input method (i.e., using AT(t), RT(t), and CT(t) for estimation of TB; =y) and the reference tissue method (i.e., using AT(t) and RT(t) alone; =x) (y = 1x + 0; R2 = 1.00; pooling HSA and LSA scan values). Therefore, the remaining analyses were conducted using AT(t) and RT(t) alone. The best estimates of TB averaged at 105 ± 25.8 and 125 ± 30.3 min for HSA and LSA scans, respectively.

Observed and transformed regional time–activity curves of anterior putamen, A(t) and AT(t), respectively, and cerebellum, R(t) and RT(t), respectively, of HSA (A) and LSA (B) 11C-raclopride scans. Both AT(t) for all striatal subdivisions and RT(t) became stable by 30 min in all cases. Assumed plateaus (AC and RC) are shown by horizontal solid lines.
Volumes and nRSS in Functional Striatal Subdivisions
For HSA scans, BPIT (=x) yielded BPND values essentially identical to those ofMRTM2 (=y1) and RTGA (=y2): y1 = 1.02x − 0.014, R2 = 0.996, and y2 = 1.00x − 0.066, R2 = 0.998. The findings validated BPIT for BPND for HSA 11C-raclopride scans. BPIT yielded time-consistent estimates of Bmax and KD when both TI and TS were set at 80 or 90 min (Table 2). Conversely, BPIT yielded 5% higher or 4% lower values of Bmax and KD when TI was set at 100 min or 80 min for a TS of 90 min, respectively, than when TI and TS were set at 90 min (Table 2). Estimates of BPND remained unchanged (R2 = 1) when TS was set at 90 min.
Effects of TI in Equation 1 and Assumed Scan Length for BPIT (TS) on Bmax and KD Estimates
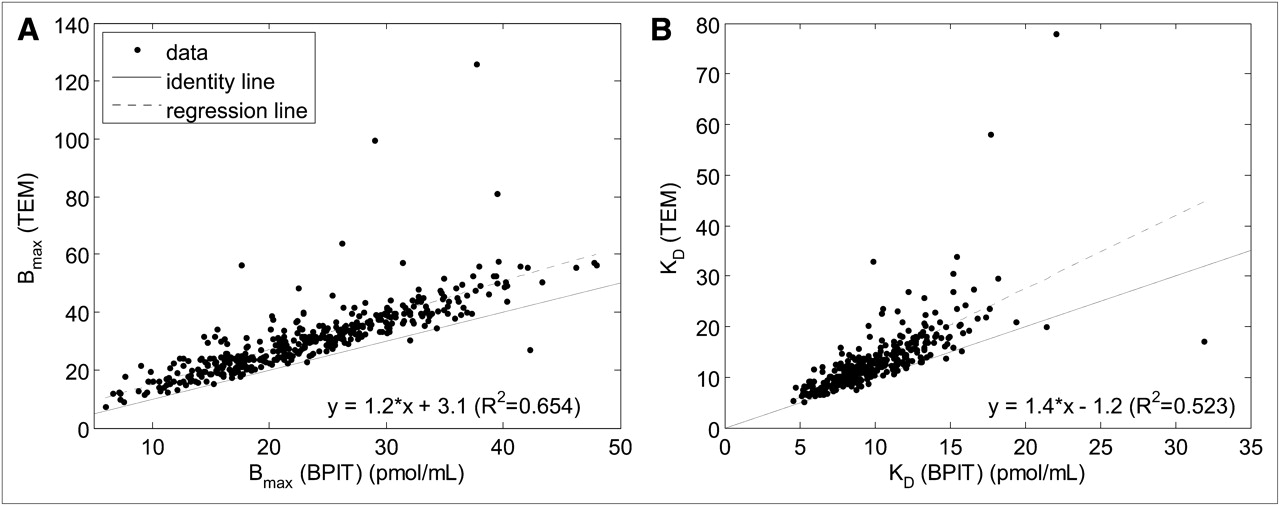
Regional Bmax and KD correlated between BPIT and TEM when left and right VOIs were merged (Fig. 2). When compared with BPIT, TEM yielded slightly higher Bmax and KD values and suffered some outliers (e.g., Bmax > 60 pmol/mL; KD > 50 pmol/mL). Correlations were not supported using TEM when left and right sides were treated separately (R2 = 0.062 for Bmax; R2 = 0.0012 for KD), mainly because of an increased number of outliers.

Scatterplots of regional values of Bmax (A) and KD (B), TEM (=y) vs. proposed BPIT (=x). Data from all subjects (n = 81), 5 subdivisions per subject with left and right VOIs merged, are shown (a total of 405 points). Linear regression equations and coefficients of determination (R2) are shown in each panel.
When left and right VOIs were analyzed separately, regional Bmax decreased as a function of age in 9 of 10 regions (excluding right posterior caudate nucleus) by BPIT, whereas only 4 regions showed correlations by TEM after Bonferroni adjustment (Table 3). When left and right VOIs were combined, BPIT revealed that Bmax in all 5 subdivisions was inversely correlated with age, whereas TEM failed to identify age-effect in Bmax posterior caudate nucleus and ventral striatum. BPIT and TEM showed similar rates of decline in Bmax, ranging from 0.47% per year to 0.73% per year in regions. No correlations of KD with age were observed in any region by BPIT (0.421 < P < 0.829, across left and right subdivisions) or by TEM (0.251 < P < 0.915). To exemplify these findings, plots of Bmax against age are shown in Figure 3 for ventral striatum, with left and right VOIs merged.
Correlations of Bmax to Age in Healthy Subjects

Scatterplots of Bmax vs. age for ventral striatum of healthy subjects (n = 47) with left and right VOIs merged, given by BPIT (A) and TEM (B). Linear regression equations and coefficients of determination (R2) are shown in each panel.
DISCUSSION
This study demonstrated that BPIT yielded robust estimates of Bmax and KD of dopamine D2/D3 receptors for functional subdivisions of the striatum using HSA and LSA 11C-raclopride PET. However, the widely used TEM (5), also using the cerebellum as the reference region, showed more unstable estimates when applied to striatal subdivisions than did conventional, larger VOIs for which the method has been validated. Therefore, the current findings support application of BPIT for the newly emerged anatomic demand (7,12–17). The improved robustness of BPIT over TEM can be ascribed to the different approaches that the 2 methods assumed to overcome the challenging point (i.e., the equation of dB(t)/dt in Eq. 2) of Bmax and KD measurements: Farde et al. (5) advanced a solution by focusing on an instant moment when dB(t)/dt became zero in Equation 2. Accordingly, the method was referred to as TEM by Hietala et al. (4). In contrast, we devised a simple solution without use of the complicated equation. This study demonstrated that steady-state for BPIT is achieved for 11C-raclopride scans when t* and TI were set at 40 and 90 min, respectively. In other words, BPIT uses averages between 40 and 90 min, whereas TEM uses the instant time point. The limited time resolution of PET may be a disadvantageous factor for TEM.
BPIT is a graphical method for model parameter estimation. A close analogy would be RTGA (34): the Logan lot of calculated variables, namely ∫A(t)dt/A(T) (=y) versus ∫R(t)dt/A(T) yields BPND as a slope of the asymptote less 1. RTGA requires an assumed value for k2 of the reference region (k2R, 0.163 min−1 for 11C-raclopride (34)). Similarly, the BPIT plot (Fig. 1) uses a calculated variable (Eq. 1) as y variable and yields BPND (Eq. 5). BPIT estimates 1 value of TB for all regions in each experiment. Techniques for estimating a variable that is assumed to be common across regions was also advanced by Wu and Carson (35) for k2R for the simplified reference region method (36) and by Ichise et al. (33) for k2R in an independent linear solution. BPIT yielded regional values of BPND that were indistinguishable from established RTGA and MRTM2 for HSA 11C-raclopride scans. Thus, we concluded that BPIT is validated for HSA 11C-raclopride scans.
Because of the time-consistent estimates of Bmax and KD obtained with equal values of TI and TS and systematic biases seen with unequal TI and TS (Table 2), we concluded that TI must be set at TS in BPIT as it was verified for the prediction purpose (8).
An age-dependent decline of BPND of dopamine D2/D3 receptors has been repeatedly confirmed, predominantly using 11C-raclopride. To our knowledge, Kim et al. (23) was the first to examine age-dependent declines in BPND in the functional striatal subdivisions. The authors found significant decreases bilaterally in the posterior putamen alone, probably because of the relatively narrow age range and smaller sample size (24–54 y; 13 women and 10 men). This study showed significant decreases in all subdivisions in a population sample, with larger age ranges and larger sample size (18–77 y; 20 women and 22 men). Interestingly, the findings of the 2 studies agreed in that posterior putamen (i.e., motor striatum) showed larger rates of decline than associative striatum and limbic striatum.
Rinne et al. (24) reported a rate of decline in Bmax to be 0.5% per year using 11C-raclopride, whereas Wong et al. (37) reported a rate of 1% per year using an irreversible radioligand 11C-N-methylpiperone and a distinctive analysis method (38). Compared with their previous report (24), Pohjalainen et al. (39) replicated a significant decrease in Bmax in the right striatum but not in the left striatum, despite a larger number of subjects and inclusion of a wide age range (19–82 y; 21 women and 33 men). Putamen and caudate nucleus were not evaluated independently in this study. The authors did not find any age-associated change in KD, in agreement with earlier reports (24,37). To our knowledge, these 3 studies appeared to be the only reports that examined Bmax and KD with respect to age in the human brain. Therefore, this study using proposed BPIT is the first to report age-associate decreases of Bmax in functional striatal subdivisions. Weaker correlations were observed with TEM.
There are several limitations of the study. First, the radioactivity in the vascular volume within a region was omitted from the equations to simplify presentation of the theory (e.g., A(t) = B(t) + F(t) + v0·C(t) to be precise, where v0 is the vascular volume). However, because of the linear nature of Equation 1, it is self-evident that the inclusion of v0 does not change the findings. BPIT may suffer degrees of biases in BPND, Bmax, and KD similar to other established tissue reference methods. Second, observed SA averaged 640.1 MBq (17.3 mCi)/μmol in LSA scans (target SA = 555 MBq [15 mCi]/μmol). The measure was taken to reduce the chances of adverse effects such as akathisia with pharmacologic doses of the dopamine antagonist raclopride (5). TEM was validated with significantly lower SA levels (88.8–114.7 MBq [2.4–3.1 mCi]/μmol; (5)). Rinne et al. (24) also used lower SA levels (92.5–418.1 [2.5–11.3 mCi]/μmol) to examine age-dependent changes in Bmax. In theory, lower SA levels in LSA scans bring LSA points toward the y-axis in the Eadie-Hofstee plot (Eq. 4) and contribute to increasing the accuracy of Bmax. Therefore, it should be clarified that the accuracy of TEM estimated in this study cannot be directly compared with these earlier studies. Conversely, BPIT could be applicable to studies even with relatively modest SA in LSA scans.
The most difficult point in the validation of BPIT could be to prove achievement of plateaus. Linear regression may appear appropriate for this purpose. To evaluate achievement of plateaus in an unbiased manner, we used an approach that applies RSS of model fitting. RSS is considered to be composed of errors originating from PET measurement errors and the systematic bias due to disagreement between the model and reality. The results indicated that systematic biases observed with BPIT (i.e., steady increases or decreases of AT(t), RT(t), and CT(t)) were significantly lower than systematic biases that were associated with MRTM2, provided PET measurement errors were relatively similar to each other. For this reason, we concluded that plateaus were achieved for PBIT. Further validation may be obtained by actually performing HSA and LSA B/I experiments, as has been reported in animal studies for the opiate receptors (40).
CONCLUSION
This study demonstrated that BPIT is a valid method for measurements of BPND, Bmax, and KD of dopamine D2/D3 receptors using 11C-raclopride PET scans. The method yielded more robust estimates of Bmax and KD in smaller striatal subdivisions than the widely used TEM. Age-dependent declines in Bmax were observed in functional striatal subdivisions, except for the posterior caudate nucleus, using BPIT. Therefore, BPIT may be useful for detecting changes in Bmax and KD in small functionally uniform regions in various neuropsychiatric and substance abuse disorders.
DISCLOSURE STATEMENT
The costs of publication of this article were defrayed in part by the payment of page charges. Therefore, and solely to indicate this fact, this article is hereby marked “advertisement” in accordance with 18 USC section 1734.
Acknowledgments
We thank the Johns Hopkins Hospital PET Center and Biomedical Cyclotron staff. This work was supported by PHS grants R01 AA012837, R01 AA010158, PO1 AG21190, R01 NS42857, and R01 MH078175. No other potential conflict of interest relevant to this article was reported.
Footnotes
Published online Apr. 9, 2012.
- © 2012 by the Society of Nuclear Medicine, Inc.
REFERENCES
- Received for publication September 12, 2011.
- Accepted for publication January 3, 2012.


