


Abstract
Activation of microglia is a hallmark of inflammatory, infectious, and degenerative diseases of the central nervous system. Several studies have indicated that there is an increase in release of β-glucuronidase by activated microglia into the extracellular space at the site of neuroinflammation. β-glucuronidase is involved in the hydrolysis of glycosaminoglycans on the cell surface and the degradation of the extracellular matrix. Therefore, β-glucuronidase might be a biomarker for ongoing neurodegeneration induced by neuroinflammation. In this study, we investigated whether the PET tracer 18F-FEAnGA was able to detect β-glucuronidase release during neuroinflammation in a rat model of herpes encephalitis. Methods: Male Wistar rats were intranasally inoculated with herpes simplex virus 1 (HSV-1) or phosphate-buffered saline as a control. 11C-(R)-PK11195 and 18F-FEAnGA small-animal PET scans were acquired for 60 min. Logan graphical analysis was used to calculate 18F-FEAnGA distribution volumes (DVLogan) in various brain areas. Results: After administration of 18F-FEAnGA, the area under the activity concentration–versus–time curve of the whole brain was 2 times higher in HSV-1–infected rats than in control rats. In addition, the DVLogan of 18F-FEAnGA was most increased in the frontopolar cortex, frontal cortex, bulbus olfactorius, cerebral cortex, cerebellum, and brainstem of HSV-1–infected rats, when compared with control rats. The conversion of 18F-FEAnGA to 4-hydroxy-3-nitrobenzyl alcohol was found to be 1.6 times higher in HSV-1–infected rats than in control rats and correlated with the DVLogan of 18F-FEAnGA in the same areas of the brain. Furthermore, the DVLogan of 18F-FEAnGA also correlated with β-glucuronidase activity in the same brain regions. In addition, DVLogan of 18F-FEAnGA showed a tendency to correlate with 11C-(R)-PK11195 uptake (marker for activated microglia) in the same brain regions. Conclusion: Despite relatively low brain uptake, 18F-FEAnGA was able to detect an increased release of β-glucuronidase during neuroinflammation.
Neurologic disorders are often debilitating diseases in which the symptoms can be treated but the disease cannot be cured. Despite the large differences between neurologic disorders, neuroinflammation is involved in both acute pathology, such as stroke and encephalitis, and chronic neurodegenerative diseases, such as Parkinson and Alzheimer disease.
Microglia are the predominant population of macrophages in the brain and are responsive to injury or infection of brain tissue. On activation, microglia undergo dramatic morphologic changes, metamorphosing from the ramified resting state to the amoeboid activated state. In addition to morphologic changes, activation of microglia results in the upregulation of molecules, such as the peripheral benzodiazepine receptors, that are located in the outer mitochondrial membrane (1). Furthermore, activation of microglia leads to an increase in the production of cytokines and several hydrolases (2). Functions of microglia in the central nervous system appear to be complex, as they exhibit both neuroprotective and neurotoxic properties (3). Given the role of microglia in mediating neurodegeneration, a great deal of effort has been put toward the investigation of mechanisms and mediators by which microglia can lead to neurodegeneration. There is some evidence that certain types of degeneration in the central nervous system are accompanied by large increases in lysosomal β-glucuronidase activity. β-glucuronidase is involved in the hydrolysis of glycosaminoglycans on the cell surface and the degradation of the extracellular matrix. It is known that β-glucuronidase is present extracellularly in necrotic areas of solid tumors. In inflammation, β-glucuronidase is known to be released from granulocytes, including neutrophils, that are highly present at the sites of inflammation (4–6). Furthermore, studies on experimental animals have shown that brain lysosomal hydrolase activities increase after infection with viruses (7) and after the slow virus–mediated diseases scrapie (8), Creutzfeldt–Jakob disease (9), and multiple sclerosis (10,11).
Elevated levels of β-glucuronidase have been reported in the temporal cortex of Alzheimer disease patients and the putamen of patients with Huntington disease (12). McGeer et al. (13,14) indicated that the apparent correlation between low 18F-FDG uptake in Alzheimer disease patients and β-glucuronidase activity determined postmortem is consistent with previous suggestions that the decreases in metabolism reflects local neuronal loss and gliosis. According to Koshiya et al., β-glucuronidase is associated with gliosis, and its activity in the cells is enhanced with glial proliferation (15). Taken together, the studies in humans and in experimental animal models suggest that β-glucuronidase activity may be a useful biochemical indicator of cellular injury in the brain that accompanies the destructive response of activated microglia.
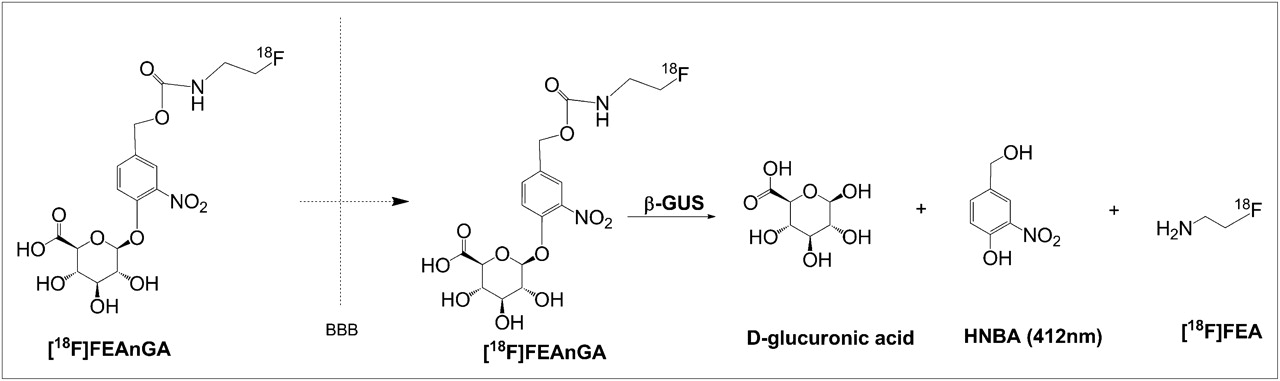
Recently, our group designed a PET tracer, 18F-1-O-(4-(2-fluoroethyl-carbamoyloxymethyl)-2-nitrophenyl)-O-β-d-glucopyronuronate (18F-FEAnGA), for β-glucuronidase imaging. This tracer has a glucuronide-prodrug–based structure similar to the known prodrug HMR 1826 but with the doxorubicin moiety being replaced by the radioactive 18F-fluoroethylamine group. In tissues with high levels of extracellular β-glucuronidase, 18F-FEAnGA is selectively cleaved by β-glucuronidase at the glucuronic acid moiety, and after self-immolation of the spacer, the released 18F-fluoroethylamine is more slowly cleared from the target tissue than uncleaved 18F-FEAnGA, which is more hydrophilic (Fig. 1).

Mechanism of activation of 18F-FEAnGA by β-glucuronidase (GUS).
In this study, we investigated whether β-glucuronidase is released during neuroinflammation, in a rat model of herpes encephalitis (16–18) using specific PET tracers for β-glucuronidase (18F-FEAnGA) and neuroinflammation (11C-(R)-PK11195).
MATERIALS AND METHODS
Synthesis of 18F-FEAnGA
18F-FEAnGA was prepared as described previously (19). The tracer was purified by high-performance liquid chromatography (HPLC), using a semipreparative Prodigy C18 reverse-phase column (5 μm, 10 × 250 mm; Phenomenex) with 10% ethanol in 2.5 mM phosphate buffer as the eluent (flow rate, 4 mL/min; retention time: 18F-FEAnGA = 10 min, 18F-fluoroethylamine = 5 min). At the end of synthesis, the specific activity of 18F-FEAnGA was 150 ± 50 GBq/μmol, and the radiochemical purity was greater than 95% (HPLC with a Symmetry C18 column [5 μm, 4.6 × 150 mm] with 5% acetonitrile in 2.5 mM phosphate buffer; flow rate, 1 mL/min; retention time: 18F-FEAnGA = 23 min).
Synthesis of 11C-(R)-PK11195
11C-(R)-PK11195 was labeled by trapping 11C-methyl iodide (20) in a solution of 1 mg of (R)-N-desmethyl PK11195 and 10 mg of potassium hydroxide in 300 μL of dimethylsulfoxide. The mixture was allowed to react for 1 min at 40°C, neutralized with 1 M HCl, and passed through a 45-μm Millex HV filter. The filtrate was purified by HPLC using a μBondapak C18 column (7.8 × 300 mm) with acetonitrile/25 mM NaH2PO4 (pH 3.5) (55/45) as the eluent (flow, 5 mL/min). To remove the organic solvents from the product, the collected HPLC fraction (retention time, 7 min) was diluted with 100 mL of water and passed through an Oasis HLB 30 mg (1 cm3) cartridge. The cartridge was washed twice with 8 mL of water and subsequently eluted with 0.7 mL of ethanol and 5 mL of water. The product was sterilized by filtration over a 0.22-μm Millex LG filter. The product was obtained in 33% ± 15% radiochemical yield (corrected for decay). Quality control was performed by HPLC, using a Novapak C18 column (150 × 3.9 mm) with acetonitrile/25 mM NaH2PO4 (pH 3.5) (60/40) as the eluent at a flow of 1 mL/min. The radiochemical purity was always greater than 95%, and the specific activity was 51 ± 18 GBq/μmol.
Animals
Male Wistar rats were obtained from Harlan. The rats were individually housed in Macrolon (Bayer MaterialScience LLC) cages (38 × 26 × 24 cm) on a layer of wood shavings in a room with constant temperature (21°C ± 2°C) and a fixed, 12-h, light–dark regime. Food (standard laboratory chow [RMH-B; Hope Farms]) and water were available ad libitum. After arrival, the rats were allowed to acclimatize for at least 7 d. All experiments were approved by the Animal Ethics Committee of the University of Groningen, The Netherlands.
Herpes Simplex Virus 1 (HSV-1) Inoculation
An HSV-1 strain was obtained from a clinical isolate, cultured in Vero cells, and assayed for plaque-forming units per milliliter. The rats were anesthetized with isoflurane (5% for induction and 2% for maintenance) (Pharmachemie BV) and inoculated with HSV-1 by the application of 100 μL of phosphate-buffered saline (PBS) with 1 × 10⁷ plaque-forming units of virus in the nostrils (50 μL/nostril) with a micropipette. Control rats were treated similarly by the application of 100 μL of PBS without virus. Clinical symptoms in all rats were scored daily after the inoculation by the same observer.
Small-Animal PET of 18F-FEAnGA
β-glucuronidase activity was studied in the rat model of herpes encephalitis with 18F-FEAnGA. The PET scans were acquired on day 7 or 8 after the inoculation with HSV-1. The rats (control, n = 4, and HSV-1–infected, n = 8) were anesthetized with 2% isoflurane (5% for induction and 2% for maintenance), and a canula was inserted into the femoral artery. After cannulation, the rats were positioned in the small-animal PET camera (microPET Focus 220; Siemens Medical Solutions) with their heads in the field of view. A transmission scan of 515 s with a 57Co point source was obtained for the correction of attenuation and scatter by tissue. After the transmission scan was completed, the PET tracer 18F-FEAnGA (6.9 ± 3.1 MBq) was injected via the penile vein. Simultaneously with the injection of the PET tracer, an emission scan of 60 min was started and blood samples of 0.1 mL were taken at 15, 30, 45, 60, 75, 90, 120, 150, 300, 450, 600, 1,800, and 3,600 s after the injection. After a blood sample was taken, 0.1 mL of heparinized saline was injected through the same arterial canula to prevent large changes in blood pressure. The blood samples were centrifuged at 6,000 rpm for 10 min, and 25 μL of plasma were collected. The activity in plasma was measured with a γ-counter (LKB Wallac). The plasma time–activity curves were corrected for decay.
The list-mode data of the emission scans were separated into 21 frames (8 × 30, 3 × 60, 2 × 120, 2 × 180, 3 × 300, and 3 × 600 s). Emission sinograms were iteratively reconstructed (ordered-subsets expectation maximization, 2 d, 4 iterations, 16 subsets) after being normalized, corrected for attenuation, and corrected for radioactive decay.
Small-Animal PET of 11C-(R)-PK11195
Activation of microglia was studied in the rat model of herpes encephalitis with 11C-(R)-PK11195. The PET scans were acquired on either day 5 (control, n = 7, and HSV-1, n = 7) or day 7 (control, n = 5, and HSV-1, n = 7) (17) after inoculation with HSV-1. The rats were anesthetized by 5% isoflurane mixed with medical air at a flow of 2 mL/min, which was maintained at 2% isoflurane during the PET scan. After induction of anesthesia, the rats were positioned in the microPET Focus in transaxial position with their heads in the field of view. After the transmission scan were completed, the PET tracer 11C-(R)-PK11195 (44 ± 16 MBq) was injected via the penile vein. Simultaneously with the injection of the PET tracer, a dynamic emission scan of 60 min was started. The list-mode data of the emission scans were separated into 4 frames of 15 min. Emission sinograms were iteratively reconstructed as described above.
Small-Animal PET Image Analysis
PET image analysis was conducted with Inveon Research Workplace software (Siemens, version 3.0). Regions of interest (ROIs) were drawn around the whole brain, bulbus olfactorius, frontopolar cortex, frontal cortex, hippocampus, striatum, thalamus, parietal/temporal/occipital cortex, brainstem, midbrain, and cerebellum in a template MRI scan that was coregistered with the PET scan of interest by image fusion. The time–activity curves per ROI were determined in Bq/cm3 and converted into standardized uptake values, defined as [tissue activity concentration (Bq/cm3)]/[injected dose (Bq)/body weight (g)]. It was assumed that 1 cm3 of brain tissue equals 1 g.
The plasma time–activity curves in Bq/cm3 were used for pharmacokinetic modeling with Inveon Research Workplace software. Distribution volumes (DVLogan) were calculated using the linear model developed by Logan (21).
Metabolite Analysis
A total of 2.5 μL of each plasma sample was collected and applied on a thin-layer chromatography plate, which was subsequently eluted with acetonitrile/water (7/3) (Rf 18F-fluoroethylamine = 0.57, Rf 18F-FEAnGA = 0.89). After elution, radioactivity on the thin-layer chromatography plates was analyzed by phosphor storage imaging. Exposed screens were scanned with a Cyclone phosphor storage system (PerkinElmer), and the percentage of conversion of 18F-FEAnGA as a function of the tracer distribution time was calculated by ROI analysis using OptiQuant (PerkinElmer) software
Ex Vivo Analysis of Conversion of 18F-FEAnGA to 18F-Fluoroethylamine by Measurement of Release of 4-Hydroxy-3-Nitrobenzyl Alcohol (HBNA)
The ability of 18F-FEAnGA to detect extracellular β-glucuronidase is based on the retention of 18F-fluoroethylamine and the yellow-colored spacer, HBNA, as a result of selective cleavage by the extracellular β-glucuronidase present in inflamed regions (Fig. 1).
For analysis of in vivo tracer conversion by β-glucuronidase, the 2 brain regions (cerebellum and brainstem) where inflammation is expected to be most active (17,18,22) were homogenized in 1 mL of PBS (control, n = 4, and HSV-1, n = 8). The homogenates were centrifuged (5 min, 6,000 rpm), and the supernatant was collected. To 0.5 mL of the supernatant, 1 mL of acetonitrile was added to precipitate the remaining proteins. The samples were stirred in a vortex mixer for 30 s and centrifuged at 9,000 rpm for 5 min. A volume of 1 mL was taken for ultraviolet absorption (412 nm) analysis to quantify the amount of HBNA released in infected and control animals. An ROI of both the cerebellum and the brainstem was created in the PET images by fusion of the ROIs of the 2 individual brain regions. The DVLogan volume of the cerebellum–brainstem was calculated and compared with the release of HBNA.
β-Glucuronidase Assay
To 0.5 mL of the supernatant of brain homogenate, 1.5 mL of a solution containing 0.1% bovine serum albumin in PBS (pH 7.4) was added. To 1 mL of the diluted solution, 50 μL of the substrate for β-glucuronidase, 4-nitrophenyl-β-d-glucuronide (ℇ = 7,578 M−1cm−1) (0.1 M), were added, whereas the other 1 mL of the diluted solution received 50 μL of PBS (blank). All tubes were incubated at 37°C for 10 min. The reaction in each tube was stopped by adding 1.5 mL of 0.1 M NaOH, and ultraviolet absorption was measured at 412 nm. Ultraviolet absorption of 4-nitrophenyl-β-d-glucuronide–containing samples was corrected for ultraviolet absorption of blank samples. Absorption was converted into micrograms, using a 4-nitrophenyl calibration curve. The measurements were performed in duplicate. The β-glucuronidase activity was determined in units (U) defined as micromoles of 4-nitrophenyl liberated per minute (23).
Statistical Analysis
All data are expressed as mean ± SD. Differences between groups were determined with the 2-sided unpaired Student t-test (Microsoft Office Excel 2003). Significance was reached when the P value was 0.05 or less. A Shapiro–Wilk test for normality was performed for the different brain regions for all groups. The null hypothesis was that the data were normally distributed. In this test, we obtained a P value of more than 0.05 for all brain regions with the exception of the parietal/temporal/occipital cortex data for control animals analyzed with 18F-FEAnGA. Therefore, we excluded this brain region from the statistical analysis. Correlations were assessed with the Pearson product moment correlation coefficient (r) using SigmaPlot 10 and were considered statistically significant when r2 was at least 0.5 and P was less than 0.05.
RESULTS
Clinical Symptoms
Clinical symptoms were scored daily after inoculation of the HSV-1 and were categorized into the following clinical scores: 0, no symptoms; 1, ruffled fur and irritated mouth, nose, and eyes; 2, behavioral signs such as stress, lethargy, and a hunched posture; 3, posterior paralysis and impairment of motor function; and 4, severe paralysis, labored breathing, or death. The first clinical symptoms in the HSV-1 rats were seen on day 4 or 5 after inoculation, followed by a gradual increase in the severity of the symptoms over time. The HSV-1–infected rats scanned with 18F-FEAnGA on day 7 or 8 had an average clinical score of 1.3 ± 1.1, whereas the infected rats scanned with 11C-(R)-PK11195 had an average score of 1.4 ± 1.0 on day 5 and 2.5 ± 0.5 on day 7 (17).
Small-Animal PET
The 18F-FEAnGA PET images and the whole-brain time–activity curves are displayed in Figure 2. The images showed a low brain uptake of the tracer in infected and control animals. The time–activity curves showed that 18F-FEAnGA followed a rapid 2-phase decline in uptake in the whole brain. From HSV-1–infected brains, 15% of the activity was cleared with a half-life (t1/2)1 of 0.7 ± 0.6 min and 85% of the activity with a half-life (t1/2)2 of 14 ± 11 min (n = 8). In control rats, 17% of the activity was washed out of the brain with a half-life (t1/2)1 of 0.4 ± 0.1 min and 83% of the activity with a half-life (t1/2)2 of 8 ± 3 min (n = 8). In addition, the area under the curve (10–60 min) in the whole brain of HSV-1–infected rats was 2 times (9 ± 4) higher than that in control rats (5 ± 1, P = 0.05).
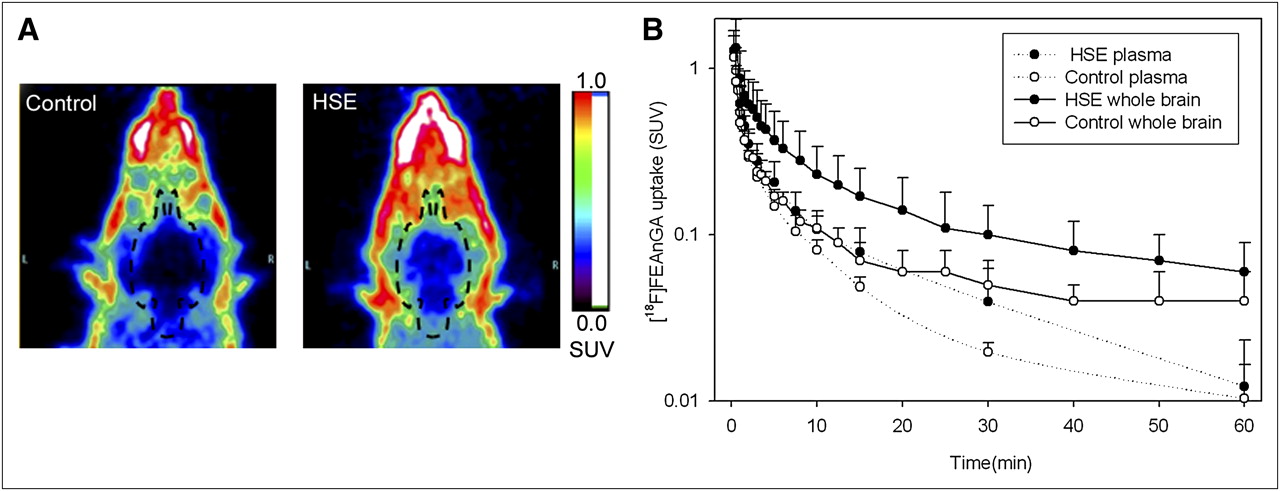
(A) Coronal view of head of control rat and HSV-1–infected rat (HSE). Images represent tracer uptake between 10 and 60 min after injection of 18F-FEAnGA. (B) Whole-brain and plasma time–activity curves of 18F-FEAnGA, expressed as standardized uptake values (SUV; mean ± SD) of control rats (n = 4) and HSV-1–infected rats (n = 8). y-axis is in logarithmic scale.
In contrast to control animals, HSV-1–infected animals showed brain radioactivity uptake that was significantly higher than plasma radioactivity levels.
Pharmacokinetic Modeling
Metabolite analysis was performed on the plasma samples that were taken during the 18F-FEAnGA PET scan. 18F-FEAnGA is stable for the duration of the scan since no radioactive metabolites were found in plasma (at 60 min, 98% ± 4% intact tracer). Therefore, no metabolite correction was required for pharmacokinetic modeling and the total activity in plasma was used as the input function.
The plasma curves were fitted in a single, double, and triple exponential curve model. It was found that the plasma clearance fitted significantly better (P < 0.00001) the double exponential curve model (r2 ≈ 0.992) than the single exponential curve model (r2 ≈ 0.94). However, most of the plasma curves did not fit the triple exponential curve model. Therefore, 18F-FEAnGA showed a 2-phase plasma clearance in infected rats, with 22% of the injected activity having a half-life (t1/2)1 of 0.5 ± 0.2 min and 78% of the injected activity having a half-life (t1/2)2 of 7 ± 3 min (n = 8), which was similar to the plasma clearance of 18F-FEAnGA in control rats (23% (t1/2)1 = 0.5 ± 0.1 min and 77% (t1/2)2 = 8 ± 3 min, n = 4).
Logan analysis, using a delay of 10 min, was used to evaluate the distribution volume of 18F-FEAnGA in the whole brain and in individual regions of the brain. The whole-brain DVlogan of 18F-FEAnGA was found to be 53% higher (P = 0.02) in HSV-1–infected rats than in control rats. Furthermore, DVLogan was found to be highest in the frontopolar cortex (0.20 ± 0.02, P = 0.06), frontal cortex (0.17 ± 0.02, P = 0.02), and bulbus olfactorius (0.17 ± 0.02, P = 0.02), followed by the cerebral cortex (0.13 ± 0.03, P = 0.02), cerebellum (0.12 ± 0.03, P = 0.05), and brainstem (0.11 ± 0.03, P = 0.01) (Table 1). DVlogan was significantly higher in most individual brain regions of HSV-1–infected animals than in the corresponding regions of controls, with the exception of cerebellum and frontopolar cortex.
Distribution Volume of 18F-FEAnGA in Different Regions of Brain in Control Rats (n = 4) and Rats Infected with HSV-1 (n = 8)
Ex Vivo Analysis of β-Glucuronidase Activity
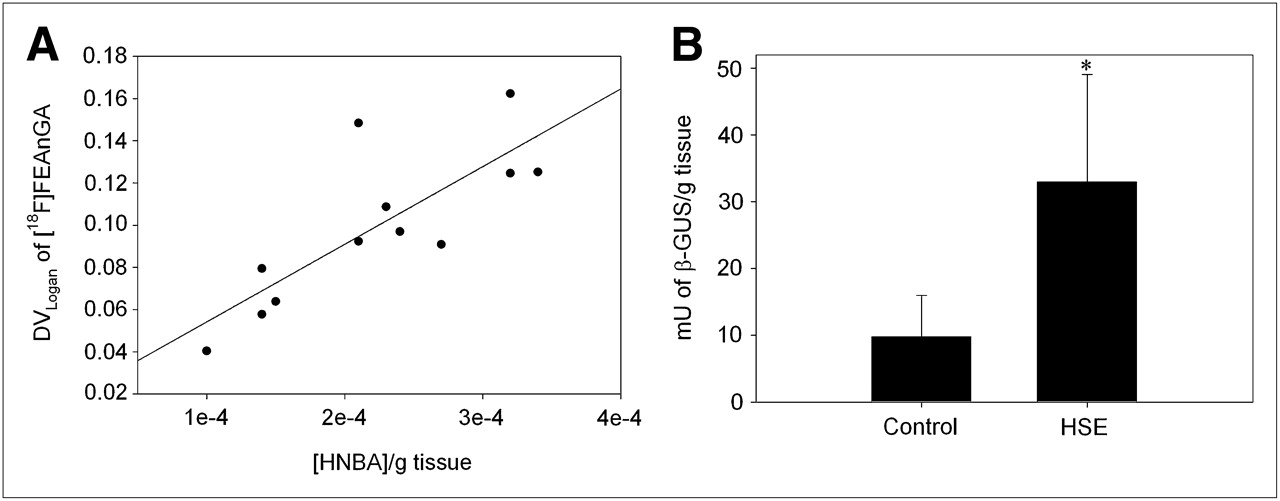
We further quantified the in vivo 18F-FEAnGA conversion to 18F-fluoroethylamine and the spacer HNBA (Fig. 1) in the 2 brain regions (cerebellum + brainstem) where inflammation was expected to be most active (17,18,22) and therefore that most likely would have elevated levels of extracellular β-glucuronidase. Thus, a new ROI was created including both the brainstem and the cerebellum. The DVLogan of the brainstem–cerebellum was found to be 70% (P = 0.04) increased in infected rats, compared with control rats. The in vivo formation of HNBA was also increased 65% (P = 0.02) in infected rats (Fig. 3). In addition, the DVLogan of the brainstem–cerebellum correlated with the amount of HNBA present in these brain regions (y = 383.23x + 0.01, r2 = 0.63, P = 0.002) (Fig. 3). The increased β-glucuronidase activity was confirmed in an in vitro β-glucuronidase enzyme assay that measures the conversion of the glucuronide 4-nitrophenyl-β-d-glucuronide. This in vitro β-glucuronidase assay showed 3.4 times higher enzyme activity in the brainstem–cerebellum of HSV-1–infected animals than in controls (P = 0.03). In addition, this enzyme activity found in the brainstem–cerebellum tended to correlate with the DVLogan of 18F-FEAnGA in the same region (y = 0.002x + 0.06, r2 = 0.52, P = 0.007).

(A) Correlation between DVLogan of 18F-FEAnGA determined in cerebellum–brainstem region and release of spacer HNBA from 18F-FEAnGA. (B) β-glucuronidase activity (mU/g tissue) in cerebellum–brainstem region of control and HSV-1–infected rats, as determined by 4-nitrophenyl-β-d-glucuronide conversion assay. *P < 0.05 compared with controls.
Comparison of 18F-FEAnGA and 11C-(R)-PK11195 Accumulation
Microglia is the predominant population of macrophages in the brain. They are responsive to injury or infection of brain tissue. Activation of microglia results in the upregulation of molecules, such as peripheral benzodiazepine receptors that are located on the outer mitochondrial membrane. 11C-(R)-PK11195, which is a ligand of the peripheral benzodiazepine receptors, is the most widely used PET tracer for imaging activated microglia, as a biomarker of neuroinflammation. In a previous study, we used 11C-(R)-PK11195 for imaging of neuroinflammation in the rat model of herpes encephalitis (17). Activation of microglia leads to an increase in the production of cytokines and several hydrolases, such as β-glucuronidase (2). Thus, a comparison between both tracers might give an indication of how microglial activation is related to the release of β-glucuronidase during pathogenesis, as measured with 18F-FEAnGA.
The distribution volume of 18F-FEAnGA, which was found to be significantly higher in almost all areas of the brain 7 d after HSV-1 inoculation, did not correlate with the uptake of 11C-(R)-PK11195 in the same brain areas 7 d after HSV-1 inoculation (y = 5.06x + 0.13, r2 = 0.30, P = 0.07) (17,18). This lack of correlation was due to the high uptake of 11C-(R)-PK11195 in the brainstem compared with the smaller distribution volume of 18F-FEAnGA in the same region (Fig. 4).
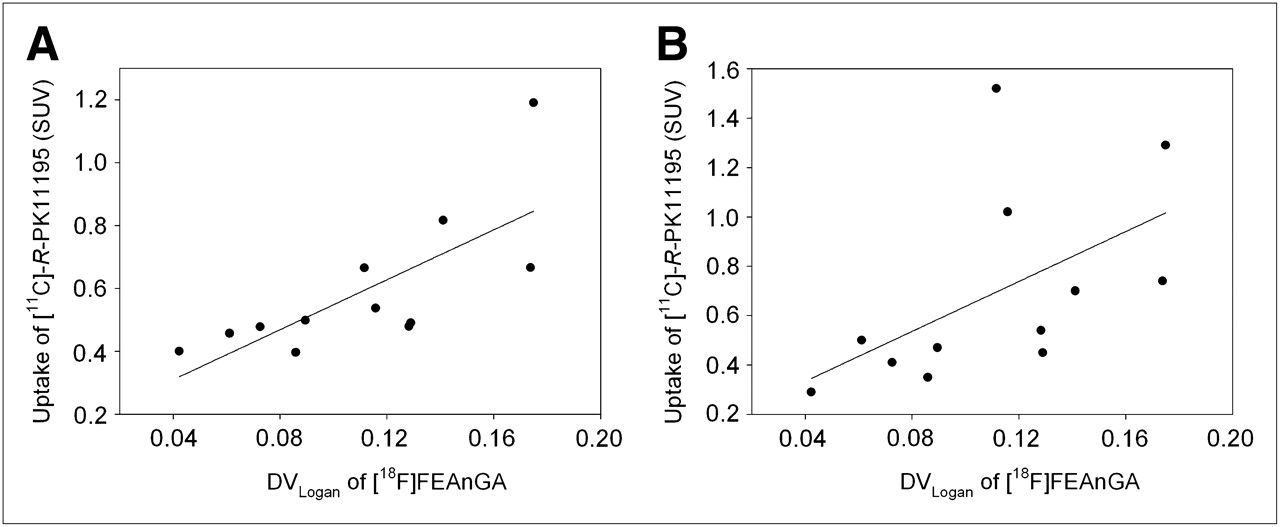
Correlation between DVLogan of 18F-FEAnGA in all brain regions of control and HSV-1–infected rats and uptake of 11C-(R)-PK11195 in same brain regions. (A) Correlation between DVLogan of 18F-FEAnGA 7 d after inoculation and 11C-(R)-PK11195 uptake 5 d after inoculation, in different brain regions (r2 = 0.54, P = 0.006). (B) Correlation between DVLogan of 18F-FEAnGA 7 d after inoculation and 11C-(R)-PK11195 uptake 7 d after inoculation, in different brain regions (r2 = 0.30, P = 0.07).
Since we anticipated that activation of microglia may precede the release of β-glucuronidase, an additional study was performed to evaluate the 11C-(R)-PK11195 in the same brain areas 5 d after HSV-1 inoculation. To quantify the uptake of 11C-(R)-PK11195, the standardized uptake value from the last 10 min of the PET scan was calculated from the examined brain areas (Table 2).
11C-(R)-PK11195 Brain Uptake in Control and HSV-1–Infected Rats 5 Days After HSV-1 Inoculation
The highest uptake of 11C-(R)-PK11195 was found in the bulbus olfactorius (P < 0.001), frontal cortex (P = 0.001), brainstem (P = 0.02), cerebellum (P = 0.16), and striatum (P = 0.013) in rats infected with HSV-1 (5 d after inoculation), when compared with control animals. These 11C-(R)-PK11195 uptake values are consistent with the 11C-(R)-PK11195 uptake values obtained in infected rats 7 d after inoculation, with the exception of the cerebellum and brainstem regions, where it was found to be 2 times lower in HSV-1 rats 5 d after inoculation than in the HSV-1–infected rats 7 d after inoculation. In addition, uptake of 11C-(R)-PK11195 in different brain areas 5 d after HSV-1 inoculation correlated better with the distribution volume of 18F-FEAnGA in the same brain regions (y = 3.97x +0.15, r2 = 0.54, P = 0.006).
DISCUSSION
The aim of this study was to explore whether 18F-FEAnGA PET could be a suitable method to detect β-glucuronidase in the HSV-1–infected brain. Such an imaging method could be used to gain more insight into neurodegenerative processes. β-glucuronidase is a lysosomal enzyme that is released in reactive astrocytes and microglia. β-glucuronidase is involved in the hydrolysis of glycosaminoglycans on the cell surface and the degradation of the extracellular matrix, and its activity may therefore give some indication of the degree of gliosis. In several neurologic diseases, there has been evidence of an increase in β-glucuronidase, which is associated with neuroinflammation and neurodegeneration. Extracellular β-glucuronidase expression is a downstream process from microglia activation and could be a target for imaging the process of neuroinflammation-mediated neurodegradation. Such a target may allow discrimination of whether neuroinflammation induces a neuroprotective or a neurodegenerative response. In addition, more insight in β-glucuronidase activity during neuroinflammation might give essential information regarding the mechanism involved in neuronal loss and, therefore, might provide a lead to an appropriate treatment for neurologic diseases associated with neurodegeneration. Previously, we have shown that extracellular β-glucuronidase could be monitored by 18F-FEAnGA PET in mice bearing genetically modified β-glucuronidase–expressing tumors (19). Furthermore, β-glucuronidase could also be monitored with 18F-FEAnGA PET in a normal necrotic tumor and in inflammation in rats (24).
In the present study, we aimed to investigate whether 18F-FEAnGA PET is also able to detect enhanced extracellular β-glucuronidase activity during neuroinflammation. To this purpose, we selected the HSV-1–induced encephalitis rat model. Most animal models of neuroinflammation are based on a direct injection of a toxic agent in the brain. This invasive technique induces not only neuroinflammation by the injected agent (viral, bacterial, cytostatic) but also would cause damage to the blood–brain barrier by the injection itself. The combination of these 2 effects would make it more difficult to discriminate whether the tracer uptake was specifically mediated by β-glucuronidase or was due to perfusion effects as a result of a leaky blood–brain barrier. Therefore, we have chosen a noninvasive method to induce neuroinflammation via intranasal inoculation of a virus without damaging the blood–brain barrier (absence of Evans blue staining, data not shown). The present PET study showed that 18F-FEAnGA uptake in the brain was low both in control and in infected animals. This low brain uptake can be attributed to the hydrophilic characteristics of the tracer, which hamper its penetration of the intact blood–brain barrier. Nevertheless, PET showed a significant enhancement of the distribution volume of the tracer in the brains of HSV-1–infected rats, compared with the brains of uninfected rats. Because of the hydrophilic character of 18F-FEAnGA, theoretically the increased tracer uptake in HSV-1–infected rats could be explained by inflammation–induced leakage of the blood–brain barrier, rather than increased β-glucuronidase activity. To prove that the increase of 18F-FEAnGA uptake is not due only to enhanced tissue perfusion, we quantified 18F-FEAnGA uptake in cerebellum and brainstem, where inflammation is expected to be most active (17,18,22) and therefore the highest increase in levels of extracellular β-glucuronidase will most likely be present. Analysis of the brain homogenates of HSV-1–infected rats revealed a 1.6 times higher amount of the spacer, HNBA, that was formed after hydrolysis of the tracer, when compared with brain homogenates of control rats. In addition, β-glucuronidase activity was 3.4 times higher in brain homogenates of infected rats than in controls. Moreover, the distribution volume in this brain region (cerebellum + brainstem) correlated well with the release of HNBA and β-glucuronidase activity. Thus, the distribution volume seems to reflect β-glucuronidase activity rather than increased blood–brain barrier permeability. Since metabolite analysis indicated that only 18F-FEAnGA was present in the plasma, we can attribute the presence of the spacer, HNBA, derived from the hydrolysis of the tracer, to the release of β-glucuronidase in the infected regions.
Interestingly, the distribution volume of 18F-FEAnGA (7 d after inoculation of HSV-1) tended to correlate with the uptake of 11C-(R)-PK11195 (PET tracer for imaging microglia activation) 5 d after inoculation of HSV-1 in the same brain areas. However, compared with 11C-(R)-PK11195 uptake in the same brain areas 7 d after inoculation of the HSV-1, the correlation was reduced mainly because of a much higher uptake of 11C-(R)-PK11195 in the brainstem and cerebellum than the distribution volume of 18F-FEAnGA in HSV-1–infected animals (7 d after inoculation of HSV-1). Although it would be tempting to suggest a temporal relationship between the activation of microglia and the release of β-glucuronidase, we found a confounding factor that precludes such a conclusion. Animals scanned with 18F-FEAnGA on day 7 or 8 had had relatively mild symptoms compared with animals scanned with 11C-(R)-PK11195 on the same day after infection, as the average symptom scores were 1.3 and 2.5, respectively. In fact, the infected animals scanned with 11C-(R)-PK11195 on day 5 had an average symptom score (1.4) that was more comparable to the animals scanned with 18F-FEAnGA. Thus, it seems more plausible that the better correlation of 18F-FEAnGA uptake on day 7 with the 11C-(R)-PK11195 uptake on day 5 rather than day 7 is due to the similarity in disease progression rather than a temporal relationship between microglia activation and β-glucuronidase release. To get a better understanding of the relationship between microglia activation and β-glucuronidase activity, a future study should be performed investigating both microglia activation and β-glucuronidase activity in the same animal in a longitudinal study.
CONCLUSION
Despite relatively low brain uptake, 18F-FEAnGA was able to detect an increased release of β-glucuronidase during neuroinflammation. Although with the present study we cannot conclude if the activation of microglia precedes the release of β-glucuronidase, we can conclude that the activation of microglia is accompanied by the release of β-glucuronidase in the regions where neuroinflammation is present. Further studies should be performed to reveal the exact role of the increased β-glucuronidase activity in neuroinflammatory and neurodegenerative disorders.
DISCLOSURE STATEMENT
The costs of publication of this article were defrayed in part by the payment of page charges. Therefore, and solely to indicate this fact, this article is hereby marked “advertisement” in accordance with 18 USC section 1734.
Acknowledgments
We thank Sietske Welling Wester and Björge Meijdam of the Department of Medical Microbiology of the University of Groningen, The Netherlands, for their help with the HSV-1. No potential conflict of interest relevant to this article was reported.
Footnotes
Published online Feb. 8, 2012.
- © 2012 by the Society of Nuclear Medicine, Inc.
REFERENCES
- Received for publication August 2, 2011.
- Accepted for publication November 18, 2011.


