


Abstract
Patients with obstructive hypertrophic cardiomyopathy (HCM) exhibit elevated left ventricular outflow tract gradients (LVOTGs) and appear to have a worse prognosis than those with nonobstructive HCM. The aim of this study was to evaluate whether patients with obstruction, compared with nonobstructive HCM, demonstrate significant differences in PET parameters of microvascular function. Methods: PET was performed in 33 symptomatic HCM patients at rest and during dipyridamole stress (peak) for the assessment of regional myocardial perfusion (rMP), left ventricular ejection fraction (LVEF), myocardial blood flow (MBF), and myocardial flow reserve (MFR). Myocardial wall thickness and LVOTG were measured with an echocardiogram. Patients were divided into the following 3 groups: nonobstructive (LVOTG < 30 mm Hg at rest and after provocation test with amyl nitrite), obstructive (LVOTG ≥ 30 mm Hg at rest and with provocation), and latent HCM (LVOTG < 30 at rest but ≥ 30 mm Hg with provocation). Results: Eleven patients were classified as nonobstructive (group 1), 12 as obstructive (group 2), and 10 as latent HCM (group 3). Except for age (42 ± 18 y for group 1, 58 ± 7 y for group 2, and 58 ± 12 y for group 3; P = 0.01), all 3 groups had similar baseline characteristics, including maximal wall thickness (2.3 ± 0.5 cm for group 1, 2.2 ± 0.4 cm for group 2, and 2.1 ± 0.7 cm for group 3; P = 0.7). During peak flow, most patients in groups 1 and 2, but fewer in group 3, exhibited rMP defects (73% for group 1, 100% for group 2, and 40% for group 3; P = 0.007) and a drop in LVEF (73% for group 1, 92% for group 2, and 50% for group 3; P = 0.09). Peak MBF (1.58 ± 0.49 mL/min/g for group 1, 1.72 ± 0.46 mL/min/g for group 2, and 1.97 ± 0.32 mL/min/g for group 3; P = 0.14) and MFR (1.62 ± 0.57 for group 1, 1.90 ± 0.31 for group 2, and 2.27 ± 0.51 for group 3; P = 0.01) were lower in the nonobstructive and higher in the latent HCM group. LVOTGs demonstrated no significant correlation with any flow dynamics. In a multivariate regression analysis, maximal wall thickness was the only significant predictor for reduced peak MBF (β = −0.45, P = 0.003) and MFR (β = −0.63, P = 0.0001). Conclusion: Maximal wall thickness was identified as the strongest predictor of impaired dipyridamole-induced hyperemia and flow reserve in our study, whereas outflow tract obstruction was not an independent determinant.
Hypertrophic cardiomyopathy (HCM) is a complex genetic cardiac disorder characterized by a heterogeneous clinical expression, affecting patients of all ages, and diverse clinical course, in which some individuals remain asymptomatic throughout life whereas others develop symptoms of angina, heart failure, or syncope and a minority may experience sudden cardiac death (1).
Hypertrophic obstructive cardiomyopathy (HOCM) refers to the presence of a dynamic left ventricular outflow tract (LVOT) obstruction usually caused by systolic anterior motion of the anterior mitral valve leaflets and projection of the hypertrophied interventricular septum into the outflow tract in systole, leading to the creation of a gradient between the left ventricular (LV) cavity and aorta. Patients with HOCM usually exhibit an LVOT gradient (LVOTG) exceeding 30 mm Hg at baseline or on provocation. Evidence suggests that HOCM individuals appear to carry a higher risk for HCM-related death, progression to New York Heart Association class III or IV heart failure, and death from heart failure or stroke than do the individuals with the nonobstructive HCM type (2).
Microvascular dysfunction is a well-recognized feature of HCM subjects, oftentimes leading to significant and disabling symptoms. In the absence of obstructive epicardial coronary artery disease (CAD), failure to adequately increase myocardial flow (from baseline) during dipyridamole infusion using PET techniques is considered indirect evidence of microvascular dysfunction. There are data indicating that a depressed myocardial blood flow (MBF) response to dipyridamole-induced hyperemia (peak MBF), and thereby low myocardial flow reserve (MFR), is an independent predictor of clinical deterioration and cardiovascular disease–related death in HCM patients (3,4). It has been hypothesized in the past that elevated LVOTGs may lead to increased myocardial wall stress, ischemia, and ultimately necrosis and replacement fibrosis. Nevertheless, the association of LVOTGs, myocardial ischemia, and MFR is not well understood. The aim of the present study was to evaluate whether symptomatic patients with HOCM (LVOTG ≥ 30 mm Hg) at baseline or on provocation, compared with individuals with nonobstructive HCM (LVOTG < 30 mm Hg), demonstrate significant differences in regional myocardial perfusion or absolute flow quantification as assessed by PET. As a second objective, we evaluated the most important predictors for reduced peak MBF and MFR in our HCM cohort.
MATERIALS AND METHODS
Patients and Study Design
The study group consisted of individuals with a history of HCM diagnosed by echocardiography. Subjects with evidence of obstructive epicardial CAD (luminal stenosis ≥ 50%) on recent coronary arteriography were excluded from the study. All patients were symptomatic (including chest pain, dyspnea, or presyncope or syncope episodes) and were referred for cardiac PET/CT for evaluation of regional ischemia and absolute flow quantification.
Echocardiography Measurements
The diagnosis of HCM was based on echocardiography criteria by demonstrating LV hypertrophy with a wall thickness of at least 15 mm, in the absence of another cardiac or systemic disease capable of producing a similar degree of hypertrophy (1). Left ventricular ejection fraction (LVEF) was calculated using the biplane Simpson method, and maximal wall thickness was assessed using previously described criteria (5). LVOTGs were identified by Doppler echocardiography under basal conditions and after amyl nitrite (inhaled) challenge to elicit latent obstruction. A peak LVOTG of 30 mm Hg or more was considered obstructive. HCM patients were divided into 3 subgroups based on LVOTGs: nonobstructive HCM (LVOTG < 30 mm Hg at baseline and on provocation), obstructive HCM (LVOTG ≥ 30 mm Hg under basal and provoked conditions), and latent HCM (LVOTG < 30 at baseline, but ≥ 30 mm Hg on provocation).
PET Acquisition Protocol
All patients were imaged using a Discovery VCT PET/CT system (GE Healthcare) equipped with an integrated lutetium yttrium orthosilicate crystal PET component and a 64-slice CT component. Individuals were positioned with the help of a CT topogram, and a low-dose CT scan (120 kV, 40 mA) was obtained for attenuation correction of PET emission data. Then, myocardial perfusion and absolute flow were assessed using the following same-day rest–stress protocol. For rest acquisition, 13N-NH3 (∼370 MBq [10 mCi]) was infused intravenously as a slow bolus over 10 s, and a 2-dimensional list-mode PET scan was obtained over 20 min. For stress acquisition, dipyridamole (0.56 mg/kg) was administered over a period of 4 min. A second dose of 13N-NH3 (∼370 MBq [10 mCi]) was infused 4 min after the end dipyridamole infusion, followed by a second 20-min 2-dimensional list-mode acquisition. The rest and stress PET datasets were checked for accurate alignment with the low-dose CT scan, and software-based realignment was performed if necessary. List-mode data were resampled to static (4-min prescan delay), gated (8 bins per cardiac cycle), and 36-frame-dynamic images (20 × 6, 5 × 12, 4 × 30, 5 × 60, and 2 × 300 s). Heart rate (HR) and blood pressure (BP) were recorded before and during dipyridamole infusion. The rate–pressure product (RPP = baseline HR × systolic BP [SBP]) was calculated to correct baseline MBF and MFR for possible hemodynamic confounders (6).
Data Analysis
Electrocardiogram-Gated and Nongated Myocardial Perfusion Imaging (MPI)
Attenuation-corrected PET images were reconstructed by an iterative algorithm with postprocessing filtering. The CardIQ Physio package (GE Healthcare) was used for analysis of both electrocardiogram gating and nongating static datasets, including oblique reorientation on the transversal planes, definition of the valve plane, quality control of automated contour detection, and software-derived calculation of the LVEF (electrocardiogram gating) and transient ischemic dilatation (TID) index (nongating) from the rest and stress datasets. A TID index greater than 1.3 was considered abnormal on the basis of previous experience with 82Rb PET/CT (7).
Regional MPI was semiquantitatively assessed from the reoriented images on different cardiac planes (short axis, horizontal long axis, and vertical long axis) using the standard American Heart Association 17-segment method, with which each individual LV segment is evaluated independently using a 5-point visual score based on the level of tracer activity (normal perfusion, 0; mildly decreased perfusion, 1; moderately decreased perfusion, 2; severely abnormal perfusion, 3; and absence of perfusion, 4). The summed stress score and summed rest score consisted of the summation score of the 17 LV segments during vasodilator stress and rest perfusion imaging, respectively. The presence of abnormal perfusion was defined by the summed difference score (SDS), derived as the difference between summed stress score and summed rest score. An SDS equal to or greater than 2 was considered abnormal in this study.
Absolute MBF
To extract the spatial distribution of the tracer uptake in the left ventricle, volumetric sampling of the myocardial tracer activity was performed by manual definition of the long heart axis, followed by software computation and display of the myocardial activity as a static polar map (basically a 3D representation of the myocardial tracer distribution). Subsequently, the static polar map–defined segments were reapplied to dynamic imaging series to create quantitative polar maps and, therefore, myocardial time–activity curves. A small region of interest was positioned in the LV cavity to obtain the arterial input function. Using these data, we calculated MBF by fitting the arterial input function and myocardial time–activity curve from the dynamic polar maps to a well-established 3 compartment tracer kinetic model as previously described in detail (8). This model includes corrections for potential underestimation of tissue activity due to partial-volume effect and spillover activity from the LV and right ventricular cavities into the myocardial wall (9). Global MBF of the left ventricle during vasodilator stress and rest was measured in mL/min/g. MFR was expressed as the ratio of stress to rest MBF. Subsequently, resting MBF (but not peak MBF because this has been shown to be independent of RPP) and MFR were corrected or normalized for differences in baseline hemodynamics in the study group using the following equations (10):
Statistical Analysis
Statistical analyses were performed using SPSS software (version 18.0; SPSS Inc.). Continuous variables are presented as mean ± SD. An independent-measures t test and Mann–Whitney U test were used to assess differences between parametric and nonparametric subgroups of individuals, respectively. One-way, factorial ANOVA combined with a Scheffé test for post hoc analysis and correction for multiple comparisons was performed to compare means of more than 2 subgroups. Categoric variables were compared between groups using χ2 tests and are presented as percentages. Pearson correlation coefficients were calculated for potential correlation evaluations. Multiple stepwise regression analysis (with stepping method criteria of probability of F to enter 0.05 and to remove 0.10) was used to determine predictors as appropriate. A P value less than 0.05 was considered statistically significant.
RESULTS
Baseline Characteristics
Thirty-three patients were included, 12 of whom had evidence of obstructive HCM and 10 of latent HCM. The remaining 11 patients were considered to have nonobstructive HCM. In general, HOCM patients were older and most likely to complain of dyspnea; otherwise, all 3 groups had similar baseline characteristics, as depicted in Table 1.
Patient Characteristics of Study Groups
Hemodynamics and Standard PET Parameters
BP and, thereby, RPP were higher in HOCM patients, but the difference did not reach statistical significance. Remaining hemodynamic variables were comparable among groups (Table 2).
Baseline and Dipyridamole-Induced Hemodynamic Changes of Study Groups
At baseline, PET-derived LVEF was within reference limits in the study population, yet with trends for lower values in the nonobstructive group. During vasodilator stress, most patients exhibited a drop in LVEF, regional myocardial perfusion defects, and abnormal TID index in the nonobstructive and obstructive HCM groups (Table 3; Fig. 1). However, patients with latent HCM showed a significantly lower number of abnormal MPI scans and those with obstructive HCM a higher proportion of abnormal TID index than did the other 2 subgroups.
Baseline and Dipyridamole-Induced PET Parameters of Study Group
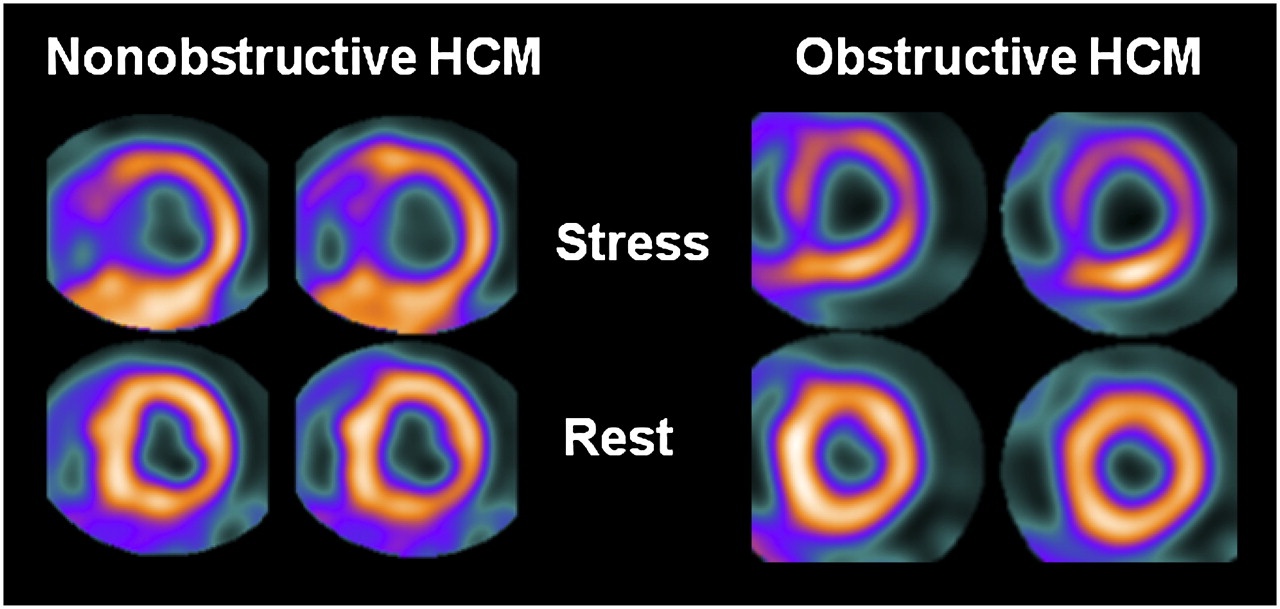
Short-axis representative PET images of 2 HCM individuals, one with normal LVOTGs (5 and 12 mm Hg) and another with elevated gradients (97 and 135 mm Hg at rest and provocation, respectively). Both patients demonstrate PET evidence of dipyridamole-induced myocardial ischemia and LV cavity dilatation.
Absolute Flow Assessment, Correlations, and Predictors
At rest, MBF was somewhat higher in nonobstructive HCM than in HOCM individuals. Similarly, during vasodilator stress, peak MBF and MFR were lower in the nonobstructive group and higher in latent HCM individuals, as depicted in Figure 2.
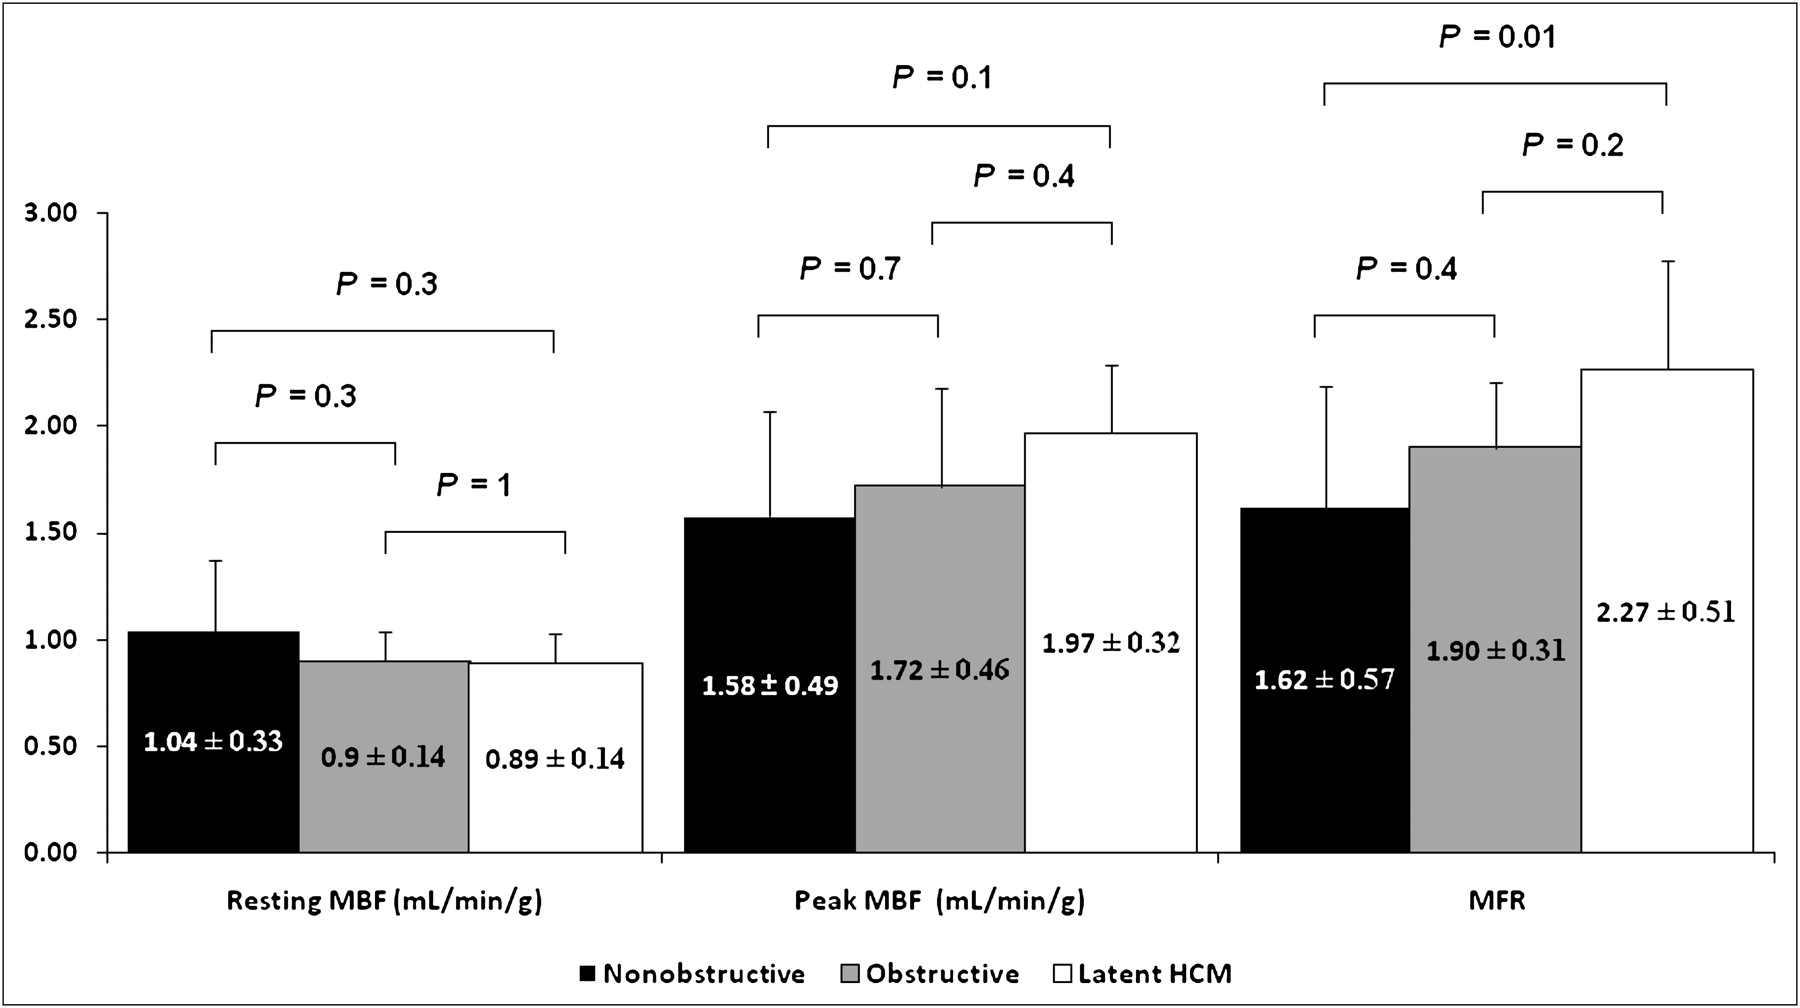
Absolute global myocardial flow assessment in patients with nonobstructive, obstructive, and latent HCM.
Table 4 shows several univariate correlations for both peak MBF and MFR within the study population (including all 33 patients). Only maximal wall thickness and HR response to dipyridamole were important negative and positive predictors, respectively, for change in peak MBF in a multivariate regression model (Table 5). Similarly, maximal wall thickness was the only significant predictor (negative) for a change in MFR (Table 5). The important correlation between peak MBF and MFR with maximal wall thickness is further illustrated in Figure 3.
Univariate Correlations for Peak MBF and MFR
Multivariate Regression Model to Predict Changes in Peak MBF and MFR

Correlation between peak MBF and MFR with maximal wall thickness in individuals with HCM.
DISCUSSION
In the present study, we found no significant correlations between LVOTGs and global parameters of ischemia, such as SDS, peak MBF, and MFR on PET, when comparing symptomatic patients with obstructive and nonobstructive HCM. In fact, peak MBF and MFR were lower in the nonobstructive group and higher in the latent HCM group, implying independence between myocardial flow and LVOTGs. Interestingly, obstructive gradients appear to be primarily related to or dependent on morphologic and dynamic changes of the mitral valve either at rest or on provocation, because of excessive leaflet tissue, chordal abnormalities, and anterior displacement of the mitral apparatus against the hypertrophied septum during systole (11–13). Thus, it should not be surprising that the myopathic process (both at the macro level and at the arteriolar luminal level) and the presence of obstructive gradients are not related.
Microvascular disease in HCM seems to be the result of structural changes in small vessels characterized, at least in part, by luminal narrowing of the intramural microvascular network caused by hyperplasia and hypertrophy of the intima and media (14,15). In this regard, Maron et al., in an ex vivo study, found no statistically significant relation between the presence, absence, or magnitude of LVOT obstruction (measured by cardiac catheterization) and small artery abnormalities in 32 autopsied hearts of HCM individuals, although small-vessel disease findings in intramural coronary artery tissue sections in nonobstructive HCM tended to exceed that in patients with HOCM (15).
A few studies have looked at this relation in vivo in the past but had conflicting results (3,16–18). In agreement with our findings, Cecchi et al. (3), using 13N-NH3, followed 51 HCM subjects with a baseline mean peak MBF (1.50 ± 0.69 mL/min/g) and MFR (1.84 ± 0.67) comparable to our study results (1.79 ± 0.43 mL/min/g and 1.95 ± 0.50, respectively) and found no significant difference in peak MBF between patients with LVOT obstruction (n = 8/51, peak LVOTG ≥ 30 mm Hg) and those without obstruction (n = 43/51). In contrast, Knaapen et al. (16) evaluated 18 symptomatic HCM patients (12 of them with peak LVOTG > 30 mm Hg) and reported a significant negative correlation between LVOTG and peak MBF (r = −0.74, P < 0.001) and MFR (r = −0.76, P < 0.001) measured by 15O-labeled water (H215O) PET. The mean MFR was significantly higher in that study (2.66 ± 1.32) than that in ours, likely caused by a less advanced stage of disease in the study population of Knaapen et al. Likewise, Soliman et al. (18) assessed 14 symptomatic HCM patients, all with a peak LVOTG greater than 50 mm Hg, and found an inverse correlation between LVOTG and peak MBF (r2 = 0.49, P < 0.01), estimated by both adenosine myocardial contrast echocardiography and H215O PET. In this study, MBF was corrected by LV RPP ([LVOTG + SBP] × HR), which introduces LVOTGs into the standard RPP formula (SBP × HR). Again, mean MFR derived by myocardial contrast echocardiography (2.80 ± 0.17) and PET (2.67 ± 0.70) were significantly higher in that cohort.
In our study, most patients (72%) showed evidence of reversible defects (SDS ≥ 2) on MPI, with a similar degree of ischemia in individuals with obstructive and nonobstructive HCM, although abnormal MPI was less common in the latent HCM group (Table 3). In accordance with this finding, Cannon et al. (19) compared HCM patients showing evidence of reversible perfusion defects (n = 37/50) with those showing absence of perfusion abnormalities (n = 13/50) on 201Tl SPECT and found that mean LVOTG was similar regardless of the presence of abnormal MPI on SPECT (108 ± 48 vs. 85 ± 48 mm Hg, respectively, P = not significant) (19).
In addition to abnormal MPI, we found a high prevalence of abnormal TID index (55%) and blunted LVEF reserve (72%) in HCM patients—a finding that has partly been explained by ischemia according to prior studies using other imaging modalities (20–22). These parameters were similarly impaired in patients with obstructive and nonobstructive HCM but less pronounced in those with latent HCM, suggesting perhaps less advanced disease in this latter group.
In any event, our findings indicate that LVOTGs possess no significant influence on peak MBF and MFR as measured by PET and generate the question of whether relief of LVOT obstruction with surgical myectomy or alcohol septal ablation may have any significant impact on myocardial flow in HOCM individuals. In this respect, Timmer et al. reported an improvement (compared with baseline) of peak MBF (2.25 ± 0.91 vs. 2.94 ± 1.18 mL/min/g; P = 0.013) and MFR (2.55 ± 1.23 vs. 3.05 ± 1.24; P = 0.05) using adenosine H215O PET in 15 patients with elevated LVOTG (≥50 mm Hg) 6 mo after alcohol septal ablation (23). The authors concluded that microvascular dysfunction in HOCM is at least partially reversible by relief of LVOT obstruction after alcohol septal ablation. However, similar to previous conflicting studies, the reported mean myocardial flow values in the study by Timmer et al. (23) were significantly higher than those in our study, they were obtained from a smaller group of patients (n = 15), mean peak LVOTG change before and after alcohol septal ablation was minimal (41 ± 32 vs. 23 ± 19; P = 0.04), and the results indicate that those patients with lower peak MBF at baseline appeared to have the least change in flow, compared with those individuals with higher baseline peak flows (23).
On the other hand, we found that myocardial wall thickness was the strongest predictor for reduced global peak MBF and MFR. In our HCM cohort model, peak MBF and MFR decreased by 0.037 and 0.058 mL/min/g, respectively, for every millimeter increase of the maximal wall thickness over 2.2 cm (mean maximal wall thickness of the study group). Similar observations have been previously described by other authors (16,18,24). Kaapen et al. found that LV mass index (r = −0.62, P = 0.006; β = −0.42, P = 0.008) and terminal probrain natriuretic peptide (r = −0.79, P < 0.001; β = −0.64, P < 0.001), a blood marker of LV wall stress, were the strongest predictors for reduced peak MBF measured using H215O PET. They also observed that peak MBF decreased in proportion to the increase in end-diastolic wall thickness (16). Likewise, Petersen et al. demonstrated that peak MBF decreased by 0.011 mL/min/g (SE, 0.0035) for each millimeter increase of end-diastolic wall thickness (P < 0.005) (24). Morphologic studies have also yielded similar results ex vivo. Tanaka et al. demonstrated in autopsied hearts of individuals with HCM and hypertensive cardiomyopathy that the percentage of luminal narrowing of intramyocardial small artery in the left ventricle was inversely correlated with heart weight (r = −0.59, P < 0.001) and size of myocytes in both septum and free wall (r = −0.66 and −0.63, P < 0.001, respectively) (14). Similarly, Varnava et al. found a significant, although weak, correlation between small-vessel disease and heart weight (r = 0.3, P = 0.01) and maximum LV wall thickness (r = 0.3, P = 0.03) in HCM hearts (25). In addition, Krams et al. reported an important inverse correlation between degree of hypertrophy and normalized arteriolar lumen (r = 0.71; P < 0.05) and capillary density (r = 0.53; P < 0.05) in myectomy specimens in HCM patients (26). These in vivo and ex vivo studies underscore the likely association between maximal wall thickness and microvascular disease in HCM.
Nonetheless, it is also important to emphasize that even though wall thickness was the strongest predictor for change in myocardial flow in our study, by no means can it solely explain the important flow differences seen among the 3 groups in our cohort. Hypertension, diabetes, dyslipidemia, and age are all factors that may potentially affect (negatively) myocardial flow according to the literature (6,27–30). In this regard, patients in the nonobstructive group exhibited lower values of peak MBF and MFR, but paradoxically they were significantly younger and tended to have a lower proportion of cardiovascular risk factors than did the patients with obstructive and latent HCM. Similarly, we included 7 patients (21%) who had nonobstructive CAD, defined as a luminal narrowing of less than 50% in the coronary vessels on invasive angiography. Studies have shown that these vascular territories exhibit levels of MFR nearly similar to those of healthy volunteers (31,32). Therefore, there seem to be additional determinants of myocardial flow in these HCM patients. Interestingly, Olivotto et al. (33) recently reported that patients with sarcomere myofilament mutations demonstrate a significantly lower peak MBF (measured by ammonia PET) than do genotype-negative individuals (1.7 ± 0.6 mL/min/g vs. 2.4 ± 1.2 mL/min/g; P < 0.02) with otherwise similar baseline characteristics, including age, LVEF, maximal wall thickness, and LVOTGs, highlighting the multifactorial nature of HCM in the development of microvascular disease.
Finally, HR response during dipyridamole infusion was also an important predictor for peak MBF increase (but not for MFR) in HCM patients. This observation, to the best of our knowledge, has not been previously reported in the HCM literature and may be related to concomitant autonomic dysfunction, as suggested by other authors (34–36). Additional studies will be required to confirm this finding.
There are some limitations of the study that deserve consideration. First, this was a retrospective study and suffered from all the limitations of similar studies. Moreover, the findings are limited by the relatively small number of patients, recruited from a single center, and therefore it is possible that some of the trends observed in this study may become significant when evaluating a larger number of individuals. Nevertheless, this is a limitation shared by most PET studies in this special population, given that PET is a costly test not routinely performed in HCM patients, thus significantly limiting its accessibility for clinical purposes.
In addition, there were significant differences in the number of patients and age between nonobstructive and obstructive HCM groups in our study. Nevertheless, these differences are in accordance with published data showing that HCM is predominantly a disease of LVOT obstruction, in which approximately 30%, 37%, and 33% of patients fall within the nonobstructive, obstructive, and latent HMC categories, respectively, and in which patients with nonobstructive HCM are also usually younger, similar to our results (37).
These findings should therefore be considered preliminary and need to be confirmed in larger studies.
CONCLUSION
We found no significant correlation between LVOTGs and MBF, suggesting a lack of interdependency of these 2 prognostically useful markers. Maximal wall thickness was identified as the strongest predictor of impaired peak MBF and MFR in our study.
DISCLOSURE STATEMENT
The costs of publication of this article were defrayed in part by the payment of page charges. Therefore, and solely to indicate this fact, this article is hereby marked “advertisement” in accordance with 18 USC section 1734.
Acknowledgments
No potential conflict of interest relevant to this article was reported.
Footnotes
Published online Feb. 7, 2012.
- © 2012 by the Society of Nuclear Medicine, Inc.
REFERENCES
- Received for publication July 25, 2011.
- Accepted for publication October 25, 2011.


