


Abstract
The putative presence of the erythropoietin receptor (EpoR) on human cancer cells has given rise to controversial discussion about the use of recombinant human erythropoietin (rhuEpo) for treatment of patients with chemotherapy-induced anemia. In vivo analysis of the EpoR status in tumors could help in elucidating the role of erythropoietin in cancer. Thus, the aim of this study was to develop a targeted EpoR probe for the investigation of EpoR expression in human lung cancer xenografts by fluorescence-mediated tomography. Methods: Epo-Cy5.5 was generated by coupling Cy5.5 to rhuEpo. In vitro binding assays were performed using the EpoR-positive non–small cell lung cancer (NSCLC) cell lines A549 (lower EpoR expression) and H838 (higher EpoR expression), the EpoR-negative cell line H2030, and EpoR/EGFP-overexpressing HeLa cells. In vivo specificity of Epo-Cy5.5 was confirmed by competition analyses using micro-CT/fluorescence-mediated tomography fusion imaging. Biodistribution was analyzed over 50 h after injection. Binding of Epo-Cy5.5 was validated on tumor cryosections. Results: After intravenous injection, the probe was rapidly cleared from the circulation. An accumulation was observed in liver and kidneys, with a maximum at 7 h after injection followed by a decline, indicating renal excretion. Almost constant accumulation of Epo-Cy5.5 was found in bone marrow and tumors, indicating specific receptor binding. The probe allowed the discrimination between H838 with higher EpoR expression (89.54 ± 15.91 nM at 25 h) and A549 tumors with lower EpoR expression (60.45 ± 14.59 nM at 25 h, P < 0.05). Tumor accumulation of Epo-Cy5.5 could be significantly reduced by adding unlabeled rhuEpo (P < 0.05 at 4, 7, and 24 h). In vitro validation confirmed specific binding of Epo-Cy5.5 to the tumor cells, and this binding correlated with the EpoR expression level. Binding was also observed on endothelial cells. Vessel density and Epo-Cy5.5 binding on endothelial cells were comparable. Conclusion: Epo-Cy5.5 allows the longitudinal analysis of EpoR expression in tumors and thereby can investigate the influence of erythropoietin on EpoR expression, tumor growth, and angiogenesis.
Lung cancer is the most common cause of cancer-related death worldwide, with an overall 5-y survival rate of below 15% after diagnosis (1–3). The most frequent form of lung cancer is non–small cell lung cancer (NSCLC) (4). Lung cancer patients are treated with chemotherapy based on platin derivatives, causing both renal and bone marrow damage (5,6). This leads to severe forms of anemia, resulting from both impairment of erythropoietin production and reduction in the number of hematopoietic stem cells, the precursors of erythroid progenitor cells and erythrocytes in the bone marrow (7). Erythropoietin is the main stimulator of erythropoiesis by promoting cell growth, survival, and differentiation of erythroid progenitor cells (8). The endogenous, mainly renal, production of erythropoietin is inversely related to blood oxygen level (9). Once erythropoietin binds to the erythropoietin receptor (EpoR) on the cell surface of erythroid progenitor cells, intracellular signal cascades become activated. The erythropoietin–EpoR complex is rapidly internalized and is either degraded or shuttled back to the plasma membrane, representing the specific receptor turnover (10).
Because of its erythropoietic potential, recombinant human erythropoietin (rhuEpo) is commonly used for anemia treatment, not only in patients with kidney insufficiency but also in cancer patients with chemotherapy-associated anemia (11).
The discovery of EpoR transcripts in tumor sections, in cancer cell lines, and on human microvascular endothelial cells has led to controversial discussions about the use of rhuEpo for treatment of cancer-associated anemia (12,13). The presence of active EpoR in tumor tissues might promote cancer growth and thus have a negative clinical outcome in patients (14,15). This hypothesis is underlined by clinical trials demonstrating worse survival rates in rhuEpo-treated lung cancer patients than in control patients (16,17), depending on the treatment schedule (18). Further studies were initiated to elucidate the link between rhuEpo treatment and cancer growth but have not provided clear evidence so far. Drawbacks include the lack of selective and sensitive antibodies for EpoR and thus inadequate histologic techniques for identifying the EpoR status of tumor cells and tissues (19), strongly encouraging the use of alternative approaches for monitoring and targeting EpoR, such as the development of target-specific imaging probes (20,21). In this study, we describe the generation of a near-infrared EpoR probe (Epo-Cy5.5) for fluorescence-mediated tomography (FMT) and its specific use for in vivo imaging of the EpoR status in 2 subcutaneous NSCLC xenografts in mice.
We demonstrated specific binding of Epo-Cy5.5 to the tumor cells in vitro and to the subcutaneous tumors in vivo. Biodistribution analyses revealed high probe concentrations in liver and kidneys, followed by a decline after 7 h. The high long-term accumulation in bone marrow and tumor tissue corresponded to the high EpoR expression level in both organs. In addition, the probe accumulation reflected the EpoR expression level of the tumor, as was obvious from the stronger enrichment in H838 tumors with higher EpoR expression than in A549 tumors with lower EpoR expression. Immunohistologic analysis demonstrated binding of Epo-Cy5.5 to tumor cells that correlated with their EpoR expression level and a weak binding on muscle and tumor endothelial cells.
MATERIALS AND METHODS
Epo-Cy5.5 Synthesis
Epo-Cy5.5 was generated by coupling Cy5.5 monoreactive hydrazide (GE Healthcare) to free carbonyl groups of the periodate-oxidized carbohydrate side chains of rhuEpo (epoetin β) according to the manufacturer's instructions. This procedure increased the molecular weight of rhuEpo (30 kDa) by about 1 kDa (Cy5.5 plus hydrazine bond: ∼1,045.1 Da). The near-infrared dye Cy5.5 allows in vivo detection of the probe by FMT. The bioactivity of Epo-Cy5.5 was tested by a proliferation assay as previously described (22), to ensure receptor binding capability. In brief, UT-7 cells seeded at 1 × 10⁴ cells per well (96-well plate) in RPMI 1640 (PAN Biotech GmbH) and 10% fetal calf serum enriched with 1% minimum essential medium nonessential amino acids (Gibco), 1% sodium pyruvat (Gibco), and 1% l-glutamine (Sigma) were incubated with rhuEpo or Epo-Cy5.5 using serial dilutions starting with 1,000 pM for 120 h. Proliferation was determined using a water-soluble tetrazolium salt proliferation assay (WST-1; Roche Applied Science) following the manufacturer's instructions.
Quantitative Real-Time Polymerase Chain Reaction (RT-PCR)
Expression of EpoR messenger RNA in human NSCLC cell lines H838, A549, and H2030 was analyzed by quantitative RT-PCR. HeLa cells were used as a negative control, and EpoR-overexpressing HeLa cells (Doleschel et al., unpublished data, 2011) as a positive control. Total RNA from 3 × 10⁶ lung cancer cells was isolated using the RNeasy Mini Plus Kit (Qiagen) according to the manufacturer's instructions. For quantitative RT-PCR, complementary DNA was generated with the QuantiTect Reverse Transcription Kit (Qiagen) and analyzed using the LightCycler 480 with the Universal ProbeLibrary platform (Roche Applied Science). Crossing point values were calculated using the second-derivative-maximum method of the LightCycler 480 Basic Software (Roche Applied Science). Quantitative RT-PCR efficiency correction was performed for each setup individually. Concentrations were normalized using hypoxanthine-guanine phosphoribosyltransferase (HPRT) as a reference gene. Fold-changed EpoR expression levels relative to the positive cell line H838 were calculated. The Universal ProbeLibrary probes and primer sequences were as follows: EpoR_for 5′-ttggaggacttggtgtgtttc-3′, EpoR_rev 5′-agcttccat-ggctcatcct-3′, probe#69 5′-ggaggaag-3′, HPRT_for 5′-tgaccttgatttattttgcatacc-3′, HPRT_rev 5′-cgagcaagacgttcagtcct-3′, probe#73 5′-gctgagga-3′.
Quantitative Immunoblotting
EpoR proteins in the NSCLC cell lines H838 and A549 were quantified by immunoblotting. NSCLC cells were lysed in 1× lysis buffer (1% NP40; 150 mM NaCl; 20 mM Tris-HCl, pH 7.4; 10 mM NaF; 0.5 mM ethylenediamine tetraacetic acid, pH 8.0; 1 mM ZnCl2, pH 4.0; 0.5 mM MgCl2; 1 mM Na3VO4; 10% glycerol; 1 μg/mL aprotinin; and 100 μg/mL 4-(2-aminoethyl)-benzolsulfonylfluoride hydrochloride). Immunoprecipitation was performed with EpoR antibody (M-20; Santa Cruz Biotechnology), protein A sepharose (GE Healthcare), and the corresponding calibrator protein GST-EpoR (23). Different dilutions of the recombinant calibrator GST-EpoR were used for EpoR protein quantification. Immunoblots were incubated with anti-EpoR (C-20) and developed using ECL Advanced Western Blotting Detection Reagents (GE Healthcare) and subsequently detected on a Lumi-Imager F1 (Roche Applied Science). Quantification was performed using the LumiAnalyst 3.1 software (Roche Applied Science). Samples were run in triplicate.
Tumor Cell Lines and Cell Culture
The NSCLC cell lines H838, A549, and H2030 were derived from ATCC; UT-7, a human acute myeloid leukemia cell line (22), was from DSMZ. The generation of stably EpoR/enhanced green fluorescent protein (EGFP)-transfected HeLa cells will be described elsewhere. H838, H2030, and EpoR/EGFP-transfected HeLa cells were cultured in RPMI 1640 medium (Invitrogen) with 1% penicillin–streptomycin and 10% fetal calf serum, for EpoR/EGFP-transfected HeLa cells supplemented by 2 mM glutamine, 1 mM sodium-pyruvate, 1× nonessential amino acids, and Zeocin (0.4 mg/mL, all Invitrogen). A549 cells were cultivated in Dulbecco modified Eagle medium, 1% penicillin–streptomycin, and 10% fetal calf serum (all Invitrogen). EpoR/EGFP-transfected HeLa cells overexpress a fusion protein of the EpoR and EGFP with a functional Epo binding site.
In Vitro Binding of Epo-Cy5.5
Binding specificity of Epo-Cy5.5 was tested in vitro using the following NSCLC cell lines: A549 and H838 (EpoR-positive), and H2030 (EpoR-negative). EpoR/EGFP-transfected HeLa cells that overexpress EpoR/EGFP were used as a control. For binding analysis, NSCLC cells were incubated with Epo-Cy5.5 (1 h, 37°C, 10 nM). Binding specificity was tested by in vitro competition analyses. EpoR/EGFP-transfected HeLa cells were incubated with a 1:20 mixture of Epo-Cy5.5 (10 nM) and unlabeled rhuEpo (190 nM) (epoetin β) (1 h, 37°C). Microscopic analysis of bound Epo-Cy5.5 was performed using the Axio Imager M2 equipped with appropriate detection filters (4′,6-diamidino-2-phenylindole [DAPI; Invitrogen], EGFP, Cy 3, and Cy 5.5 [Carl Zeiss, MicroImaging GmbH]). Signal intensities were determined using the AxioVision software (Carl Zeiss, MicroImaging GmbH). For comparative analyses, images were acquired with the same exposure time.
Tumor Inoculation and Analysis of Epo-Cy5.5 Specificity In Vivo
Mouse NSCLC xenografts were generated by subcutaneous injection of 5 × 10⁶ H838 cells in 100 μL of Matrigel (phenol-free, growth factor–reduced; BD Biosciences) and 3 × 10⁶ A549 cells in 100 μL of culture medium into the right flank of female CD-1 nude mice (Charles River). Sixteen mice were used for the analysis. Tumor-bearing mice were given a chlorophyll-free diet starting 4 d before injection of Epo-Cy5.5 (24). The specificity of Epo-Cy5.5 was analyzed in vivo by competition analysis using 8 animals per tumor cell line. Animals were divided randomly into a control group (n = 4) and a competition group (n = 4). Epo-Cy5.5 was injected via a tail vein catheter (10 μM diluted in 0.9% NaCl) in a total volume of 100 μL. Animals of the control group received Epo-Cy5.5 alone (10 μM), whereas for competition, a 1:5 mixture of Epo-Cy5.5 (10 μM) with unlabeled rhuEpo (40 μM) was injected.
Imaging Protocols
FMT
Organ distribution and tumor accumulation of Epo-Cy5.5 were analyzed longitudinally 0.5, 3, 5, 7, 23, 30, 48, and 50 h after probe injection using a wave-type specific scanner for transillumination, reflectance, and absorption (FMT2500; PerkinElmer) (25). The mice were anesthetized with isoflurane during imaging and fixed at a definite position in a 2-modality animal bed (CT Imaging GmbH).
Micro-CT and Data Reconstruction
For organ localization, micro-CT was performed directly before the FMT measurement using a dual-energy micro-CT system (Tomoscope Duo CT; CT Imaging GmbH). The mice were kept anesthetized and fixed in the same animal bed for both micro-CT and FMT. The following scan protocol was used: Both tubes were run at 65 kV and 0.38 mA. Each flat panel detector acquired 720 projections in the binned mode at 25 frames per second, containing 516 × 506 pixels with a pixel size of 100 μm. A full rotation with a total scan time of 29 s was performed. A Feldkamp algorithm was used for image reconstruction, with isotropic voxels of 70 μm and a sharp reconstruction kernel (T60).
Quantitative 3-dimensional FMT data and volumetric micro-CT data were coregistered and fused using AMIDE (freely available software provided by sourceforge.net). Epo-Cy5.5 concentrations in the organs and tumors were determined using AMIDE after regions of interest based on the anatomic micro-CT information had been set. The blood levels of Epo-Cy5.5 were determined by measuring the concentrations in the left heart chamber at the respective time points.
Indirect Immunofluorescence
Tumors were resected, frozen in liquid nitrogen vapor, and cut into 7- to 10-μm slices. For EpoR staining, tissue sections were incubated with Epo-Cy5.5 (10 nM, 2 h at room temperature) before fixation. Fixation of the cryosections and the staining procedure were performed as previously described (26). Primary antibodies against CD31 (mCD31 rat; BD Biosciences), as well as corresponding secondary antibodies, were used as previously described (26). Cell nuclei were counterstained by 4′,6-diamidino-2-phenylindole (DAPI; Invitrogen). Stained sections were examined and photographed with the Zeiss Axio Imager M2.
Statistics
A 2-tailed Student t test was applied for data analysis using Prism 5.0 (GraphPad Software). A P value of less than 0.05 was considered statistically significant, and a P value of less than 0.001 was considered highly significant.
RESULTS
Epo-Cy5.5 Is Fully Bioactive
The biologic activity of newly synthesized Epo-Cy5.5 was confirmed by stimulating the proliferation of the erythropoietin-dependent UT-7 cells (Supplemental Fig. 1). Both Epo-Cy5.5 and rhuEpo induced a similar dose-dependent increase in proliferation of UT-7 cells (Supplemental Fig. 1).
Epo-Cy5.5 Binds Specifically to EpoR In Vitro
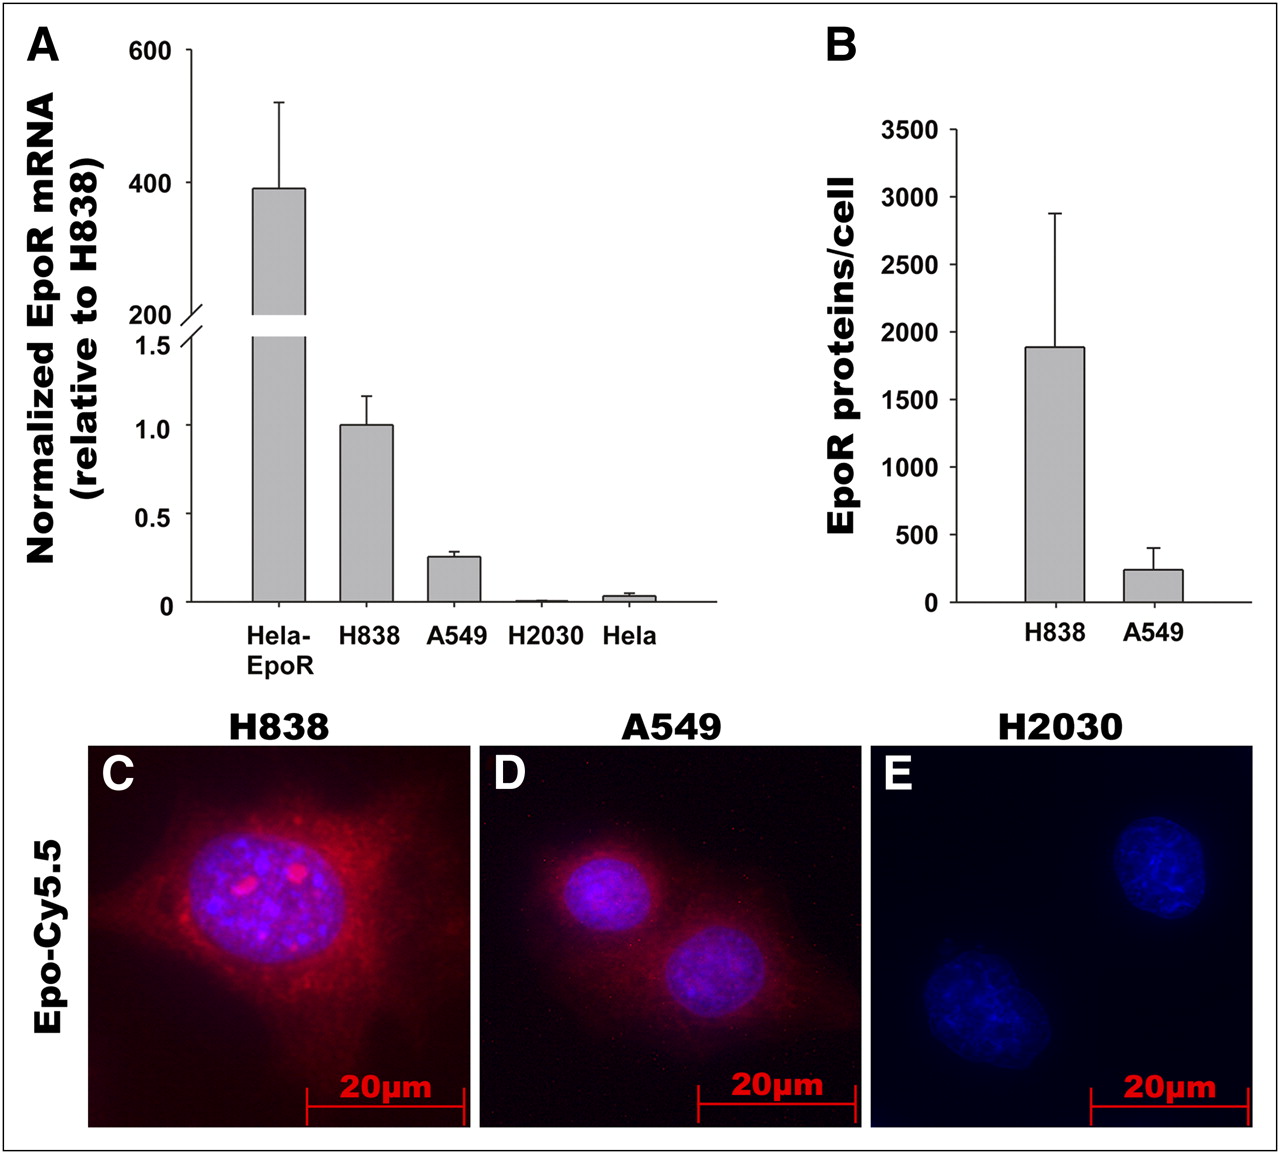
The binding of Epo-Cy5.5 to the receptor (EpoR) was tested in vitro using the NSCLC cell lines A549, H838, and H2030, which differ in EpoR expression level (Fig. 1). EpoR messenger RNA and protein expression levels were determined using quantitative RT-PCR and quantitative immunoblotting, respectively (Figs. 1A and 1B; Western blots, Supplemental Fig. 2). Quantitative RT-PCR and quantitative immunoblotting demonstrated a higher EpoR expression in H838 cells than in A549 and a lack of EpoR expression in H2030. EpoR/EGFP-transfected HeLa cells that overexpress a fusion protein of EpoR and EGFP were used as a positive control, and nontransfected HeLa cells were used as low-expressing controls (Figs. 1A and 1B). In line with the EpoR expression data, binding analysis of Epo-Cy5.5 confirmed stronger Epo-Cy5.5 signals in H838 than in A549, whereas no Epo-Cy5.5 signals were detected on the EpoR-negative H2030 (Figs. 1C–1E). These data suggest specific binding of Epo-Cy5.5 to its receptor on the tumor cells.

EpoR expression in NSCLC cell lines and binding of Epo-Cy5.5 to EpoR in vitro. (A) Analysis of EpoR messenger RNA expression in NSCLC cell lines H838, A549, and H2030 by quantitative RT-PCR. Hela cells and EpoR-transfected Hela cells that overexpress EpoR were used as controls. EpoR messenger RNA expression is higher in H838 than in A549, and EpoR is lacking in H2030. (B) Quantitative immunoblotting demonstrates higher EpoR protein expression in H838 than in A549. EpoR molecules were determined by adding recombinant calibrator GST-EpoR in different concentrations. Samples were run in triplicate and are representative of 3 independent experiments. (C–E) Incubation of NSCLC cell lines H838, A549, and H2030 with Epo-Cy5.5 (red) reveals stronger signal for Epo-Cy5.5 (red) in H838 than in A549 and no signal in H2030, thus correlating with EpoR expression levels. Nuclei were counterstained using DAPI (blue); images were acquired with equal exposure time.
To further validate probe specificity, we performed receptor competition analyses using EpoR/EGFP-transfected HeLa cells, which overexpress a C-terminal fusion protein of EGFP to EpoR (Fig. 2). Whereas a strong signal was detected in cells that were incubated with Epo-Cy5.5 alone (Fig. 2C), incubation of cells with Epo-Cy5.5 together with a 20-fold excess of unlabeled rhuEpo led to a strong signal reduction (Fig. 2G). The colocalization of the fusion protein EpoR/EGFR with the Epo-Cy5.5 signal in the control cells sustained the specific binding of Epo-Cy5.5 to the receptor (Fig. 2D). For quantification, we determined the mean fluorescence signal intensity at 695 nm (using the Cy5.5 filter) of microscopic images taken from 5 sections with equal exposure time (n = 5). A significantly lower mean signal intensity was found in samples of the competition group than in cells incubated with Epo-Cy5.5 alone (n = 5, P < 0.05) (Fig. 2I).
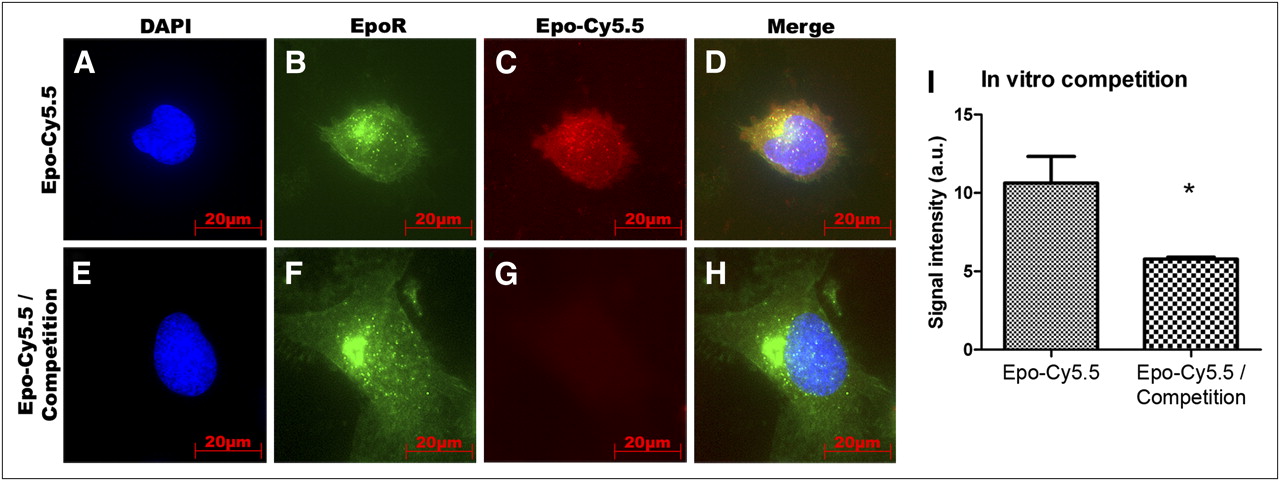
In vitro competition analysis of Epo-Cy5.5. To test binding specificity, EpoR/EGFP-transfected HeLa cells with EpoR/EGFP overexpression were incubated with Epo-Cy5.5 alone or with 1:20 mixture of Epo-Cy5.5 and unlabeled rhuEpo for competition. (A–D) Colocalization of Epo-Cy5.5 (red) with EGFR/EpoR fusion protein (green) (yellow in D) on EpoR/EGFP-transfected HeLa cells demonstrates specific binding of probe. (E–H) Competition by unlabeled rhuEpo leads to strong signal reduction (G). EGFP/EpoR fusion protein is shown in green, Epo-Cy5.5 in red, and counterstaining of nuclei by DAPI in blue. (I) Comparison of mean fluorescence signal intensities ± SD between control and competition samples of 5 slides shows significantly higher signal intensity in control samples (n = 5, P < 0.05). a.u. = arbitrary units.
Specific Accumulation of Epo-Cy5.5 Occurs in EpoR-Positive Tumors In Vivo
The in vivo specificity of Epo-Cy5.5 was tested in nude mice bearing subcutaneous xenografts of the EpoR-positive NSCLC cell lines A549 and H838 by competition analyses. For competition, mice received a 1:5 mixture of Epo-Cy5.5 with unlabeled rhuEpo intravenously, whereas Epo-Cy5.5 alone was injected in animals of the control group (n = 4 per group and cell line). The concentration of accumulated Epo-Cy5.5 in the tumor was determined longitudinally by FMT (Fig. 3). A simultaneous micro-CT scan allowed tumor localization and mapping of the FMT signals. For both tumor models, A549 and H838, comparison of the mean concentrations determined at all measuring time points revealed higher Epo-Cy5.5 concentrations in the Epo-Cy5.5 group than in the corresponding competition group (Figs. 3A and 3B). For A549 tumors, differences were significant 5, 7 (57.4 ± 18.3 nM for A549 control and 21.68 ± 8.67 nM for A549 competition), and 25 h after probe injection (P < 0.05) (Fig. 3A). For H838 tumors, differences between the control and competition groups were significant at 5, 7, 25, 27, 30, and 50 h (P < 0.05) and highly significant at 7, 23 (93.96 ± 11.39 nM for H838 control and 32.44 ± 7.64 nM for H838 competition), and 48 h after injection (P < 0.001) (Fig. 3B). These data demonstrate the specific binding of Epo-Cy5.5 in the tumor tissue in vivo. Furthermore, micro-CT/FMT fusion images of representative A549 and H838 control animals at 50 h after injection showed a higher probe accumulation in the H838 tumor, whereas probe accumulation in the bone marrow showed similar concentrations in both animals (Figs. 3C and 3D; tumors marked by white arrows, bone marrow by hatched arrows). This was confirmed by the comparison of Epo-Cy5.5 accumulation in A549 and H838 tumors of respective control mice, revealing a constantly higher probe concentration in H838 tumors and even significantly higher values at 7, 25 (60.45 ± 14.59 nM for A549 tumors and 89.54 ± 15.91 nM for H838), 27, 48, and 50 h after injection (P < 0.05, n = 4) (Fig. 3E). This is in line with the differences in EpoR expression levels of the respective tumor cells and further underlines the specific accumulation of the probe depending on the EpoR expression level in the tumor tissue.
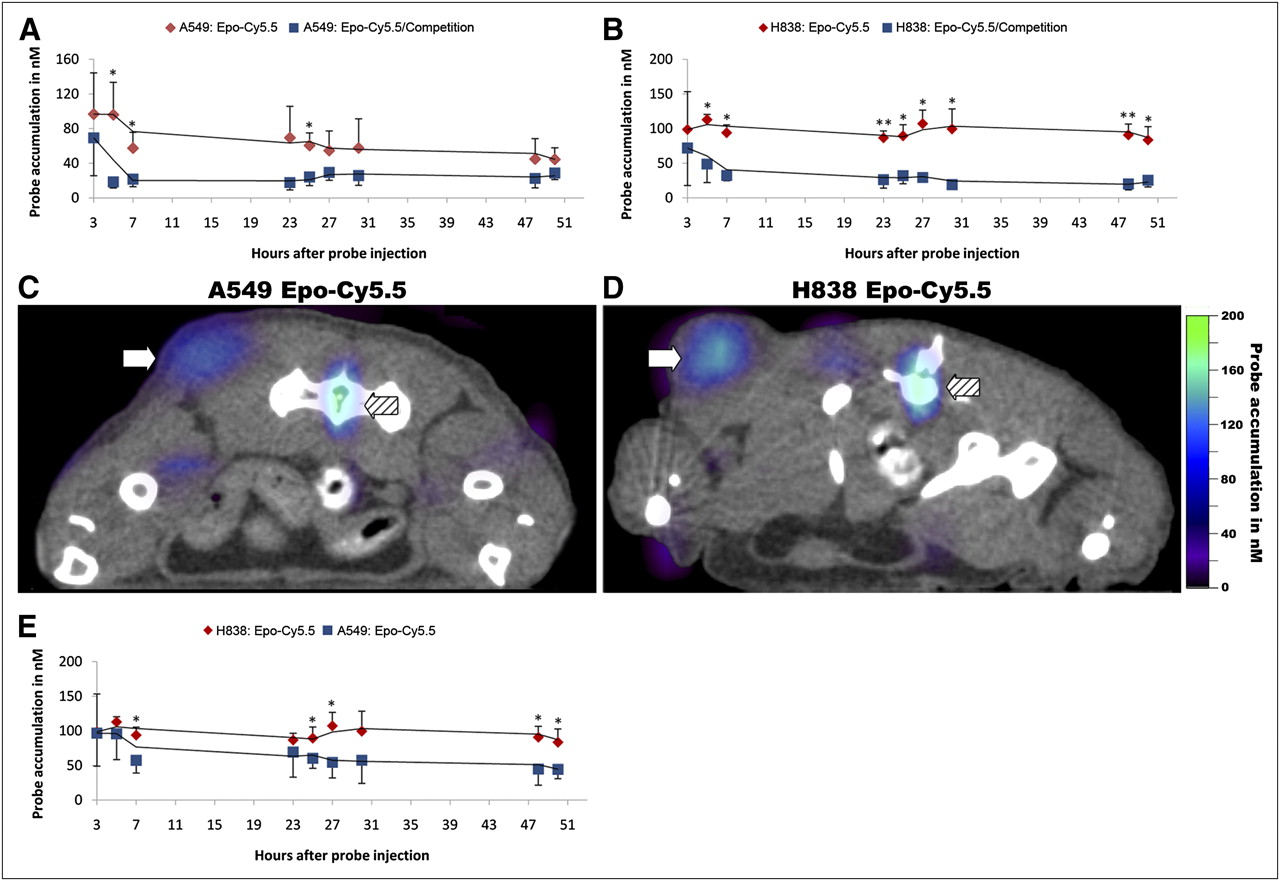
Epo-Cy5.5 binding specificity in vivo and EpoR expression level in tumors. Epo-Cy5.5 was injected alone or in 1:5 mixture with unlabeled rhuEpo into nude mice bearing subcutaneous A549 and H838 xenografts. Epo-Cy5.5 concentrations in tumors were determined by FMT. Simultaneous micro-CT scans allowed tumor localization and mapping of FMT signals. (A and B) Kinetics of probe accumulation in tumors of A549 control vs. A549 competition mice (A) and H838 control vs. H838 competition mice (B). Reduced binding of Epo-Cy5.5 is seen in competition group (*P < 0.05 and **P < 0.001, n = 4 animals per group). (C and D) Micro-CT/FMT fusion image showing high signal intensity in tumor and bone marrow of A549 and H838 control group. Tumor accumulation of Epo-Cy5.5 is higher in H838 (C) than in A549 (D), whereas signal in bone marrow is similar in both mice. Arrows mark tumor area; hatched arrows mark bone marrow. (E) Comparison of Epo-Cy5.5 tumor accumulation between A549 and H838 control groups, confirming higher probe accumulation in H838 tumors (*P < 0.05, n = 4 animals per group). Trend lines in A, B, and E illustrate almost constant accumulation of probe in tumor over time. Each value represents mean Epo-Cy5.5 concentration in nM ± SD (n = 4 per group).
Biodistribution Indicates Specific Accumulation of Epo-Cy5.5 in Bone Marrow
Biodistribution was analyzed in A549 tumor-bearing mice at different time points after Epo-Cy5.5 injection over a period of 50 h (Fig. 4A). After intravenous injection, high Epo-Cy5.5 levels were measured in the blood. These levels rapidly declined during the next 3 h, followed by a continuous decent decrease thereafter. Starting from 3 h after injection, the highest Epo-Cy5.5 levels were measured in the liver, with maximal enrichment between 3 and 7 h (416.77 ± 135.28 nM). A similar increase was observed in the kidneys, reaching a slightly lower maximum between 3 and 7 h (377.75 ± 227.14 nM), followed by an even stronger decline, arguing for renal clearance of Epo-Cy5.5 or of residual Cy5.5 after probe metabolization (27). In contrast to the decreasing levels in liver, blood, and kidneys, the amount of Epo-Cy5.5 in the bone marrow remained relatively constant starting from 3 h after injection (mean concentration between 3 and 50 h, 98.24 ± 8.77 nM). This indicates specific accumulation of Epo-Cy5.5 in this organ with high EpoR expression (Fig. 4B; bone marrow marked by white arrows, liver by a hatched arrow).
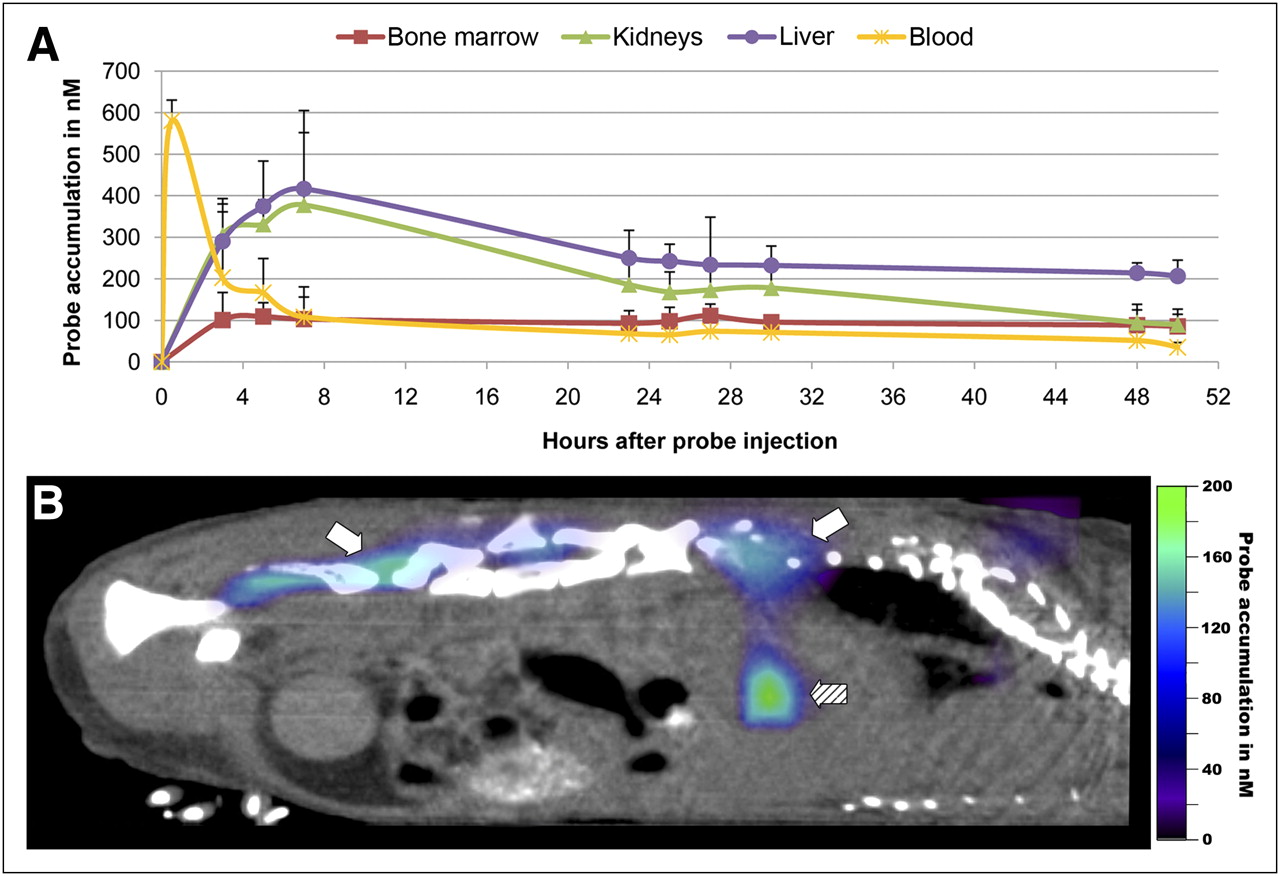
Biodistribution of Epo-Cy5.5. Organ kinetics were determined in nude mice bearing subcutaneous A549 xenograft tumors after intravenous injection of Epo-Cy5.5 (10 μM). (A) Epo-Cy5.5 concentrations were measured in liver, kidneys, bone marrow, and blood. After bolus intravenous injection of Epo-Cy5.5, high values are measured in blood, followed by rapid decline. Strong accumulation was observed in liver and kidneys starting from 3 h after injection and reaching maximal levels at 7 h; accumulation decreased thereafter. Almost constant accumulation of Epo-Cy5.5 was found in bone marrow, indicating specific receptor binding in organ with highest EpoR level. Shown are mean values of EpoCy5.5 concentrations ± SD for each measuring time point in nanomoles (n = 4). (B) Sagittal micro-CT/FMT fusion image at 48 h after probe injection demonstrating strong accumulation of Epo-Cy5.5 (color signals) in bone marrow (white arrows) and in liver (hatched arrow).
Epo-Cy5.5 Binds to Tumor and Endothelial Cells
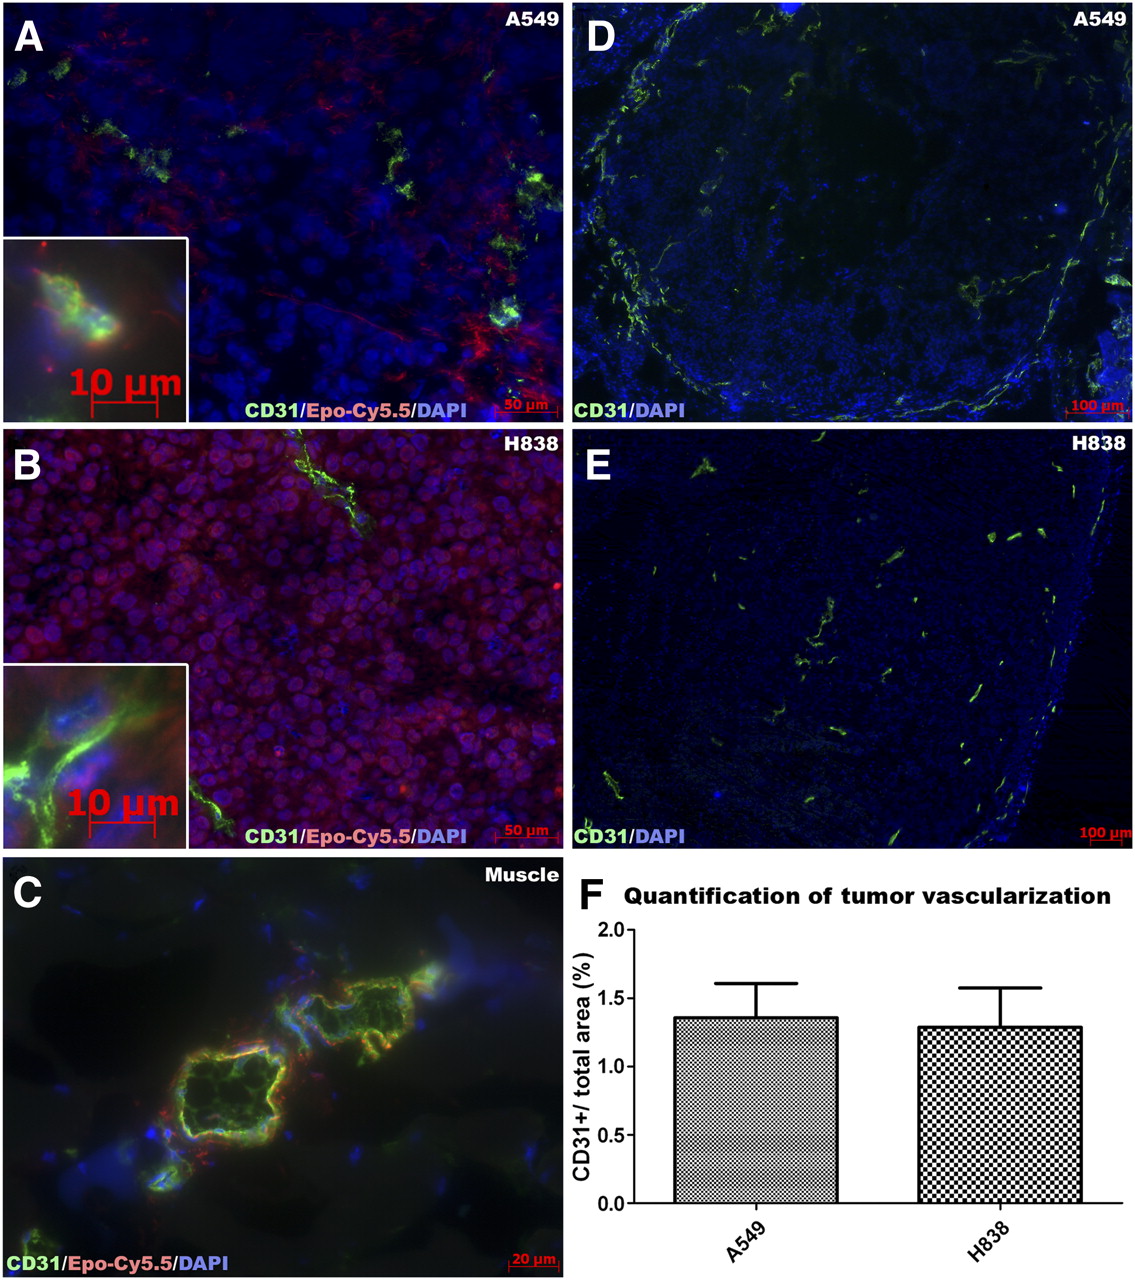
To validate EpoR expression, tumor sections were incubated with Epo-Cy5.5 (Fig. 5). Muscle sections were used as a control, since muscles cells are EpoR-negative. In sections of A549 and H838 tumors, the Epo-Cy5.5 signal was predominantly detected in tumor cells (Figs. 5A and 5B). Comparison of the different NSCLC models demonstrated stronger binding to H838 cells than to A549 cells, in line with the described EpoR expression levels. Interestingly, a weaker binding of Epo-Cy5.5 was found on endothelial cells in the tumor tissue of both models at a similar level, as demonstrated by costaining with CD31 (inserts in Figs. 5A and 5B). Binding of Epo-Cy5.5 was also observed in the muscle endothelium (Fig. 5C), in line with findings of other groups that showed a weak EpoR expression in endothelial cells of different origin (15,28), but the receptor was not functionally active (28). To determine whether the differences in probe accumulation between both NSCLC models were due to a different EpoR expression by the tumor cells or to different vessel densities, we determined the vascularization in both tumors. CD31 staining demonstrated a moderate and comparable vessel density. Quantification of the mean vessel density demonstrated a similar ratio of CD31-stained area to the complete tumor area in both A549 and H838 tumors (Fig. 5F, n = 4, P = 0.73). These results substantiate that the higher Epo-Cy5.5 accumulation in H838 tumors is indeed caused by the higher EpoR expression by the tumor cells and not by differences in vascularization.

EpoR expression level–dependent binding to tumor cells and weaker binding to endothelial cells, as shown by Epo-Cy5.5. A549 and H838 tumors have similar vascularization. (A–C) For further validation, cryosections of A549 and H838 tumors were stained with Epo-Cy5.5 (red), followed by vessel (CD31, green) and nucleus (DAPI, blue) staining. Murine muscle tissue was stained as control. Epo-Cy5.5 signal is stronger in H838 tumors (B) than in A549 tumors (A), in line with differences in EpoR expression of cell lines. In muscle tissue, Epo-Cy5.5 binds to muscle endothelial cells (C). (D–E) Immunostaining of CD31 (green) and DAPI (blue) demonstrates similar vascularization of H838 and A549 tumors. (F) Quantification of CD31+ area fraction confirms similar vessel density (P = 0.73, n = 4).
DISCUSSION
The discovery of EpoR expression on NSCLC tumor cells has given rise to controversial discussions about the use of rhuEpo for treating lung cancer–associated anemia (12). To elucidate the role of erythropoietin in lung cancer growth in detail, molecular imaging of the EpoR status would be of great benefit. Here, we have demonstrated the synthesis of an EpoR-specific near-infrared probe (Epo-Cy5.5) that allows monitoring of EpoR status in tumor xenografts by FMT. Specific binding of Epo-Cy5.5 was demonstrated in vitro using NSCLC cell lines with different EpoR expression levels and EpoR/EGFP-transfected HeLa cells with EpoR/EGFP overexpression. Specificity of Epo-Cy5.5 in vivo was confirmed by competition analyses with unlabeled rhuEpo in a 5-fold excess to Epo-Cy5.5 using subcutaneous A549 and H838 NSCLC xenografts. In line with the different EpoR expression levels, a stronger probe accumulation was detected in H838 than in A549 tumors, demonstrating the sensitivity of the probe for differences in target expression. Biodistribution analyses showed liver uptake and a predominantly renal clearance, as discussed by Agoram et al. (27). Detection of Epo-Cy5.5 in the urinary bladder (Doleschel et al., unpublished data, 2011) points to renal excretion at least of the dyes after cleavage.
Although the sensitivity of Epo-Cy5.5 was not high enough for its detection in tumor sections, incubation of unfixed tumor tissue with the probe demonstrated a major Epo-Cy5.5 binding to tumor cells. EpoCy5.5 showed a stronger binding to H838 than to A549 tumors, correlating with the higher EpoR expression in H838 cells. In addition to tumor cells, a weaker binding of Epo-Cy5.5 was also detected on endothelial cells of muscle and tumor tissue. Whether this has a functional relevance is a matter of an ongoing debate (15,28). However, since the vessel density was similar in H838 and A549 tumors, the stronger accumulation of the probe in H838 tumors was due to the higher EpoR expression level by the tumor cells and was not based on differences in vascularization. Thus, Epo-Cy5.5 enables the in vivo determination of the EpoR expression level of tumors. Although the concentrations determined by FMT are most probably not 100% accurate because of heterogeneities in scattering and absorption within the tissues, the optical probe is suggested as a promising tool for fast longitudinal analyses of EpoR status. Because near-infrared imaging is of limited suitability for human use because of the low penetration depth (29), modifications of the EpoR probe are currently performed to generate a specific tracer for PET. Furthermore, a better quantification of the EpoR concentration is expected using PET (30), since the FMT reconstruction based on diffuse light propagation in scattering tissue (31) is highly delicate and strongly affected by suboptimal bedding of the animal. Thus, the EpoR PET tracer may allow an accurate determination of EpoR status in cancer patients, including the longitudinal analysis of erythropoietin effects on receptor expression when treating chemotherapy-induced anemia.
CONCLUSION
Epo-Cy5.5 is presented as a reliable tool for studying EpoR expression in experimental tumors. We expect it to be suitable for elucidating the role of erythropoietin on EpoR expression in the tumor and, therefore, for understanding its contribution to tumor progression and angiogenesis.
DISCLOSURE STATEMENT
The costs of publication of this article were defrayed in part by the payment of page charges. Therefore, and solely to indicate this fact, this article is hereby marked “advertisement” in accordance with 18 USC section 1734.
Acknowledgments
This work was supported by the German Ministry for Education and Research (BMBF)/Bundesministerium für Bildung und Forschung (BMBF), project number 0315415C. No other potential conflict of interest relevant to this article was reported.
Footnotes
Published online Jan. 6, 2012.
- © 2012 by the Society of Nuclear Medicine, Inc.
REFERENCES
- Received for publication April 4, 2011.
- Accepted for publication September 12, 2011.


Jump to section
Related Articles
Cited By...
- No citing articles found.