


Abstract
Glucagonlike peptide (GLP-1) and its receptor (GLP-1R) exhibit cardioprotective effects after myocardial ischemia and reperfusion (MI/R) in both animal studies and clinical trials. However, the kinetics of GLP-1R expression in the infarcted/ischemic myocardium has not yet been explored. The purpose of this study was to monitor the presence and time course of regional myocardial GLP-1R expression after MI/R with noninvasive PET. Methods: Male Sprague–Dawley rats underwent a 45-min transient left coronary artery occlusion, followed by reperfusion. The myocardial infarction was confirmed by electrocardiogram and cardiac ultrasound. In vivo PET was performed to determine myocardial uptake of 18F-FBEM-Cys40-exendin-4 at different time points after reperfusion. The localization of 18F-FBEM-Cys40-exendin-4 accumulation was determined by coregistering 18F-FDG PET and CT images. Ex vivo autoradiography, GLP-1R immunohistochemical staining, and Western blot analysis were performed to confirm the PET results. Results: Myocardial origin and infarcted/ischemic area localization of 18F-FBEM-Cys40-exendin-4 accumulation was confirmed by coregistration of small-animal CT and 18F-FDG images. At 8 h after MI/R, tracer uptake in the infarcted/ischemic region was 0.37 ± 0.05 percentage injected dose per gram, significantly higher than that in the control group (P < 0.01). The localized tracer uptake decreased, relative to the 8-h time point, but was still significantly higher than the control group on days 1 and 3 after MI/R. At 2 wk after MI/R, the tracer uptake in the affected area showed no significant difference, compared with that in the healthy myocardium. Autoradiography showed the same trend of 18F-FBEM-Cys40-exendin-4 uptake in the myocardial infarcted/ischemic area. The specificity of tracer uptake into ischemic myocardium was supported by decreased tracer uptake after the rats were pretreated with an excess amount of unlabeled exendin-4. Immunohistochemical staining and Western blotting of GLP-1R protein of excised cardiac sections confirmed that the change in uptake observed by PET corresponded to a change in GLP-1R expression. Conclusion: Noninvasive PET using 18F-FBEM-Cys40-exendin-4 revealed a dynamic pattern of GLP-1R upregulation in the infarcted/ischemic area after MI/R. The imaging results will deepen our understanding of the mechanism of the cardioprotective effect of GLP-1 and its analogs and potentially provide guidance for optimization of the time frame of therapeutic intervention.
As the leading cause of death in the world, coronary heart disease claims the lives of 3.8 million men and 3.4 million women each year throughout the world (1). After an acute coronary artery occlusion, restoring coronary patency using either primary percutaneous coronary intervention or thrombolytic therapy remains the most effective treatment strategy to provide oxygen and nutrients to the ischemic area. However, reperfusion itself also exacerbates myocardial damage, which is known as ischemia/reperfusion injury (2,3). Methods to protect the heart during reperfusion are of great clinical interest. Ischemic conditioning is an innate protective mechanism by which brief ischemia renders the organ resistant to more prolonged and potentially lethal ischemia (4). Both preconditioning and postconditioning involve the activation of specific cell surface receptors, such as several G-protein–coupled receptors, which in turn activate a complex array of intracellular signaling pathways (5).
The glucagonlike peptide type 1 (GLP-1), a 30-amino-acid gut hormone, is released after the ingestion of nutrients. GLP-1 acts through a distinct heptahelical G-protein–coupled receptor (GLP-1R), which is highly expressed in pancreatic β-cells (6). GLP-1R is also expressed in high density and high incidence in certain types of cancers derived from endocrine, neuroendocrine, and embryonic origins (7). GLP-1 levels are decreased in patients with type 2 diabetes, and GLP-1–based therapies are currently in widespread clinical use for the treatment of type 2 diabetes.
Emerging evidence indicated that GLP-1 and related peptides have protective effects in a variety of tissues, including the demonstration of cardioprotection in a range of animal models of ischemia and reperfusion (8–10). GLP-1 limits apoptosis in myocytes via activation of cyclic adenosine monophosphate and phosphoinositide 3-kinase by binding with GLP-1Rs (8). It has been demonstrated that phosphoinositide 3-kinase activation is associated with myocardial protection in the setting of ischemic/reperfusion injury (11) and myocardial preconditioning (12). Moreover, activation of the antioxidant gene heme oxygenase-1 through GLP-1R reduces fibrosis and left ventricle (LV) remodeling and restores LV function after myocardial ischemia (13,14). In view of the important cardioprotective role that the GLP-1/GLP-1R pathway plays during MI/R, a noninvasive method for the longitudinal assessment of GLP-1 peptide delivery and regional upregulation of GLP-1R could be of considerable value to accelerate GLP-1–related drug development and improve the understanding of its role in MI/R injury.
Despite the high affinity and specific binding to GLP-1R, native GLP-1 peptide is not ideal as an imaging tracer because it is rapidly degraded by dipeptidyl-peptidase-IV via the cleavage of 2 N-terminal residues (15). Consequently, both synthetic and naturally occurring GLP-1 analogs including exendin-3 and exendin-4 have been labeled with radioisotopes such as 111In and 99mTc for SPECT and 68Ga for PET (16–18). Exendin-4 shows a 53% amino acid homology with GLP-1 but is resistant to dipeptidyl-peptidase-IV attack and, consequently, has a much longer plasma half-life (19). Recently, we developed 2 novel PET probes, 18F-FBEM-EM3106B and 18F-FBEM-Cys40-exendin-4, for GLP-1R–targeted PET (20,21). In an INS-1 rat insulinoma xenograft model, both tracers showed high and receptor-specific tumor accumulation. Compared with the synthetic preparation of the bis-cyclic amide EM3106B, the linear peptide structure of exendin-4 provides easy preparation of C-terminal and N-terminal cysteine modifications using standard solid-phase peptide synthesis methods. The cysteine-modified exendin-4 analog is amenable to radiolabeling using our 18F-FBEM prosthetic group (21).
In the present study, we performed longitudinal PET in a rat MI/R model using 18F-FBEM-Cys40-exendin-4 as the imaging probe. The noninvasive in vivo imaging is expected to provide real-time information as to the presence and time course of regional myocardial GLP-1R expression. To the best of our knowledge, this is the first attempt to use a radiolabeled 18F-labeled GLP-1 peptide analog for myocardial imaging.
MATERIALS AND METHODS
All reagents were of analytic grade and were obtained from commercial sources. The 18F radionuclide was obtained from the Clinical Center’s cyclotron facility of the National Institutes of Health by proton irradiation of 18O-enriched water. 18F-FDG was purchased from the Nuclear Pharmacy of Cardinal Health and was reconstituted with sterile saline. Cys40-exendin-4 and exendin-4 were prepared by solid-phase peptide synthesis (CS Bio Inc.).
Radiochemical Synthesis of 18F-FBEM-Cys40-Exendin-4
18F-FBEM-Cys40-exendin-4 was prepared with the same procedure as described before (21). The desired amount of 18F-FBEM (range, 388.5–984.2 MBq) was evaporated to near-dryness and mixed with 10 μL of ethanol (22), and 100–200 μg of Cys40-exendin-4 in 100 μL of 0.1% sodium ascorbate in phosphate-buffered saline (PBS) was added. The major radioactivity peak collected from the semipreparative high-performance liquid chromatography was the product. The fraction containing 18F-FBEM-Cys40-exendin-4 was diluted to 20 mL with water and passed through a C-18 BondElut cartridge (100 mg). The product that remained on the cartridge was eluted with 1 mL of 10 mM HCl in ethanol. The ethanol eluent was evaporated and redissolved in PBS for animal studies. The radiochemical synthesis yield for 18F-FBEM-Cys40-exendin-4 was 34.3% ± 3.4% (n = 11) based on starting 18F-FBEM without decay correction. Radiochemical purity was more than 96%.
Animal Model of Coronary Occlusion and Reperfusion
All animal studies were conducted in accordance with the principles and procedures outlined in the Guide for the Care and Use of Laboratory Animals (23) and were approved by the Institutional Animal Care and Use Committee of the Clinical Center (National Institutes of Health). Adult male Sprague–Dawley rats weighing from 250 to 300 g were used. Anesthesia was induced with 5% isoflurane and the animals were intubated for mechanical ventilation. The anesthesia was then maintained with 2% isoflurane. MI/R models were induced by ligation of the left anterior descending coronary artery 2–3 mm from the tip of the left auricle with a 6-0 polypropylene suture. Forty-five minutes after the coronary occlusion, the suture was removed to obtain reperfusion. In the sham-operated animals, a suture was placed in the myocardium (without ligation of the left coronary artery). The occlusion and reperfusion were confirmed by ST-segment elevation on an electrocardiogram monitor (EC-60 model; Silogic) and 18F-FDG imaging at 1 d after surgery.
Assessment of LV Contractility with Echocardiography
Cardiac function was assessed as described previously (24). Briefly, 2 d after MI/R, the rats received 3% isoflurane for general anesthesia and were placed on the scanning table. Echocardiographic images were obtained using a dedicated small-animal high-resolution imaging unit and a 30-MHz linear transducer (Vevo 770; Visualsonics) (25). LV end-diastolic and LV end-systolic diameters (LVEDD and LVESD, respectively) were measured using the parasternal short-axis view, and LV fractional shortening was calculated as (LVEDD – LVESD)/LVEDD × 100. All measurements were averaged on 3 consecutive cardiac cycles.
Small-Animal PET/CT Scanning
At 8 h, 1 d, 3 d, 1 wk, and 2 wk after MI/R, PET and image analysis were performed using an Inveon microPET scanner (Siemens Medical Solutions) (26). Animals were anesthetized with 3% isoflurane, and approximately 18.5 MBq (500 μCi) of 18F-FBEM-Cys40-exendin-4 was administered via tail vein injection. One hour later, 10-min static PET images were acquired. The images were reconstructed using a 2-dimensional ordered-subset expectation maximum algorithm, and no correction was applied for attenuation or scatter. For each scan, regions of interest (ROIs) were drawn using vendor software (ASI Pro 5.2.4.0 VM; Siemens Preclinical Solution) on decay-corrected whole-body coronal images. The radioactivity concentrations (accumulation) within myocardium were obtained from mean pixel values within the multiple ROI volume and then converted to megabecquerels per milliliter. These values were then divided by the administered activity to obtain (assuming a tissue density of 1 g/mL) an image ROI–derived percentage injected dose per gram (%ID/g). In addition, signal from the infarcted area was compared with the contralateral myocardium (at the septal level), which was taken as background signal, and expressed as the signal-to-background ratio. To assess the specificity of tracer uptake, 8 mg of unlabeled exendin-4 per kilogram were injected 10 min before 18F-FBEM-Cys40-exendin-4 (18.5 MBq) administration in rats at 3 d after MI/R (n = 3).
Immediately after the 18F-FBEM-Cys40-exendin-4 scan, animals were kept on the scanning gantry (for image coregistration) and injected with 18.5 MBq (500 μCi) of 18F-FDG. One hour afterward, 10-min static images were acquired, with the mid thorax in the center of the field of view, and images were reconstructed and analyzed with the same procedure as described above.
To anatomically localize the tracer signal obtained using PET, animals from both groups were first scanned in an Inveon docked PET/CT scanner (Siemens Medical Solutions). An anesthetized rat was mounted on a turntable bed that could be moved automatically in the axial direction. Respiration-gated CT acquisition parameters were as follows: voltage, 80 kVp; current, 400 μA; angular sampling, 1° per projection for a full 360° scan; and effective pixel size, 58 μm. The scanning time was approximately 10 min. The image was reconstructed in real time by a modified Feldkamp cone-beam algorithm with a Shepp–Logan filter and an appropriate center offset as determined before scanning. A maximum-intensity projection of the CT image was adopted for anatomic reference of PET.
Autoradiography
At each time point in parallel with PET, the same amount of 18F-FBEM-Cys40-exendin-4 was administered to each rat. One hour later, the heart was harvested and frozen in CRYO-OCT compound (Tissue-Tek). Serial short-axis sections covering the entire heart were obtained at 1-mm intervals (15-μm thickness each) using a cryostat (Ultrapro5000; Vibratome). The tissues were flash-thawed onto silanized glass slides. A high-efficiency storage phosphor screen was exposed to the tissue slides for 12 h and developed in a Cyclone Plus Storage Phosphor System (PerkinElmer). The autoradiograph was analyzed with Optiquant acquisition and analysis software (version 5.0; Perkin Elmer). The 18F-FBEM-Cys40-exendin-4 uptake ratio was calculated by dividing the ROI value of the focal tracer uptake region by that of the contralateral normal area.
Hematoxylin and Eosin (HE) and 2,3,5-Triphenyl-2H-Tetrazolium Chloride (TTC) Staining
Slices (15 μm) adjacent to those used for autoradiography were selected for HE staining using standard techniques. Slices of 2-mm thickness adjacent to those used for autoradiography and HE imaging were also prepared and stained with a buffered solution of TTC at 38°C to identify myocardial infarction.
GLP-1R Immunohistochemical Staining
Myocardial tissue samples were fixed with 10% neutral buffered formalin and embedded in paraffin. Tissue sections (thickness, 5 μm) were blocked with endogenous peroxidase using 3% hydrogen peroxide for 20 min. Sections were then washed 3 times in PBS and briefly in a buffer containing 1% polymerized bovine albumin and incubated with rabbit antirat polyclonal GLP-1R antibody (1:200; Abcam) at 37°C for 2 h. After being washed with PBS, each section was incubated with horseradish peroxidase–conjugated antigoat IgG for 60 min at room temperature. Diaminobenzidine was used as the chromogen, and HE counterstaining was performed. Six fields were randomly selected from each section and observed using a light microscope (BX41; Olympus).
Fluorescent Staining
Frozen heart sections from MI/R rats and sham-operated rats (5–8 μm thick) were fixed with cold acetone for 20 min and dried in the air. All the sections were blocked with 1% bovine serum albumin for 30 min and then incubated with rabbit antirat GLP1-R antibody (AGR-02, 1:200; Alomone Labs) and mouse antirat CD11b antibody (MA1-80560, 1:300; Pierce Biotechnology) for 1 h at room temperature. They were then stained with Dylight 488–conjugated donkey antimouse secondary antibody (1:1,000) and Cy3-conjugated donkey antirabbit secondary antibody (1:1,000; Jackson ImmunoResearch Laboratories). After 5 washing steps, the tissue slices were mounted with medium containing 4′,6-diamidino-2-phenylindole, and all slices were observed by an epifluorescence microscope (X81; Olympus).
Western Blot Analysis of GLP-1R
Myocardial samples (100–200 mg) that had been frozen in liquid nitrogen were homogenized and suspended in radio-immunoprecipitation assay (RIPA) buffer (Sigma) plus protease inhibitor cocktail (Roche). Soluble protein fractions (30 μg) were separated on 4%–12% polyacrylamide gels using sodium dodecyl sulfate polyacrylamide gel electrophoresis and transferred to nitrocellulose membranes, which were blocked for 1 h at room temperature with Tris-buffered saline containing 5% bovine serum albumin. The blots were washed with Tris-buffered saline containing 0.1% polysorbate 20 and then incubated with rabbit antirat polyclonal GLP-1R antibody (1:500; Abcam). In all determinations, monoclonal antibody for rat glyceraldehyde-3-phosphate dehydrogenase (1:2000; Abcam) was used as an internal control. After extensive washing, the antigen–antibody complexes were detected using horseradish peroxidase–labeled donkey antirabbit IgG and a SuperSignal West Pico Chemiluminescence Kit Detection System (Pierce).
Statistical Analysis
Data are expressed as mean ± SD. Statistical analysis used the unpaired Student t test with unequal variance (for comparison between sham-operated and animals with myocardial ischemia) and the paired Student t test for comparison before and after myocardial ischemia. A P value of less than 0.05 was considered statistically significant.
RESULTS
Characterization of MI/R Model
The success of the MI/R model was confirmed by ST-T segment elevation using electrocardiography during surgery (Fig. 1A). There was no difference in weight or heart rate between sham (n = 3) and MI/R (n = 5) animals (data not shown). At 1 d after surgery, an obvious uptake defect in the anterolateral wall of the left ventricle was observed with 18F-FDG PET (Fig. 1B). At 2 d after MI/R, akinesis of the anterolateral wall with a significant decrease in cardiac function was identified by M mode high-resolution ultrasound (Fig. 1C). Fractional shortening was decreased from 51% ± 4.5% to 32% ± 2.8% in rats after ischemia–reperfusion. As was expected, neither uptake defect nor compromised cardiac function was observed from 18F-FDG PET and M-mode high-resolution ultrasound in sham-operated animals.
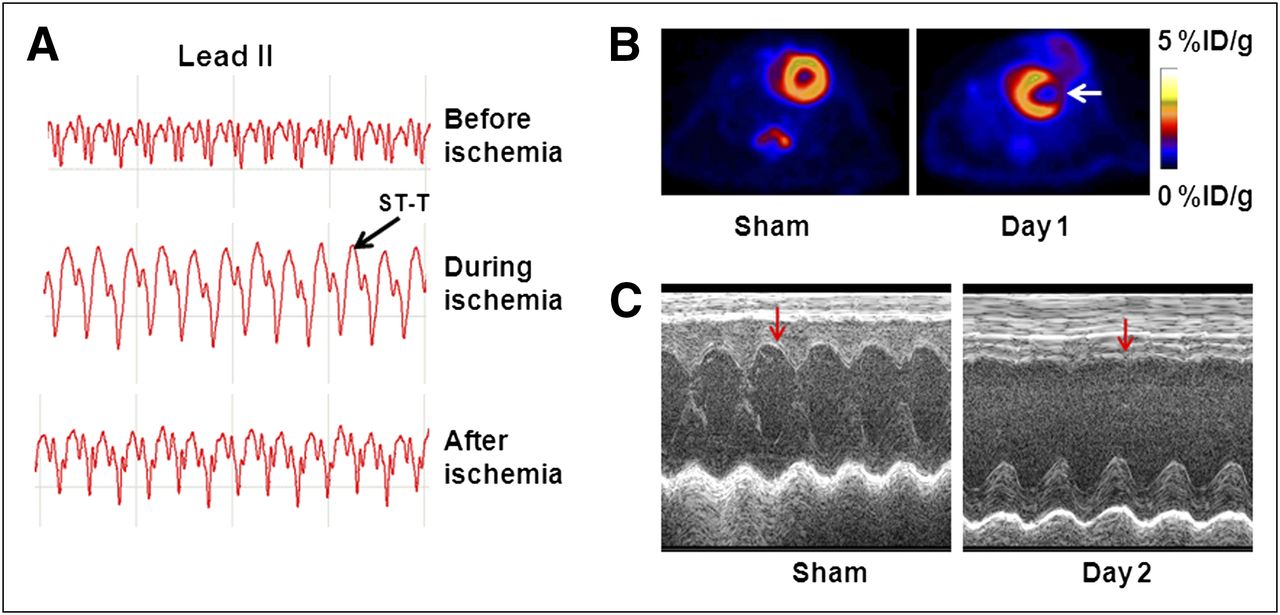
Characterization of MI/R model. (A) Electrocardiogram change during and after MI/R. (B) 18F-FDG PET of sham-operated rats and animal with MI/R at 1 d after reperfusion. Decreased 18F-FDG accumulation was observed in anterolateral wall (white arrow) in heart with MI/R. (C) M-mode ultrasound at mid ventricle level. At 2 d after MI/R, there was akinesis of anterolateral wall (red arrow) and significant decrease in fractional shortening, compared with that of sham-operated animals.
Image Colocalization
Intensive 18F-FDG uptake in the myocardium is due to the high metabolic rate (27). Thus, 18F-FDG PET provides an anatomic reference to the site of infarction and reflects the reduced metabolism of the infarcted area. To facilitate image coregistration, the position of the animal was precisely maintained in the scanning gantry during both tracer injections and imaging process. Representative myocardial transaxial slices from the same animal after in vivo PET of 18F-FBEM-Cys40-exendin-4 and 18F-FDG are presented in Figure 2A. High and homogeneous 18F-FDG accumulation was visualized in the heart of the sham group whereas almost no 18F-FBEM-Cys40-exendin-4 uptake was observed. Compared with sham-operated rats, the heart in MI/R rats showed decreased 18F-FDG uptake in the anterolateral wall of the left ventricle at 1 d after surgery. 18F-FBEM-Cys40-exendin-4 localization was observed within the myocardium in the rats after MI/R. Moreover, the localization matched perfectly with the areas of infarcted/ischemic myocardium, as evidenced by decreased 18F-FDG uptake.
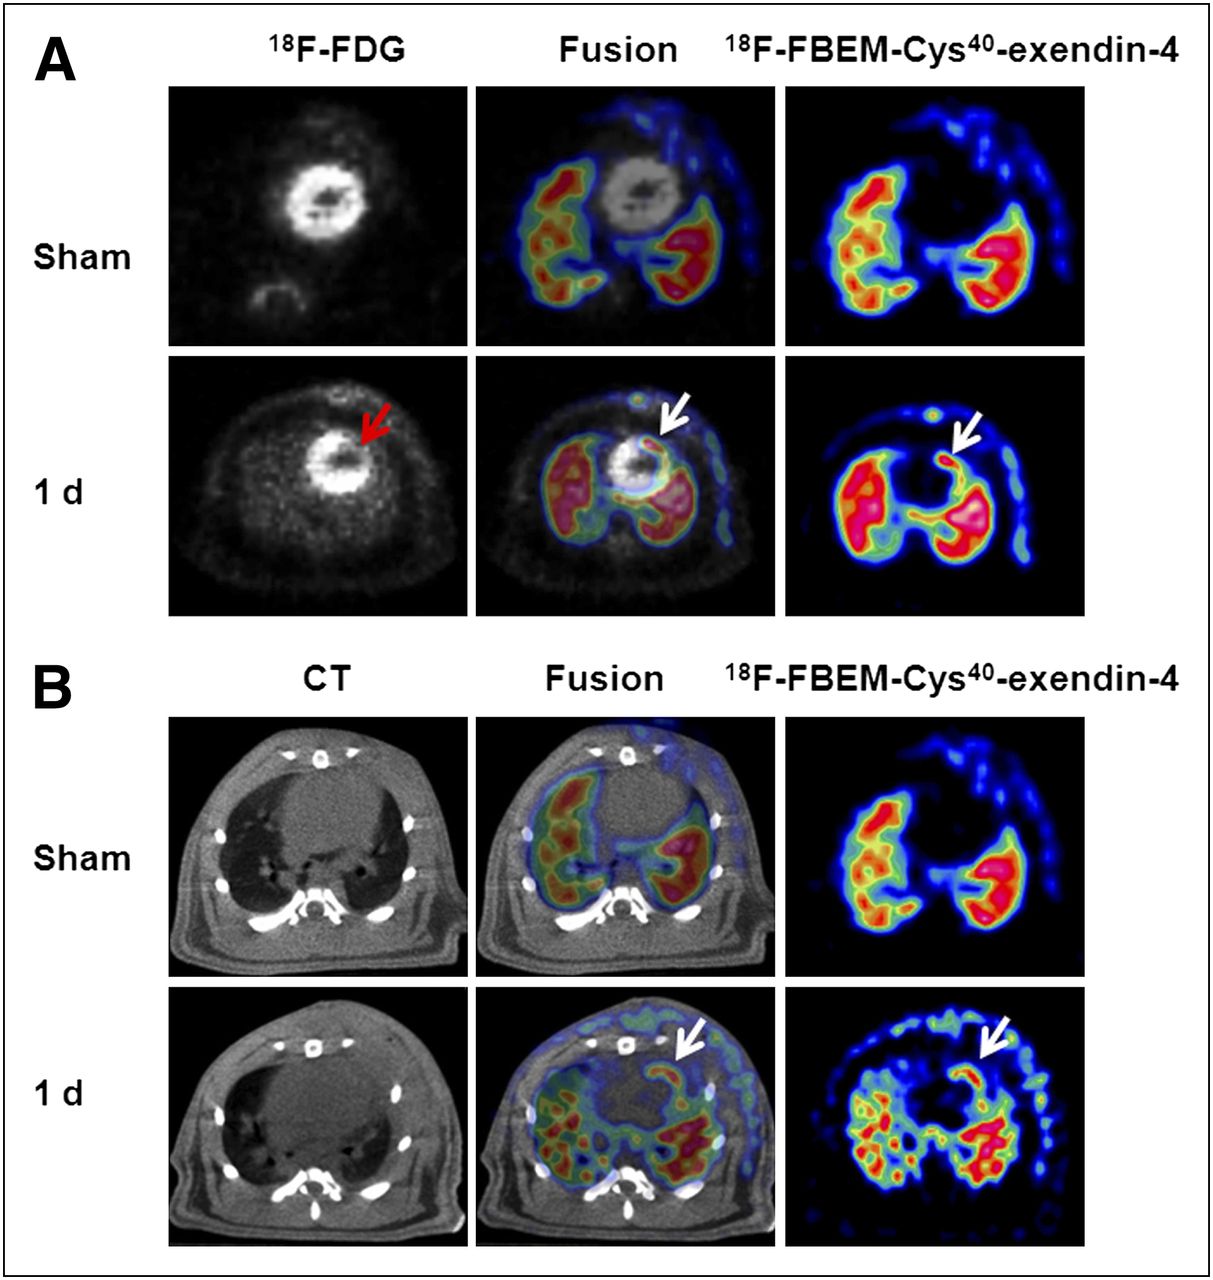
Coregistration of 18F-FBEM-cys40-exendin-4 PET with 18F-FDG PET (A) and CT scan (B). Transaxial sections were adapted for image fusion. (A) Coronary artery ligation resulted in decrease of 18F-FDG uptake (red arrow) and increased uptake of 18F-FBEM-cys40-exendin-4 (white arrow). Fusion of both scans results in perfect colocalization of decreased 18F-FDG and increased 18F-FBEM-cys40-exendin-4 uptake. (B) PET/CT fused images demonstrated myocardial origin of 18F-FBEM-cys40-exendin-4 PET signal after MI/R. 18F-FBEM-cys40-exendin-4 signal detected with PET corresponds to anterolateral myocardium and is clearly separated from intercostal muscle layer.
To further confirm the anatomic localization of 18F-FBEM-Cys40-exendin-4 PET, we obtained a CT scan for the same animal with a docked PET/CT system. Representative transaxial slices of PET and CT scans are shown in Figure 2B. The fused images clearly showed localization of 18F-FBEM-Cys40-exendin-4 within the myocardium at 1 d after MI/R. 18F-FBEM-cys40-exendin-4 signal detected with PET corresponded to anterolateral myocardium and was clearly separated from the intercostal muscle layer.
Time Frame of GLP-1R Expression by PET
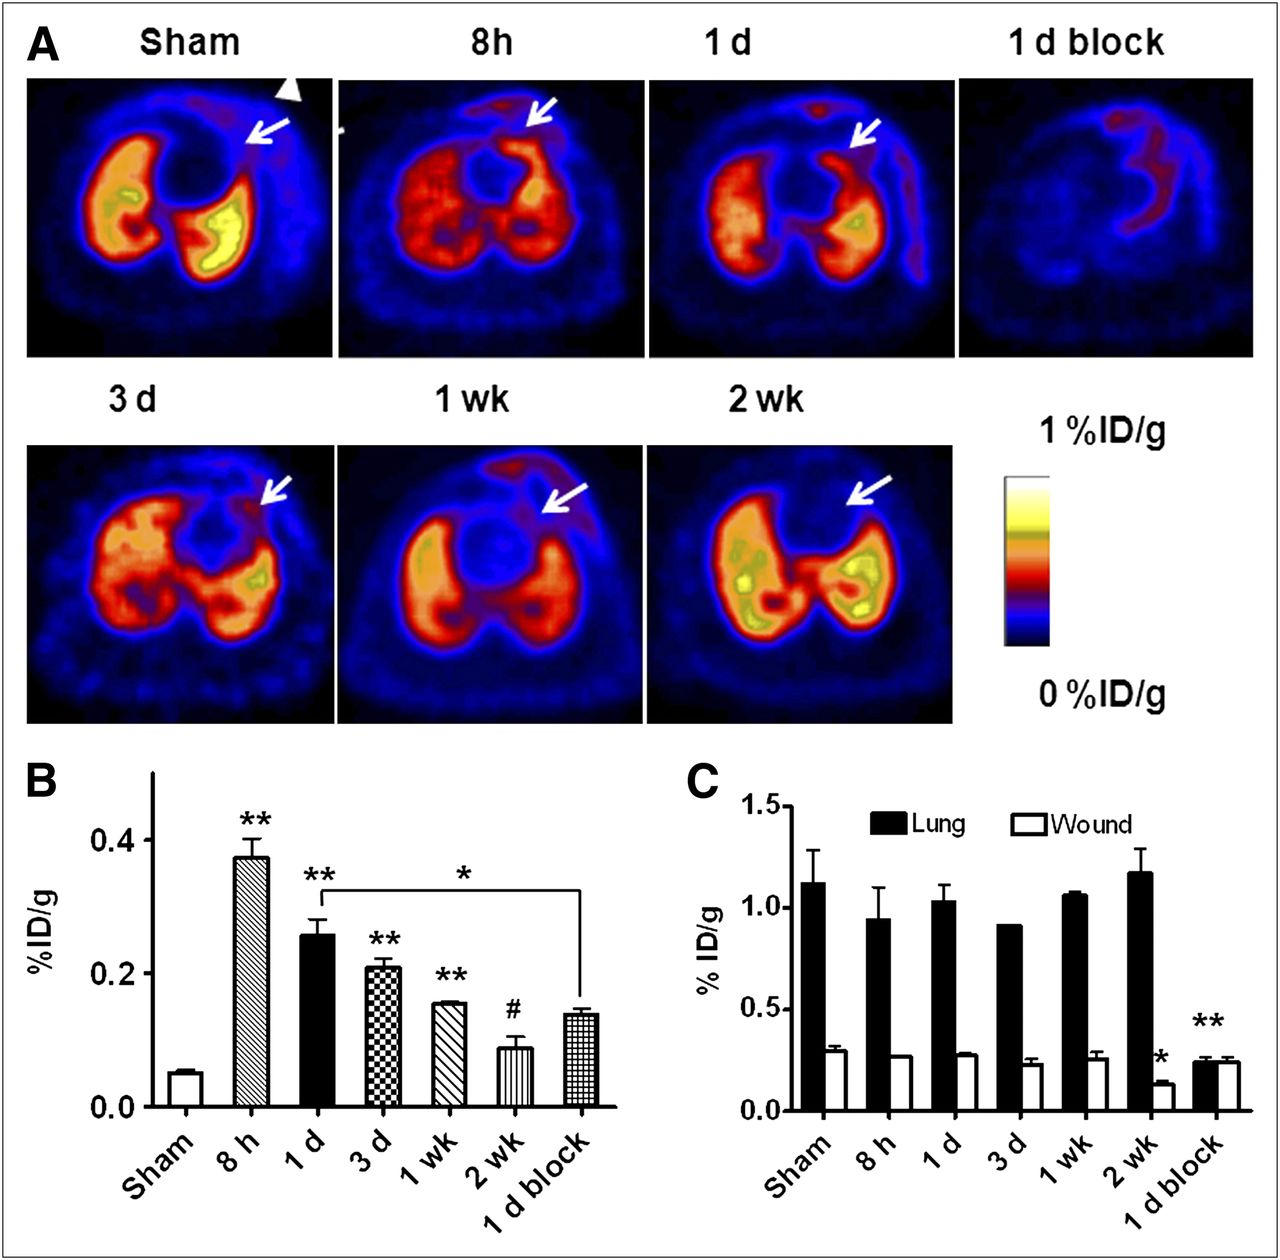
To evaluate GLP-1R expression after MI/R, longitudinal PET was performed at 8 h (n = 5), 1 d (n = 5), 3 d (n = 5), 1 wk (n = 5), and 2 wk (n = 3) after surgery using 18F-FBEM-Cys40-exendin-4 as the imaging probe. Figure 3A shows representative transaxial PET images acquired at different time points after MI/R. In all rats, lung uptake of 18F-FBEM-Cys40-exendin-4 was observed because of the high level of endogenous GLP-1R expression (9). Compared with the control group, localized tracer uptake was observed as early as 8 h after MI/R. The positive signal persisted at a relatively high level at 1 and 3 d and then decreased from 1 wk after MI/R. At 2 wk after MI/R, almost no tracer accumulation was observed in the infarcted/ischemic region. Minimal tracer uptake was also identified in the area of the surgical wound.

PET of GLP1-R expression using 18F-FBEM-cys40-exendin-4. (A) Representative transaxial PET images using 18F-FBEM-cys40-exendin-4 at different times after MI/R. High 18F-FBEM-cys40-exendin-4 uptake region from infarcted/ischemic myocardium is indicated by white arrows, and triangle indicates 18F-FBEM-cys40-exendin-4 signal from surgical wound, which is present in both sham-operated and MI/R animals. (B) Quantification of 18F-FBEM-cys40-exendin-4 uptake in infarcted/ischemic myocardium after MI/R over time, expressed as %ID/g of tissue. 18F-FBEM-cys40-exendin-4 uptake was highest at 8 h after operation, compared with sham group. (C) Quantification of 18F-FBEM-cys40-exendin-4 uptake in lung and surgical wound region after MI/R over time, expressed as %ID/g of tissue. *P < 0.05. **P < 0.01. #P > 0.05.
The quantitative results based on PET are presented in Figure 3B. The uptake of 18F-FBEM-Cys40-exendin-4 in healthy myocardium in the sham-operated rats at 1 d after surgery was as low as 0.05 ± 0.007 %ID/g. MI/R induction was associated with a significant increase in 18F-FBEM-Cys40-exendin-4 uptake in the anterolateral wall of the myocardium. At 8 h after MI/R, tracer uptake in the infarcted/ischemic region was 0.37 ± 0.05 %ID/g, significantly higher than that in the control group (P < 0.01). The localized tracer uptake decreased but remained elevated, compared with controls, at 1 and 3 d (0.29 ± 0.015 and 0.21 ± 0.024 %ID/g, respectively; P < 0.05 and P < 0.01, respectively). The uptake of 18F-FBEM-Cys40-exendin-4 kept dropping with time to 0.15 ± 0.005 %ID/g at 7 d after MI/R (P < 0.01). At 14 d after MI/R, the tracer uptake in the affected area showed no significant difference from that in the healthy myocardium (0.087 ± 0.018 %ID/g, P > 0.05).
To further confirm the GLP-1R binding specificity of 18F-FBEM-Cys40-exendin-4, we used nonradiolabeled exendin-4 as a blocking agent. It is clear that tracer uptake in the infarcted myocardium could be blocked by an excess amount of unlabeled exendin-4 peptide. The tracer uptake was significantly lower than that in the unblocked rats at 1 d after MI/R (0.14 ± 0.01 vs. 0.26 ± 0.04 %ID/g, respectively; P < 0.05).
The lung uptake in sham-operated rats is 1.12 ± 0.29 %ID/g. MI/R did not affect lung uptake of 18F-FBEM-Cys40-exendin-4 significantly (Fig. 3C). An excess amount of unlabeled exendin-4 blocked lung uptake (P < 0.01). 18F-FBEM-Cys40-exendin-4 uptake within the surgical wound was 0.30 ± 0.04 %ID/g and remained essentially unchanged until 2 wk after surgery, at which time the uptake dropped to 0.13 ± 0.02 %ID/g. In addition, an excess amount of unlabeled exendin-4 did not affect tracer uptake in the surgical wound (0.24 ± 0.05 %ID/g, P > 0.05).
Autoradiography
In parallel to in vivo PET, we performed ex vivo autoradiography to validate the quantitative results based on PET images. Typical autoradiographs and averaged uptake ratios in different time points are shown in Figure 4. At early time points until 3 d after MI/R, increased signal intensity was clearly seen in the infarcted/ischemic area. Moreover, the signal was localized within the infarcted/ischemic area, as evidenced by TTC and HE staining. Quantitative data demonstrated a trend similar to the results from PET. The uptake ratio of 18F-FBEM-Cys40-exendin-4 in the infarcted/ischemic area, compared with unaffected myocardium, was the highest at 8 h after MI/R and decreased with time. At 2 wk after MI/R, almost no signal was detected in the infarcted/ischemic myocardium.
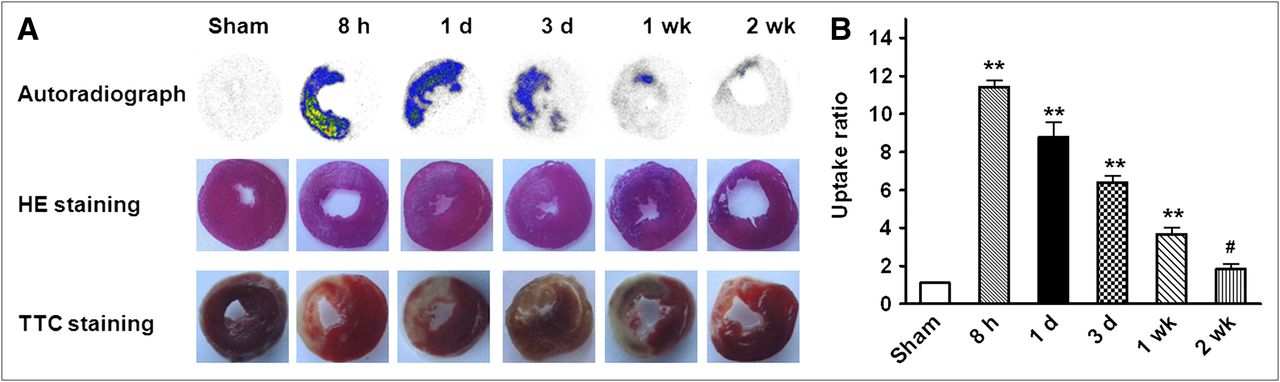
(A) Representative autoradiographs of 18F-FBEM-cys40-exendin-4 uptake in myocardium and corresponding HE and TTC staining on adjacent slices from same animal at different time points after MI/R. (B) Time course of myocardial 18F-FBEM-cys40-exendin-4 uptake ratios (vs. remote myocardium) after MI/R determined by autoradiography. *P < 0.05. **P < 0.01. #P > 0.05.
Western Blot and Histologic Staining
It is expected that increased uptake of 18F-FBEM-Cys40-exendin-4 in the infarcted/ischemic area within myocardium is mainly due to upregulation of the targeting protein receptor GLP1-R. Therefore, we performed Western blotting using GLP-1R–specific antibody on myocardial samples from both sham-operated and MI/R rats. As shown in Figure 5, the GLP-1R protein level was markedly increased in ischemic myocardium at 1 d after MI/R, compared with the sham group (P < 0.05). To further characterize the expression and distribution of GLP-1R microscopically, we performed immunohistochemical staining of myocardial tissue sections against GLP-1R. The staining results are presented in Figure 6. Few GLP-1R–positive signals were present on healthy myocardium from the sham-operated group. As we expected, in cardiac sections adjacent to the site of the infarcted/ischemic myocardium, enhanced and predominant sarcolemmal staining of GLP-1R was observed on infarcted/ischemic myocardium at 8 h and 1 d after MI/R. The signal positivity decreased along with time and returned to a normal level at 2 wk after MI/R (Fig. 6A). Both immunohistochemical and HE staining also showed coagulative necrosis and the loss of nuclei. Apparent infiltration of neutrophils into the interstitium was observed, especially at day 3 after MI/R.
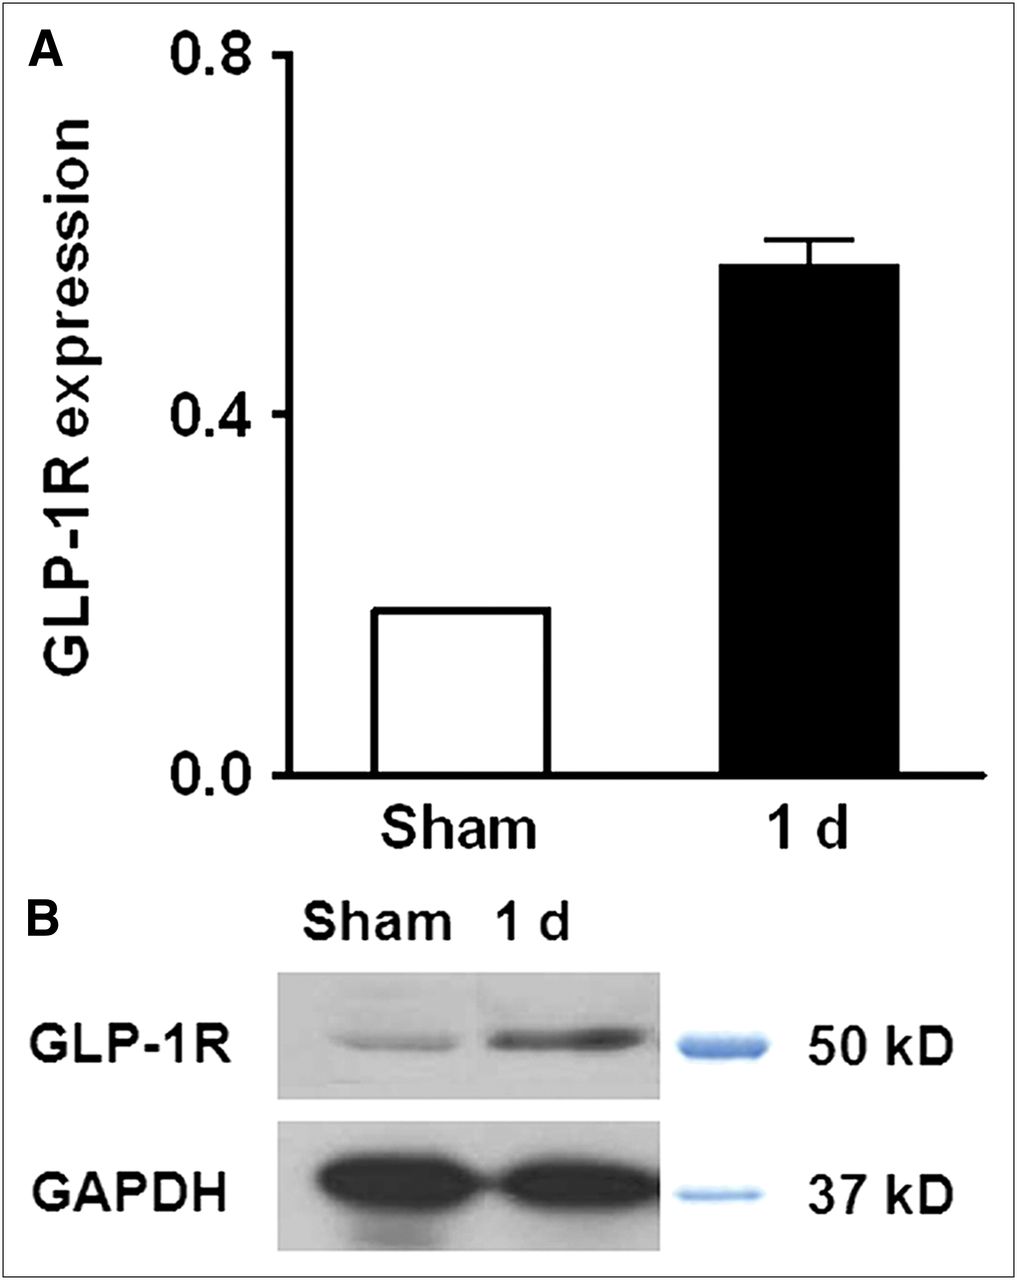
Semiquantitative analysis (A) and Western blot (B) of GLP-1R in anterolateral wall of heart from sham-operated and 1-d reperfusion groups.
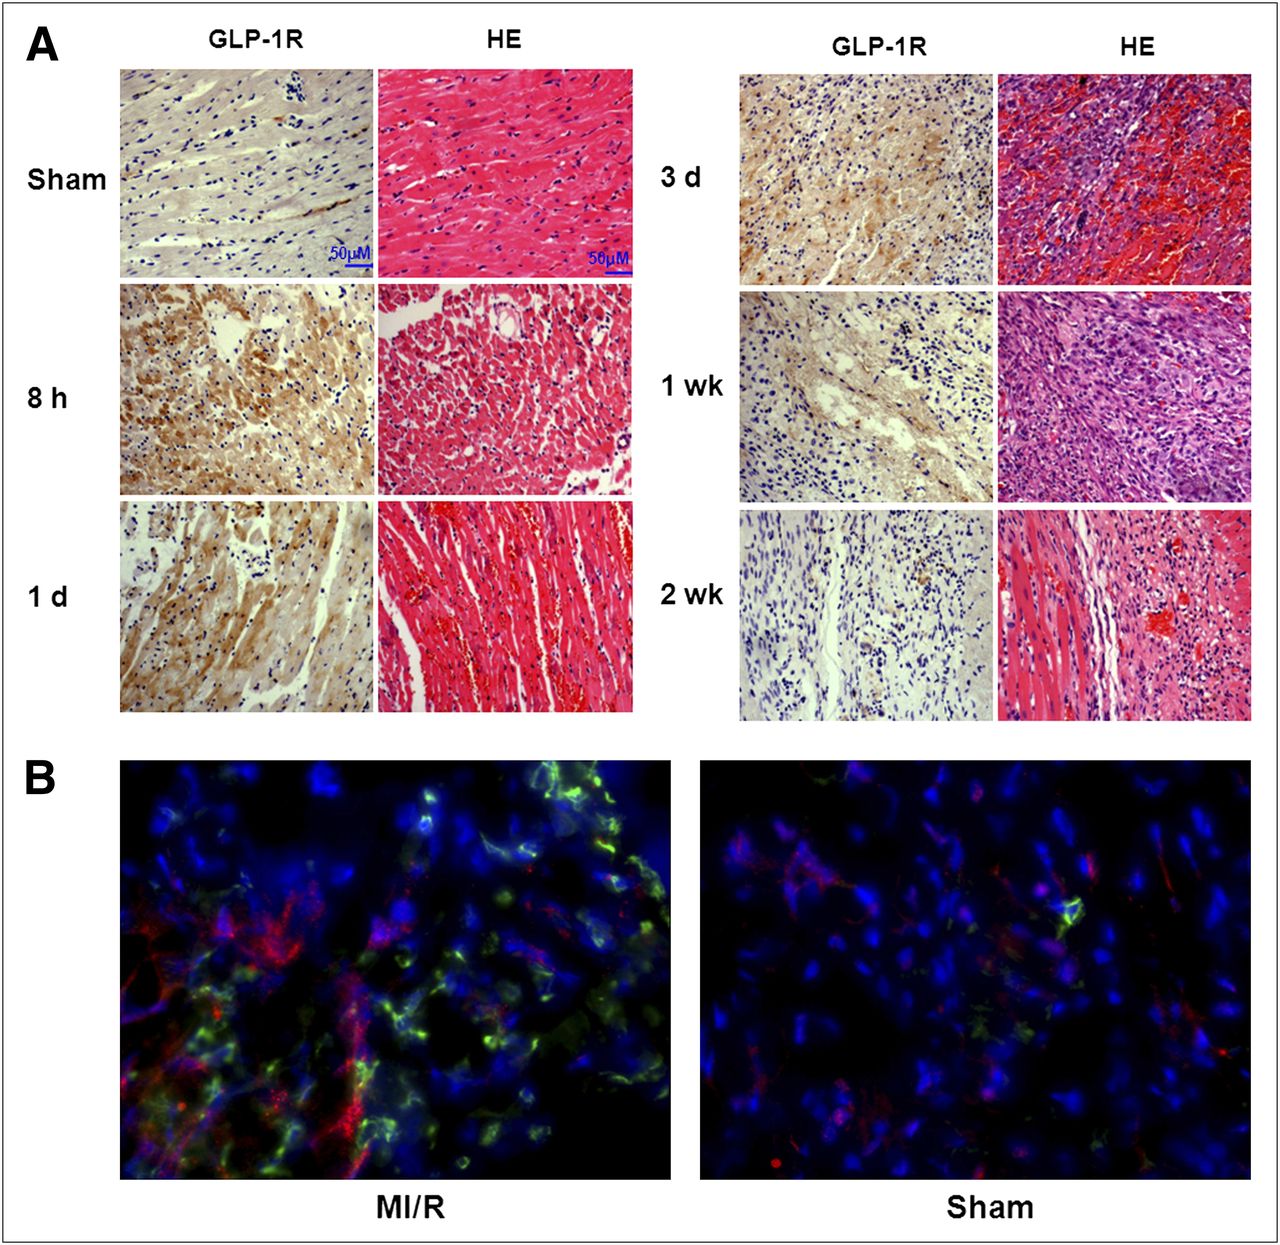
(A) Histology with HE and GLP-1R immunohistochemical analysis in normal myocardium and infarcted/ischemic myocardium at different time points after coronary occlusion and reperfusion. (B) Fluorescent immunostaining of myocardium sections with anti-GLP-1R (red) and anti-CD11b (green) antibodies. Nuclei are counterstained with 4′,6-diamidino-2-phenylindole (blue).
To further identify the target cells of GLP-1R overexpression, we costained GLP-1R and CD11b, a leukocyte marker (28). Compared with normal myocardium, the infarcted/ischemic myocardium showed apparent leukocyte infiltration as evidenced by strong green fluorescence signal (Fig. 6B). The infarcted/ischemic myocardium also showed a much stronger red fluorescence signal, indicating an overexpression of GLP-1R after MI/R. Moreover, no colocalization of GLP-1R and CD11b was identified.
DISCUSSION
GLP-1 and its analogs have been shown to exert cardiovascular effects in several experimental models and preliminary clinical trials (29–31). After acute myocardial infarction, an increased inotropic effect was noted in patients receiving GLP-1(7-36) amide infusion for up to 3 d after successful reperfusion (32). A pilot study of GLP-1 administration for 72 h in human subjects with LV dysfunction after myocardial injury and angioplasty demonstrated a reduced hospital stay and improved global and regional LV wall motion scores (32). The mechanisms through which GLP-1 can modulate cardiac function are complex and incompletely understood (10). However, it has been widely accepted that GLP-1 exerts a direct cytoprotective effect via inhibition of apoptosis directly in target cells expressing GLP-1R through both cyclic adenosine monophosphate and phosphoinositide 3-kinase pathways (10,11).
The expression of GLP-1R in the heart has been confirmed previously (9,33). However, the dynamic pattern of GLP-1R after MI/R and the following remodeling process has never, to our knowledge, been investigated. In this study, for the first time, we applied the GLP-1R–specific imaging tracer 18F-FBEM-Cys40-exendin-4 to visualize and quantify the temporal changes of GLP1-R expression in a rat myocardial ischemia/reperfusion model. Increased focal tracer retention was observed as early as 8 h after the onset of ischemia, and the tracer accumulation decreased along with time in the infarcted and periinfarct zones. At 2 wk after MI/R, 18F-FBEM-Cys40-exendin-4 uptake within the myocardium was restored to a normal level. Thus, with noninvasive molecular imaging, we revealed the kinetics of GLP-1R expression in the affected myocardium. However, the mechanism of MI/R-induced GLP-1R upregulation is still unclear and will need further investigation. Western blot confirmed that protein level increased after MI/R. The membrane presentation of the receptor may also be affected at the same time (34).
Besides early-stage infarcted/ischemic myocardium, the lung region also showed a high level of 18F-FBEM-Cys40-exendin-4 accumulation, mainly because of a high level of GLP-1R expression (9). With the coinjection of an excess amount of unlabeled exendin-4 peptide, tracer uptake in the lung was blocked significantly (Fig. 3C), indicating that the lung accumulation of 18F-FBEM-Cys40-exendin-4 was GLP-1R–specific. No apparent change of uptake value in the myocardium was observed at any of the time points examined in either the sham-operated group or the MI/R rats. Lungs and kidneys of humans express significantly lower levels of GLP-1 receptor than those of rats and mice (35). However, the observed high level of uptake in the lung region may compromise any potential translation of the GLP-1R–specific tracer to the clinic. This problem can be addressed by adjunctive scans of either anatomy or myocardial perfusion to identify the location of the heart. We also noticed that the surgical wound showed increased tracer uptake that cannot be blocked with unlabeled exendin-4. Thus, the elevated uptake in the surgical wound may result from increased blood flow and vascular permeability during tissue remodeling and an inflammatory reaction.
Transient ischemia for up to 20 min resulted in increased 18F-FDG uptake in the ischemic segment due to a metabolism switch (36). In this study, we occluded a coronary artery for 45 min and found that the infarcted/ischemic segment showed decreased 18F-FDG uptake as illustrated in Figure 2A. At 3 d after MI/R, we observed increased 18F-FDG uptake in the infarcted/ischemic area (data not shown). Apparent infiltration of neutrophils was observed at the 3-d and 1-wk time points, possibly accounting partially for the increased 18F-FDG uptake because inflammatory cells such as activated granulocytes, lymphocytes, and macrophages have enhanced glycolysis (37). In a recent study, Lee et al. (38) observed significantly increased 18F-FDG uptake in the myocardium of infarcted mice at day 5 after coronary ligation, compared with the control mice. They also confirmed that within subacutely infarcted myocardium, 18F-FDG accumulated mostly in monocytes or macrophages. Unlike 18F-FDG, infarcted/ischemic myocardium showed significantly lower 18F-FBEM-Cys40-exendin-4 uptake at day 3, compared with 8 h and day 1 after MI/R, indicating that GLP-1R upregulation is likely independent of an inflammatory reaction during tissue remodeling. No colocalization of GLP-1R and CD11b further excluded the involvement of infiltrated neutrophils in increased uptake of 18F-FBEM-Cys40-exendin-4 in infarcted/ischemic myocardium (Fig. 6B).
In a previous study, we performed longitudinal PET using 18F-AlF-NOTA-PRGD2 to monitor quantitatively integrin αvβ3 changes after MI/R (39). Focal accumulation of 18F-AlF-NOTA-RGD2 in the infarct area started at day 3 and reached a plateau between 1 and 3 wk. Even after 4 mo, the focal accumulation remained at a higher level than in the sham group. The similar distribution pattern of arginine-glycine-aspartic acid––based tracer in models of myocardial ischemia has been observed by other groups (40,41). In contrast, 18F-FBEM-Cys40-exendin-4 showed a dramatically different uptake pattern. At 1 wk after MI/R, the localized signal was already low and was reduced to a normal level at 2 wk after MI/R.
These results imply that therapy with GLP-1 and its analogs will be more effective at early time points after MI/R, when the receptor expression is at a relatively high level. After 2 wk, the therapeutic effect may be compromised because of low receptor expression. Indeed, several reported therapy protocols all involved the administration of GLP-1R agonists at the early stage of acute cardiac infarction (29,32). The cardioprotective effect of GLP-1 has been observed in transgenic mice without GLP1-R expression, indicating that a GLP-1R–independent pathway exists (9). An improved LV function was observed in patients with chronic heart failure after a 5-wk continuous subcutaneous infusion of GLP-1(7-36) (31). However, the GLP-1R expression in myocardium with chronic heart failure needs further investigation to better clarify the cardioprotective pathways involved.
CONCLUSION
PET using 18F-FBEM-Cys40-exendin-4 allows the longitudinal noninvasive visualization of GLP-1R upregulation induced by ischemia–reperfusion. After MI/R, the GLP-1R rapidly increases over the first 8 h and then slowly returns to baseline over the subsequent 7 d. The imaging results will be helpful to better understand the mechanism of the cardioprotective effect of GLP-1 and its analogs. In addition, it also can provide guidance to optimize the time frame of therapeutic intervention.
DISCLOSURE STATEMENT
The costs of publication of this article were defrayed in part by the payment of page charges. Therefore, and solely to indicate this fact, this article is hereby marked “advertisement” in accordance with 18 USC section 1734.
Acknowledgments
This project was supported, in part, by the National Basic Research Program of China (973 program, 2013CB733802), the National Science Foundation of China (NSFC) (81028009, 81100234), the Chinese Academy of Sciences professorship for Senior International Scientists (2011T2J06), and the Intramural Research Program of the National Institute of Biomedical Imaging and Bioengineering (NIBIB), the National Institutes of Health (NIH). No other potential conflict of interest relevant to this article was reported.
Footnotes
↵* Contributed equally to this work.
Published online Nov. 8, 2012.
- © 2012 by the Society of Nuclear Medicine and Molecular Imaging, Inc.
REFERENCES
- Received for publication July 13, 2012.
- Accepted for publication July 24, 2012.


Jump to section
Related Articles
Cited By...
- No citing articles found.