


Abstract
Therapy of cancer, including basallike breast tumors, that targets the epidermal growth factor receptor (EGFR) would greatly benefit from noninvasive methods that can quantitatively monitor receptor status and treatment response. Methods: Here, we investigated the potential of a novel technique based on streptavidin cadmium selenide/zinc sulfide quantum dots (Qdots) multiplexed with polyethylene glycol (PEG), epidermal growth factor (EGF), and 99mTc-hydrazinonicotinamide. In vitro binding affinity and specificity were evaluated in cultured cells. Biodistribution studies and in vivo imaging were performed in murine breast tumor xenografts of basallike phenotype MDA-MB-468 cells and EGFR-negative cells. Results: 99mTc-hydrazinonicotinamide EGF-PEG-Qdot showed specific and high-affinity EGFR targeting on confocal microscopy, immunoblotting, and binding assays. When intravenously injected, MDA-MB-468 tumors were visualized with high contrast by both optical and scintigraphic imaging. Scintigraphic image–based quantification correctly discriminated high–EGFR-expressing MDA-MB-468 tumors from other tumors, and image-based tumor uptake closely correlated to EGFR content. Importantly, serial imaging of MDA-MB-468 tumors responding to cetuximab therapy could detect a significant reduction of tumor uptake that was paralleled by downregulation of EGFR expression. Furthermore, high baseline uptake predicted good response to cetuximab therapy. Conclusion: 99mTc-hydrazinonicotinamide EGF-PEG-Qdot provides EGFR-targeted imaging of breast tumors and may allow noninvasive monitoring of EGFR status in living subjects before and after targeted therapies.
Epidermal growth factor receptors (EGFRs) play a key role in tumor growth, invasion, and metastasis (1–3) and have become a promising therapeutic target in many cancers (4,5). Breast carcinoma is the most common cancer in women and a major cause of mortality, accounting for 7% of all cancer-related deaths. EGFR is overexpressed in up to 35% of breast cancers and is associated with poorer prognosis (6,7). Recent data suggest potential benefits of EGFR-targeted agents not only for treating breast tumors but also for lowering their progression rate (8). The efficacy of targeted therapy depends on the expression status of the molecule being aimed for, and lessons from clinical trials with EGFR antagonists have illuminated the critical importance of this factor in selecting patients most likely to respond (4,5).
Molecular profiling work on breast tumors identifies a distinct and highly malignant subtype called basallike breast cancer, which is linked with higher tumor grade, more frequent metastasis, and poor clinical outcome (9,10). This subgroup, with its characteristic molecular signature of negative estrogen/progesterone/HER2 receptor expression and positive EGFR expression, represents breast tumors that could most likely benefit from EGFR-targeted therapy because they lack other receptor drug targets (9,11,12). The presence and level of EGFR expression is being used as an effective biomarker in many clinical studies. However, whereas limitations of conventional biopsy-based methods (4) stress the need for newer image-based approaches, efforts to date have largely been unable to provide a reliable and quantitative method of monitoring tumor EGFR expression in living subjects.
In this study, we developed a novel imaging technique and investigated its ability to quantitatively monitor EGFR expression in breast tumors of basallike phenotype MDA-MB-468 cells (13) and EGFR-negative MDA-MB-435 cells. The probe was based on a quantum dot (Qdot) platform surface-coated with streptavidin to which human epidermal growth factor (EGF) peptides were attached via N-terminal specific monoconjugation of biotinylated polyethylene glycol (PEG). Scintigraphic imaging was achieved by 99mTc-hydrazinonicotinamide conjugation to amine residues of the streptavidin. After in vitro assessment of EGFR binding characteristics, 99mTc-hydrazinonicotinamide–Qdot–PEG–EGF was investigated for its ability to assess EGFR expression in tumor-bearing mice before and after targeted therapy with cetuximab.
MATERIALS AND METHODS
EGF-PEG-Qdot Synthesis and 99mTc-Hydrazinonicotinamide Labeling
Human EGF (53 amino acids, 6.2 kDa; Cell Sciences) was conjugated to a single PEG molecule site-specifically on the N-terminal amine using slightly acidic conditions (14). This technique minimizes structural heterogeneity and influence on binding affinity associated with random conjugation. Briefly, EGF was mixed with biotin-PEG succinimidyl ester (molecular weight, 5,000; NANOCS) in 100 mM sodium acetate (pH 5.5) at 1:1 molar ratio and incubated overnight at room temperature (RT). EGF-PEG-biotin was then attached to streptavidin-coated Qdot (655 nm; Invitrogen) (1 μM in 30 μL) by 30-min incubation at RT at a 90:1 molar ratio in 50 mM sodium phosphate buffer (pH 8.0) with shaking. Unbound reagents were removed by a protein desalting spin column (molecular cutoff, 7,000). Qdot surface streptavidin was radiolabeled by conjugation with 20 μL of hydrazinonicotinamide (1 mg/mL) at RT with shaking, followed by incubation with 370 MBq of 99mTc in 100 μL of saline and 12 μL of tin-tricine solution at 25°C for 1 h. 99mTc-EGF-PEG-Qdot was purified by a PD-10 column.
Transmission Electron Microscopy
A drop of EGF-PEG-Qdots or control Qdots in distilled water were placed on a Formvar-coated copper grid, allowed to dry for 1–2 h, and imaged by a Tecnai G2 Field Emission Transmission Electron Microscope (FEI Co.). Magnifications of 100,000- to 315,000-fold were used, and size analysis was performed on captured digital images using Image J V. 1.34s (http://rsb.info.nih.gov/ij/).
Confocal Microscopy and Cell Binding Assays
MDA-MB-468 and MDA-MB-435 human breast cancer cells and A431 lung cancer cells were purchased from the American Type Culture Collection and maintained in 5% CO2 at 37°C in Lewivovits-15 medium or high glucose Dulbecco modified Eagle medium (Lonza) supplemented with 10% fetal bovine serum, 2 mM L-glutamine, 100 U of penicillin per milliliter, and 100 mg of streptomycin per milliliter.
To visualize probe binding, cells on a Histobond adhesion microscope slide were fixed with 4% paraformaldehyde, incubated with EGF-PEG-Qdot or Alexa Fluor 488 EGFR antibody for 1 h, washed, and mounted with an antifade 4′,6-diamidino-2-phenylindole kit (Invitrogen). Cells were imaged with a Radiance 2100 confocal laser scanning microscope (Bio-Rad Inc.) using Lasersharp 2000 (Bio-Rad Inc.) and 543-nm excitation and 660-nm emission filters. Probe localization and EGFR staining in tumor cryosections were similarly evaluated.
For competitive binding analysis, cells were incubated with 54 kBq of 99mTc-EGF-PEG-Qdots (final concentration, ∼0.5 nM) for 1 h at 37°C in Dulbecco–phosphate-buffered saline and 1% bovine serum albumin. After they were washed with phosphate-buffered saline, cells were lysed with 0.5 mL of 0.1N NaOH and measured for radioactivity on a high-energy γ-counter. Binding specificity was assessed using cold EGF or an EGFR-blocking antibody. The 50% inhibitory concentration was assessed with graded concentrations of cold EGF using Prism software (version 3.02; GraphPad Software Inc.).
EGFR Immunoblotting
Extracted protein was separated by 10% sodium dodecyl sulfate polyacrylamide gel electrophoresis and transferred to a nitrocellulose membrane. After incubation with monoclonal antibodies against EGFR (rabbit) or phospho-EGFR (mouse; Tyr1068; Cell Signaling Technology, Inc.) at 4°C overnight, followed by incubation with secondary antibodies at RT for 1 h, immunoreactive protein was detected with chemiluminescence and quantified using a GS-800 densitometer and Quantity One software (Bio-Rad Laboratories).
In Vivo Pharmacokinetics and Biodistribution Studies
All animal experiments were in accordance with the National Institutes of Health Guide for the Care and Use of Laboratory Animals (15) and approved by the institutional committee. Tumor models were prepared in BALB/c nude mice by subcutaneous injection of 1 × 10⁸ cells into the right shoulder. MDA-MB-468 cell xenografts were used as a model for high–EGFR-expressing basallike breast cancers. Xenografts of mixed MDA-MB-468 and MDA-MB-435 cells (3:1 ratio) and MDA-MB-435 cells were used as intermediate– and low–EGFR-expressing breast tumor models, respectively. Experiments were performed when tumor diameter reached approximately 1.0 cm.
Pharmacokinetic analysis was performed in normal imprinting control region (ICR) mice intravenously injected with 1.1 MBq of 99mTc-EGF-PEG-Qdots. Blood collected from the tail vein was measured for radioactivity, and parameters of half-life, clearance, and volume of distribution were calculated. Early distribution and late clearance rate constants (K1 and K2) and half-lives (T1/2α and T1/2β) were derived by nonlinear regression fitting of the time–activity curve with a 2-phase exponential decay equation using Prism software (version 3.02). Biodistribution studies were performed in MDA-MB-468 tumor–bearing mice intravenously injected with 18.5 MBq of 99mTc-EGF-PEG-Qdots. Major organs and tumor were extracted at 4 h, weighed, and measured for radioactivity.
Cetuximab Therapy and Tumor Response Measurement
Tumor-bearing mice were treated with intraperitoneal administration of cetuximab (Merck Korea) at a dose of 1 mg per mouse or saline (controls) on days 0, 3, and 6 (16). Tumors were measured daily by a caliper and calculated for tumor volume with the widely used modified ellipsoidal formula (17): tumor volume (mm3) = length × width2 × 1/2. Change in tumor size was expressed as percentage volume, compared with that at day 0.
In Vivo Optical and Scintigraphic Imaging
In vivo fluorescence imaging of mice was performed with an IVIS Spectrum imaging system (Xenogen; 605-nm excitation, 660-nm emission) at 4 h after injection of 10 μM EGF-PEG-Qdot in a volume of 200 μL. Ex vivo optical images of tumors and major organs were obtained after extraction from sacrificed animals.
Scintigraphic imaging was performed in tumor-bearing mice the day before initiating cetuximab therapy (baseline) and again at 3 d after the last treatment dose (after therapy). Animals were injected via the tail vein with 18.5 MBq of 99mTc-EGF-PEG-Qdots and imaged 4 h later under isoflurane anesthesia. Imaging at 4 h after injection was chosen because preliminary experiments between 1 and 4 h showed the best tumor contrast at this time. Imaging was performed on a γ-camera (Trionix Research Laboratory) with an intrinsic spatial resolution of less than 3.8 mm in full width at half maximum, equipped with a 2-mm aperture pinhole collimator. A 15% energy window centered around 140 keV was used, and 15-min image data were stored on a 256 × 256 pixel matrix. Regions of interest were drawn on the tumor and on the contralateral limb to obtain image-based tumor-to-background (T/B) ratios of activity.
Statistical Analysis
Data are presented as mean ± SD unless otherwise specified. Significance of difference between multiple groups was determined by 1-way ANOVA with post hoc Bonferroni multiple comparison tests. Correlation was evaluated by linear regression analysis.
RESULTS
EGF-PEG-Qdot Preparation and In Vitro EGFR Targeting
Preparation of 99mTc-EGF-PEG-Qdots (Fig. 1A) was straightforward and reproducible. Biotin-PEG served both as linker for Qdot attachment and flexible spacer to allow receptor binding without steric hindrance. Radiolabeling with 99mTc-hydrazinonicotinamide was achieved with high radiochemical yield and specific activity. The Qdots are typically surface-conjugated with 5–10 streptavidins, which are tetramers with a biotin binding site on each subunit. Because only a portion of these sites is expected to be available for biotin binding, there may be somewhere around 10 EGF-PEG molecules attached to each Qdot. Similarly, a comparable number of hydrazinonicotinamide molecules, which attach to lysine residues present in streptavidin, may be attached to each Qdot. Transmission electron microscopy displayed approximately 15-nm particles without clustering (Fig. 1A).

Probe characterization. (A) Scheme of 99mTc-hydrazinonicotinamide EGF-PEG-Qdots (left) and transmission electron microscopy findings (right). Probe is composed of streptavidin-coated Qdot platform multiplexed with PEG-biotin monoconjugated EGF and 99mTc-hydrazinonicotinamide. Transmission electron microscopy shows similar 10- to15-nm size and morphology of control Qdots (top) and EGF-PEG-Qdots (bottom). (B) Immunoblots of MDA-MB-468 cells show increased phosphorylation of EGFR by stimulation with 5 nM human EGF or EGF-PEG-Qdot but not control PEG-Qdot. HYNIC = hydrazinonicotinamide; Sav = streptavidin.
Treatment of MDA-MB-468 cells with 5 nM EGF-PEG-Qdot for 2 min caused phosphorylation of cellular EGFR, with potency comparable to that of free EGF peptides (Fig. 1B). This property should be beneficial for imaging because internalization of the activated ligand–receptor complex can facilitate probe accumulation.
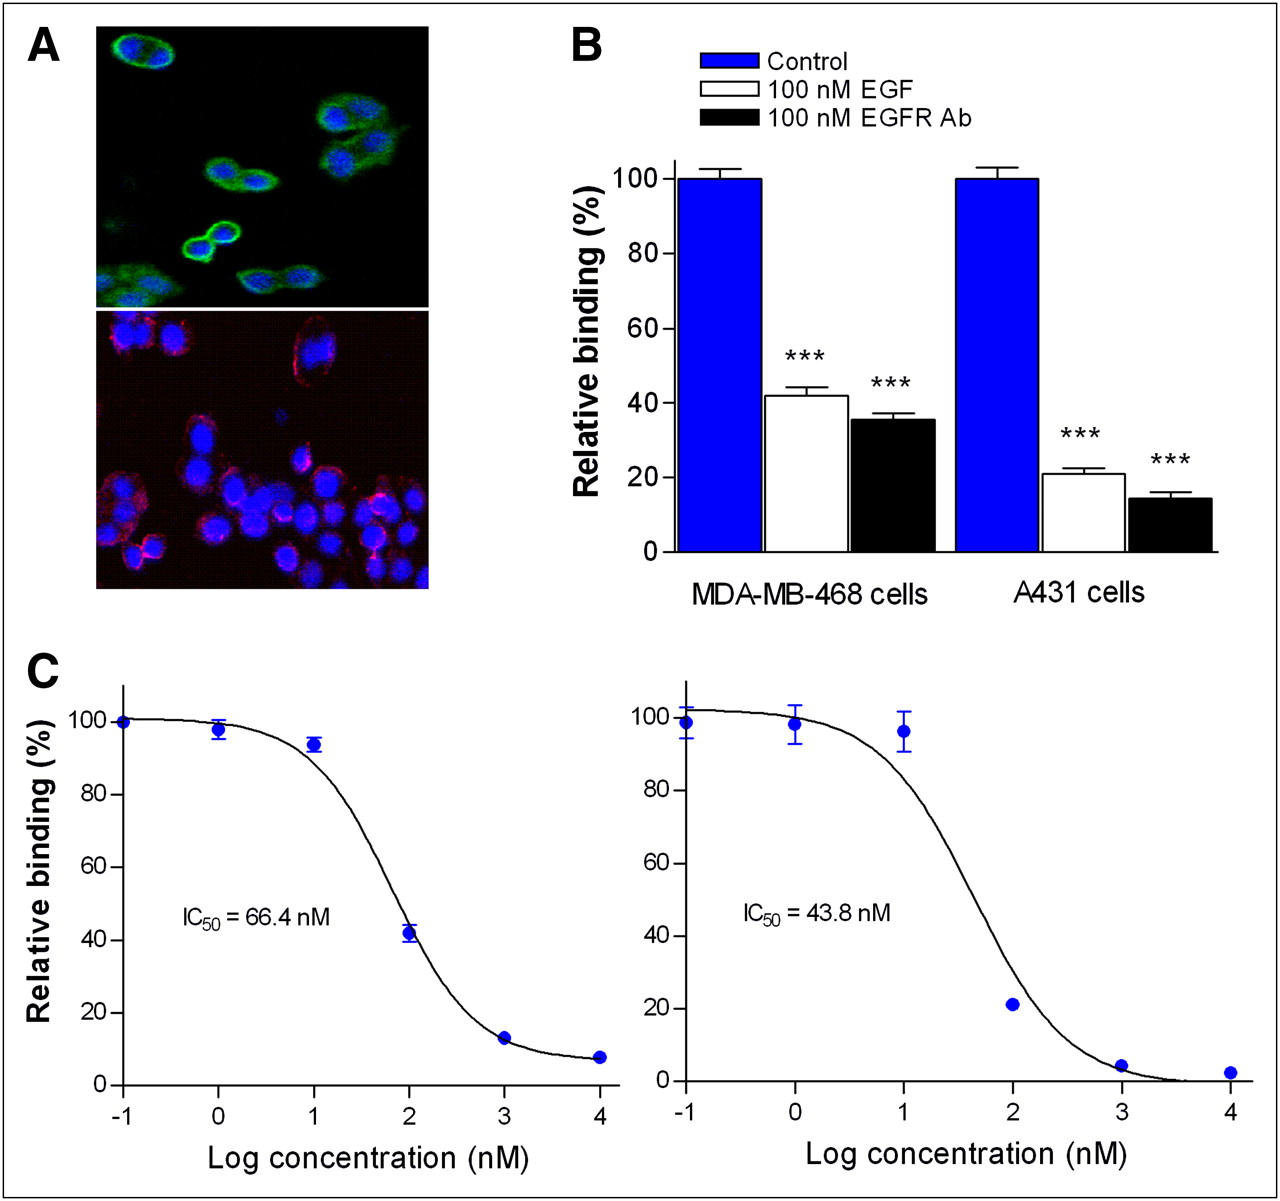
Confocal microscopy visualized direct binding of EGF-PEG-Qdots to MDA-MB-468 cell surface, in a fashion similar to fluorescent anti-EGFR antibodies (Fig. 2A). Cell binding analysis confirmed receptor specificity of probe binding that was reduced 58.1% ± 2.4% by 100 nM cold EGF and 64.5% ± 1.7% by 100 nM anti-EGFR-blocking antibody in MDA-MB-468 cells, and 78.9% ± 1.4% and 85.7% ± 1.7%, respectively, in A431 lung cancer cells (Fig. 2B). Competitive binding assays showed high-affinity binding to both MDA-MB-468 and A431 cells (Fig. 2C). These results confirm that EGF attached via N-terminal monoconjugated PEG to 99mTc-hydrazinonicotinamide–labeled Qdots retains specific and high-affinity binding to functional EGFR.

In vitro EGFR binding. (A) Confocal microscope of 4′,6-diamidino-2-phenylindole–stained (blue) MDA-MB-468 cells show cell surface binding of fluorescent anti-EGFR antibodies (green; top) and EGF-PEG-Qdots (red; bottom). (B) Specific binding of 99mTc-hydrazinonicotinamide EGF-PEG-Qdots to MDA-MB-468 and A431 cells was demonstrated by excess cold EGF or EGFR-blocking antibody (Ab). (C) Competitive binding of 99mTc-hydrazinonicotinamide EGF-PEG-Qdot with graded concentrations of cold EGF in MDA-MB-468 (left) and A431 cells (right). All results are mean ± SD from single representative experiment of 2 experiments done in triplicate. ***P < 0.001, compared with uninhibited controls by 1-way ANOVA. IC50 = 50% inhibitory concentration.
Pharmacokinetics and In Vivo Tumor Targeting of EGF-PEG-Qdots
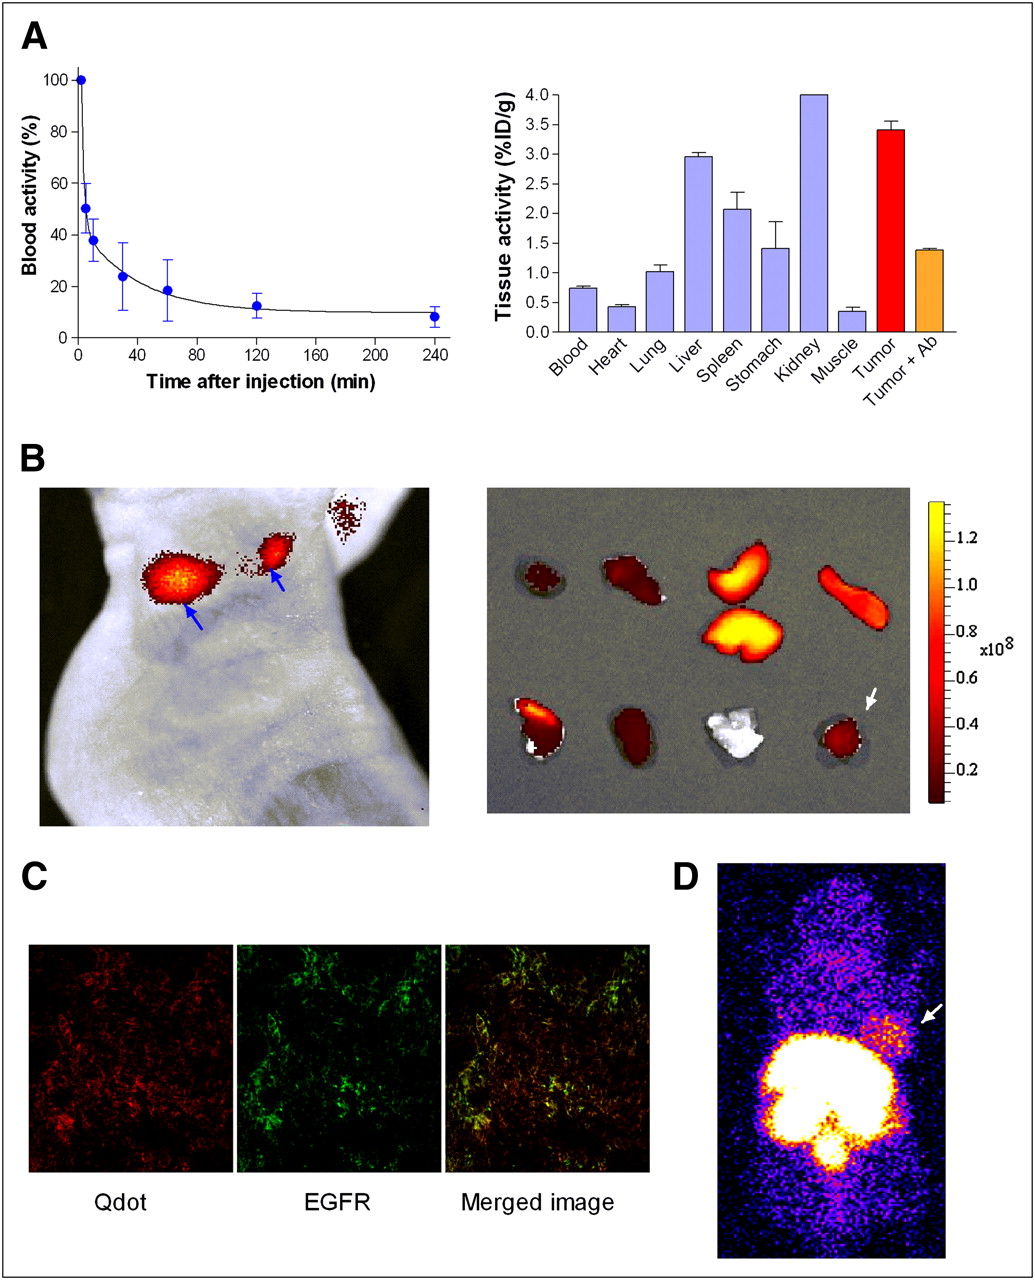
Intravenously injected 99mTc-EGF-PEG-Qdots in normal mice displayed a biexponential profile of blood clearance with early distribution (K1) and late clearance rate constants (K2) of 0.598 and 0.026 min−1, respectively (Fig. 3A, left). Circulation T1/2α was 1.2 min and T1/2β was 26.6 min, the volume of distribution was 31.46 mL, and clearance was 1.18 mL/min.

Enhanced in vivo kinetics and tumor-targeted imaging. (A) Blood activity kinetics (left) and biodistribution at 4 h (right) after 99mTc-hydrazinonicotinamide EGF-PEG-Qdot injection. Blood activity data are mean ± SD of percentage initial activity in 5 normal ICR mice. Biodistribution data are mean ± SD of 2 MBA-MB-468 tumor mice with 2 separate animals for blocking data, and results show high tumor uptake that was inhibited by blocking antibody (Tumor+Ab). (B) In vivo fluorescent image at 4 h (left) and ex vivo fluorescent image of tissues of same animal (right). In vivo EGF-PEG-Qdot accumulation is seen in 2 MDA-MB-468 tumor nodules (arrows). Ex vivo tissues from top left to bottom right are heart, lung, liver, spleen, stomach, kidney, muscle, and tumor (arrow). (C) Confocal microscope of cryosection from tumor in B shows EGF-PEG-Qdots (left), fluorescent antibody–stained EGFR (middle), and colocalization of 2 signals on merging (right). Magnification, ×400. (D) Scintigraphic images 4 h after 99mTc-hydrazinonicotinamide EGF-PEG-Qdot injection displaying high-contrast MDA-MB-468 tumor uptake (arrow).
Biodistribution of 99mTc-EGF-PEG-Qdot in MDA-MB-468 tumor–bearing nude mice at 4 h revealed high tumor accumulation that reached 3.41% ± 0.15% injected dose per gram of tissue (%ID/g; Fig. 3A, right). This was a level 4.6-fold greater than blood and 9.8-fold greater than muscle activity. Remarkably, tumor uptake exceeded even that of liver tissue (2.96 ± 0.07 %ID/g)—an unexpected finding given the prominent reticuloendothelial system phagocytosis and uptake of most Qdot particles. Specificity of tumor targeting was demonstrated by inhibition experiments with preinjection of EGFR-blocking antibody, which caused a 59.3% ± 0.7% reduction in tumor uptake (P < 0.005; Fig. 3A, right). Stomach and thyroid activity was low (not shown), indicating that there is no significant in vivo release of free 99mTc from the probe.
In vivo optical imaging of MDA-MB-468 tumor–bearing mice 4 h after EGF-PEG-Qdot injection displayed clear visualization of tumor nodules, with strong fluorescent signals (Fig. 3B, left). This finding was corroborated by ex vivo optical imaging of extracted organ and tumor tissues (Fig. 3B, right). The tumor tissue was then microsectioned and subjected to confocal microscopic inspection, revealing that the microscopic distribution of injected Qdots in tumor corresponded to tissues expressing EGFR (Fig. 3C). Scintigraphic acquisition at 4 h after injection also displayed high-contrast tumor 99mTc-EGF-PEG-Qdot uptake (Fig. 3D). Taken together, these results provide evidence for active in vivo tumor EGFR targeting of our probe.
Tumor Images Before and After Cetuximab Treatment
On baseline 99mTc-EGF-PEG-Qdot images, T/B ratios were significantly greater in high-EGFR MDA-MB-468 tumors than in other tumors (2.19 ± 0.50 vs. 1.50 ± 0.33; P = 0.002). Hence, a T/B ratio of 1.85 had 90% sensitivity and specificity for identifying tumors with high-EGFR expression (Fig. 4A, left).
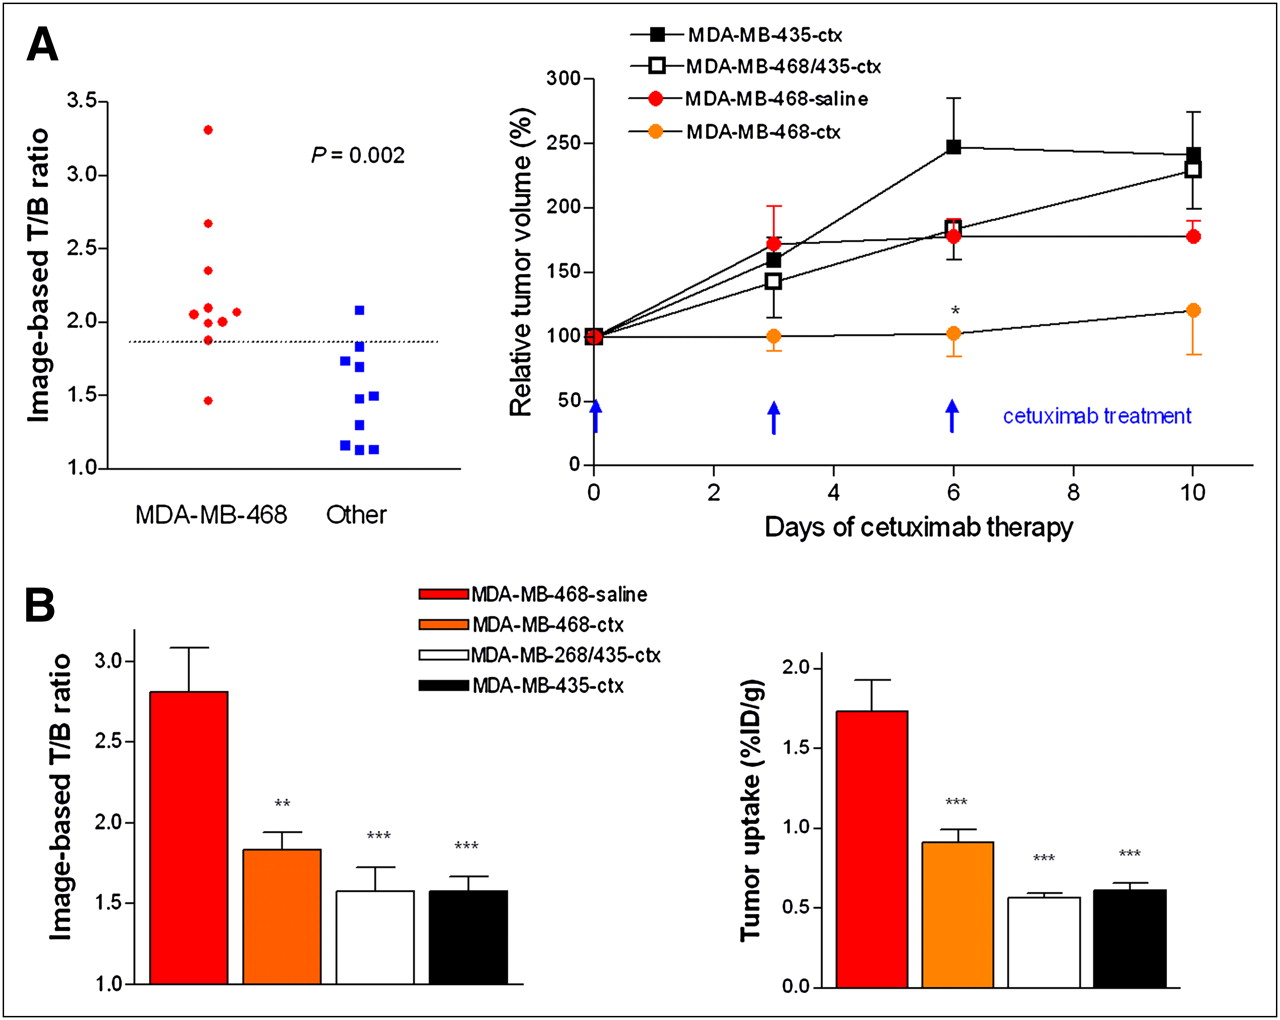
Effects of cetuximab therapy in tumor mice. (A) Baseline image–based T/B count ratios (left) and serial tumor volume in tumor groups (right). Baseline T/B ratios effectively discerned high–EGFR-expressing from low–EGFR-expressing tumors. Dotted line depicts differentiating threshold T/B ratio of 1.85. Serial tumor volumes are mean ± SE of percentage tumor volume in cetuximab- or saline-treated groups relative to that at day 0. n = 5 for each group, except for MDA-MB-468-saline group in which 1 animal died during follow-up. *P < 0.05 between MDA-MB-468-ctx and MDA-MB-435-ctx groups. (B) Image-based T/B ratios (left) and ex vivo–measured tumor uptake (right) after treatment. Bars represent mean ± SD of 4 or 5 tumors per group. **P < 0.01; ***P < 0.005, compared with MDA-MB-468-saline group by 1-way ANOVA. ctx = cetuximab.
After therapy, only the cetuximab-treated MDA-MB-468 group, compared with saline-injected MDA-MB-468 controls, showed retardation of tumor growth (Fig. 4A, right). Quantitative analysis of 99mTc-EGF-PEG-Qdot images in control MDA-MB-468 group animals showed a 49.4% increase of T/B ratio from 2.21 ± 0.31 to 2.81 ± 0.55 between baseline and follow-up scintigraphic studies. In contrast, MDA-MB-468 tumor–bearing mice treated with cetuximab displayed a significant (25.3%) reduction of T/B ratio from 2.09 ± 0.58 to 1.83 ± 0.28 during the same time (Fig. 4B, left; Supplemental Fig. 1 [supplemental materials are available online only at http://jnm.snmjournals.org]). Cetuximab treatment–induced reduction in tumor uptake was confirmed by ex vivo measurements, demonstrating a 47.2% lower uptake level for cetuximab-treated MDA-MB-468 tumors than for saline-treated controls (0.91 ± 0.18 vs. 1.73 ± 0.39 %ID/g; Fig. 4B, right).
Image Results Correlate to EGFR Expression and Cetuximab Response
Immunoblotting of EGFR levels of posttherapy tumor tissue displayed findings consistent with results of scintigraphic quantification. Thus, EGFR expression was highest in saline-injected MDA-MB-468 tumors, followed by significantly lower expression in cetuximab-treated MDA-MB-468 and MDA-MB-468/435 tumors (Supplemental Fig. 2). EGFR-negative MDA-MB-435 tumors showed undetectable levels.
In assessing the correlation of 99mTc-EGF-PEG-Qdot uptake to EGFR amount, we first confirmed that image-based T/B ratio closely correlates to ex vivo–measured tumor uptake (r = 0.89, P = 0.001; data not shown). We then showed that both image-based T/B ratio and ex vivo tumor uptake correlate well to immunoblot-measured EGFR amount (Fig. 5A). These results indicate that 99mTc-EGF-PEG-Qdot imaging can be a reliable technique for noninvasive assessment of tumor EGFR status.

Tumor uptake vs. EGFR expression and therapy response. (A) Correlation between T/B ratio (left) or ex vivo tumor uptake (right) and tumor EGFR content. (B) Correlation between T/B ratio and cetuximab response. There was significant inverse correlation between baseline T/B ratio and cetuximab response (percentage increase of tumor volume; left). Receiver-operator-characteristic curve shows high performance of high T/B ratios (>1.7) for predicting cetuximab response (<90% tumor volume increase; right). Correlations are assessed by linear-regression analysis.
Finally, we observed a significant inverse correlation between baseline T/B ratio and tumor growth rate during cetuximab therapy (Fig. 5B, left). Receiver-operator-characteristic curve analysis showed that a threshold baseline T/B ratio of 1.7 could discriminate tumors with greater growth inhibition by cetuximab with a sensitivity of 100% and specificity of 75% (area under curve, 0.8; Fig. 5B, right).
DISCUSSION
In this study, we demonstrate that quantitative scintigraphic assessment of breast tumor EGFR expression is both feasible and reliable using a 99mTc-hydrazinonicotinamide–labeled mono-PEG-EGF-Qdot probe with high-affinity receptor binding and favorable in vivo characteristics. There was close correlation between image-based tumor uptake and actual EGFR content. Importantly, basallike phenotype MDA-MB-468 breast tumors revealed a significant reduction of 99mTc-hydrazinonicotinamide PEG-EGF-Qdot uptake by cetuximab therapy that was paralleled by EGFR downregulation. Furthermore, baseline image results correlated with magnitudes of response to targeted treatment.
Molecular imaging of the global status of drug targets in living subjects could help select the right subset of patients to demonstrate the drug's true potential and limit exposure to therapies unlikely to be beneficial (18,19). Breast cancers that are negative for receptors for estrogen, progesterone, and HER2 respond unfavorably to conventional therapy, partly because of growth stimulation from overexpressed EGFR. Thus, EGFR targeting might have significant therapeutic and preventive potential for malignancies of the breast, and preliminary clinical studies have shown moderate clinical efficacy (8,12). Hence, the development of new imaging biomarkers could help advance our understanding of the mechanism of anti-EGFR therapy in breast cancer and provide longitudinal monitoring of response.
The present study demonstrates that scintigraphic imaging with EGF-labeled nanoprobes may be a useful strategy for monitoring breast tumor EGFR expression and response to cetuximab treatment. In our methods, human EGF was used as targeting ligand because peptide probes are the most suited for selective tracing of functionally active high-affinity surface receptors. Compared with antibodies, they have greater binding affinity, better tumor penetration, and more rapid blood clearance, which together result in improved T/B ratios. On the other hand, peptides are susceptible to loss of binding affinity during conjugation, have low in vivo metabolic stability, and are often cleared from the blood at excessive rates (20,21). We overcame these difficulties using a nanoparticle platform to which EGF was conjugated in a manner that minimized influence on structural and functional integrity. The use of biotin-PEG as linker to streptavidin is likely to have further enhanced the in vivo stability of EGF and may also have contributed to an improvement of in vivo kinetics of the probe.
As a platform to integrate PEG-EGF and 99mTc, we used Qdots, a new class of semiconductor optical reporters that provide a versatile nanoscale scaffold for multifunctional targeted imaging or therapy (22–24). Single-photon labeling with 99mTc allowed an imaging time window that matched well the pharmacokinetics of peptide ligands and provided sensitive detection of probe distribution. Because scintigraphic images are attained by injection of small numbers of probe molecules, 99mTc labeling also circumvented concern for toxicity issues that depend on administered Qdot dose (25).
Another difficulty for in vivo Qdot imaging is prominent hepatosplenic accumulation (22,26–28) that not only reduces target binding opportunity but also degrades overall image quality. A notable favorable kinetic property of our technique was relatively low hepatosplenic activity that contributed to high-quality tumor images. Although several factors can influence Qdot clearance, the low liver uptake of our probe could be related to passivating effects of surface PEG or hydrazinonicotinamide (29). In any case, superior binding and in vivo kinetic properties of our probe provided high-contrast tumor images that compare favorably to previous EGF-conjugated fluorophore (30–32) or Qdot (33) probes. However, scintigraphic imaging with single photon-emitting radiopharmaceuticals, compared with PET techniques, has several limitations, including lower sensitivity, resolution, and quantitative capacity.
Evidence that 99mTc-hydrazinonicotinamide PEG-EGF-Qdot images actually reflect in vivo receptor targeting was provided by localization of injected probes to regions positive for EGFR staining, inhibition of tumor uptake by EGFR-blocking antibodies, and close correlation between magnitudes of tumor uptake and EGFR content. Although immunohistochemistry is the current clinic standard for assessing receptor status, it is associated with many technical shortcomings including disparity between receptor epitope targeted by immunostaining and therapeutic drugs, sampling error, poor discrimination between low- and high-affinity receptors, and tissue-processing issues. Immunohistochemical scoring systems also lack standardization and are highly subject to interobserver variation (4). In our study, we quantified global tumor EGFR content by measuring immune reactive band intensities from protein of whole tumor tissue. As a result, both image-based T/B ratios and ex vivo measurements of tumor uptake were shown to closely correlate to EGFR expression.
Importantly, our imaging technique was able to detect alterations in EGFR expression in response to targeted therapy with cetuximab, the most commonly used anti-EGFR agent for various solid tumors including breast cancer. When we treated tumor-bearing mice with cetuximab, high–EGFR-expressing MDA-MB-468 tumors showed a significant reduction of 99mTc-PEG-EGF-Qdot uptake that was paralleled by a decrease in EGFR expression. This finding is consistent with recent reports that antibodies against EGFR not only block ligand binding but also can induce receptor internalization and lysosomal degradation, leading to EGFR downregulation (34,35). Finally, tumor 99mTc-PEG-EGF-Qdot uptake on baseline images correlated inversely to the extent of tumor growth after cetuximab therapy.
CONCLUSION
99mTc-PEG-EGF-Qdot provides high-contrast imaging of breast tumor xenografts via specific and efficient in vivo receptor targeting. Scintigraphic imaging offers noninvasive quantification of tumor EGFR content and can detect EGFR downregulation by cetuximab treatment in responsive breast tumors. These results demonstrate the encouraging potential of this imaging strategy for the noninvasive monitoring of EGFR status in living subjects before and after targeted therapies.
DISCLOSURE STATEMENT
The costs of publication of this article were defrayed in part by the payment of page charges. Therefore, and solely to indicate this fact, this article is hereby marked “advertisement” in accordance with 18 USC section 1734.
Acknowledgments
This work was supported by a grant from the National R&D Program for Cancer Control, Ministry of Health & Welfare, Republic of Korea (grant number 0720190-2). No other potential conflict of interest relevant to this article was reported.
Footnotes
Published online Aug. 17, 2011.
- © 2011 by Society of Nuclear Medicine
REFERENCES
- Received for publication January 7, 2011.
- Accepted for publication May 4, 2011.


