


Abstract
Imatinib mesylate is a tyrosine kinase inhibitor that was approved by the U.S. Food and Drug Administration in 2001 for treatment of many different stages of chronic myeloid leukemia and in 2002 for treatment of gastrointestinal stromal tumors. Imatinib is known to inhibit the dysregulated proliferation of chronic myeloid leukemia, which is associated with the Bcr-Abl kinase; in gastrointestinal stromal tumors, imatinib is known to act via c-Kit kinase inhibition. The objective of this study was to synthesize an 18F-labeled analog of imatinib not as a primary imaging agent but rather as a tracer for in vivo drug distribution and tracer concentration that can be used as a PET imaging surrogate for imatinib. Methods: Molecular modeling studies based on the crystal structure of imatinib bound to the active site of Abl were performed for designing the fluorinated analog. A 2-fluoroethyl analog of imatinib (SKI696) was synthesized using well-established procedures. The selectivity and binding affinity of SKI696 were compared with those of imatinib in vitro. Mice bearing K562 tumor xenografts, which are known to overexpress Bcr-Abl, were imaged with 18F-SKI696 PET. A biodistribution study was also performed on K562 tumor–bearing mice to which our radiolabeled tracer was administered. Results: The kinase assay verified that imatinib and SKI696 bind to the same targets with similar affinities. The feasibility of using 18F-SKI696 as a PET agent was examined in vivo, and 18F-SKI696 PET was shown to visualize K562 tumor xenografts in nude mice. The tumor was visible on PET 1 h after injection, with uptake of 1% of the injected dose. Biodistribution studies in K562-bearing mice were also performed, and the uptake of 18F-SKI696 (percentage injected dose per gram) for each organ was calculated. Conclusion: The results of the binding assay showed that SKI696 has selectivity and binding affinity comparable to imatinib. Small-animal PET of K562 tumor–bearing mice using 18F-SKI696 as a PET agent displayed promising tumor uptake and tumor-to-nontarget contrast. Because 18F-SKI696 has been taken up in vivo by tumors that overexpress Bcr-Abl, we are exploring a possible role for identifying tumors that will respond to imatinib before therapy.
Gleevec (imatinib mesylate; Novartis International AG) is a tyrosine kinase inhibitor that was approved by the U.S. Food and Drug Administration in 2001 for the treatment of chronic adult myelogenous leukemia, in 2002 for the treatment of gastrointestinal stromal tumor, and in 2003 for the treatment of pediatric chronic myeloid leukemia. Imatinib is currently under investigation in numerous clinical trials for other malignancies such as advanced breast (NCT00372476, NCT00323063), hormone-refractory prostate (NCT00427999), and ovarian carcinomata (NCT00840450, NCT00928642) as either a monotherapy agent or in combination therapies with other drugs, including docetaxel, capecitabine, and sorafenib.
Imatinib has been shown to inhibit multiple tyrosine kinases, including Bcr-Abl, c-Kit, and platelet-derived growth factor receptor (PDGFRα) (1). The Bcr-Abl protein is a dysregulated tyrosine kinase that is present in 95% of all chronic myeloid leukemia patients; its formation is caused by a fusion oncogene called BCR-ABL (2). In the original clinical trial of imatinib in patients with chronic myeloid leukemia, 95% of patients showed a complete hematologic response and 94% of patients showed a complete cytogenetic remission of the disease (3). In contrast, most gastrointestinal stromal tumor cells have a mutation in the coding genes for KIT and in the PDGFRα domain; these mutations prompt the activation of c-Kit, which in turn results in increased tumor growth (4).
The crystal structure of imatinib in the binding pocket of Abl has been characterized and has shown that imatinib binds preferentially to the inactive conformation of the enzyme with the activation loop in the closed conformation (5). In addition, the crystal structure also revealed that any modifications made to the methyl group of piperazine should not affect binding since this part of the molecule lies outside the binding pocket (Fig. 1).
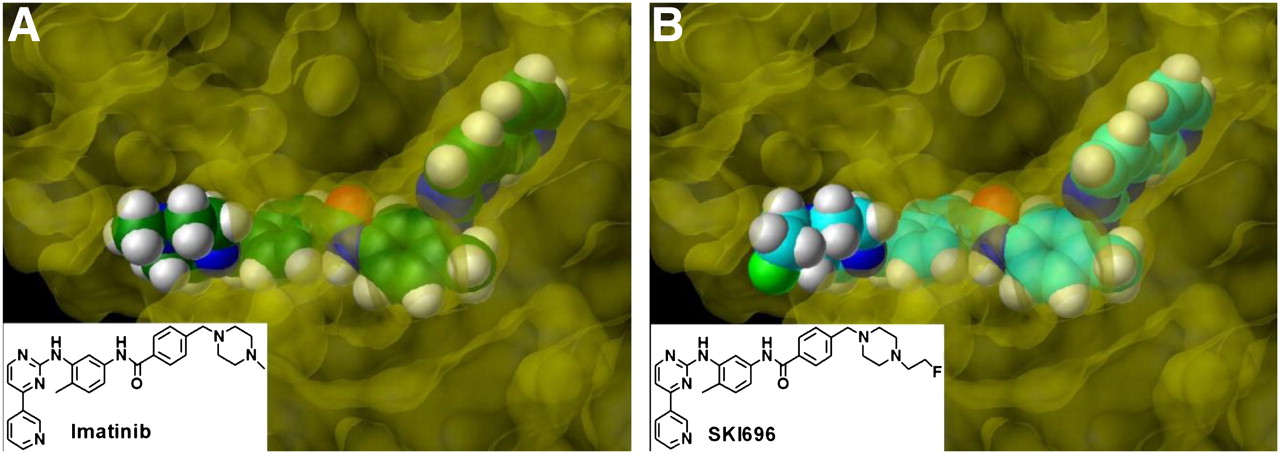
Depiction of imatinib in crystal structure of imatinib/Abl complex (5) (A) and molecular modeling of SKI696 (B) into kinase binding domain of Abl based on crystal structure. Gray = hydrogen; red = oxygen; dark blue = nitrogen; light green = fluorine; green (A) or cyan (B) = carbon.
Other groups have reported radiolabeled analogs of imatinib, with most attempting the use of 14C (6,7) or tritium (8). An 11C-imatinib analog has been synthesized and used for PET of baboons to examine the biodistribution and pharmacokinetics of imatinib (9). The plan to modify imatinib with radioactive fluorine was also pursued by Peng et al., who reported an 18F-radiolabeled derivative of imatinib that was used to measure c-Kit expression (10).
A metabolite of imatinib was reported in which the piperazinyl methyl group was replaced by a hydrogen atom; this analog was shown to maintain its activity (11). Because the loss of the methyl group does not alter the activity, that position of the molecule can be considered a potential point of chemical modification.
On the basis of these observations, the decision was made in this current study to modify the chemical structure of imatinib at the piperazinyl methyl group by substituting the methyl group with a fluoroethyl group. Confident that a modest modification at this position would not affect the binding or activity of the drug, we began synthesis of the 2-fluoroethyl derivative of imatinib (SKI-247696, SKI696). The overall goal of this study was to design a targeting agent that could be used to determine whether tumors were likely to take up imatinib before therapy, thus leading to personalized treatment for patients.
MATERIALS AND METHODS
All reagents and solvents were purchased from either Aldrich Chemical Co. or Fisher Scientific and, unless stated otherwise, were used without further purification. All high-performance liquid chromatography (HPLC) solvents were filtered (0.45-μm, nylon; Alltech) before use. Water (ultra-pure, ion-free, >18.2 MΩ·cm) was obtained from an Alpha-Q Ultrapure water system (Millipore). HPLC was performed using a system comprising a C-18 reversed-phase column (Luna analytic 4.6 × 250 mm or semipreparative 10 × 250 mm, 5 μm, 1.0 or 4.0 mL/min, 0.2% acetic acid/CH3CN; Phenomenex), 2 LC-10AT pumps (Shimadzu), an SPD-M10AVP photodiode array detector (Shimadzu), and a Flow-Count radiodetector (BioScan) equipped with a 25 × 25 mm NaI(Tl) crystal. Radioactivity was assayed using a CRC-15R dose calibrator (Capintec) or a 1480 Wizard 3″ Automatic Gamma Counter (Perkin Elmer).
No-carrier-added 18F-fluoride ion was produced by the 18O(p,n)18F transmutation by bombardment of an enriched 18O-H2O target with 11-MeV protons using a TR19/9 cyclotron (Ebco Industries).
Molecular Modeling
Molecular modeling of the crystal structure of imatinib was accomplished using the Benchware and SYBYL programs (Tripos). Original coordinate data from the protein data bank file (protein data bank code 1iep) were used to visualize the complex. The ligand coordinates were extracted and modified to incorporate various functional groups. All modified structures were minimized before being inserted into the binding pocket of the protein. The accessible surface area was then calculated as a Connolly surface, and the fit of the ligand in the binding pocket was assessed qualitatively.
Synthesis of SKI696
The synthesis of the SKI696 (Fig. 2) generally followed a known procedure of Zimmerman et al. on the synthesis of phenylaminopyrimidine derivatives as potent inhibitors of PDGFRα (12). The guanidine salt (I) was prepared from 2-amino-4-nitrotoluene condensed with cyanamide under acidic conditions (13). The pyridine analog (II) was also prepared by following a known protocol using 3-acetyl pyridine and dimethyl acetal (14). The pyrimidine core of compound III was assembled by cyclizing the guanidine salt (I) with the alkylated pyridine (II). The nitro intermediate (III) was then reduced, using a Bechamp-type reduction, to give amine (IV). Amine (IV) was coupled to the benzoic acid derivative (V) using standard coupling techniques. The tBoc protected intermediate (VI) was then deprotected using trifluoroacetic acid/methylene chloride (CH2Cl2, dichloromethane) to yield the desmethyl imatinib (VII). The piperazine nitrogen of VII was alkylated using 1-bromo-2-fluoroethane to yield the desired product, SKI696 (VIII), as a white microcrystalline solid. For further synthetic details, see the supplemental data (supplemental materials are available online only at http://jnm.snmjournals.org).
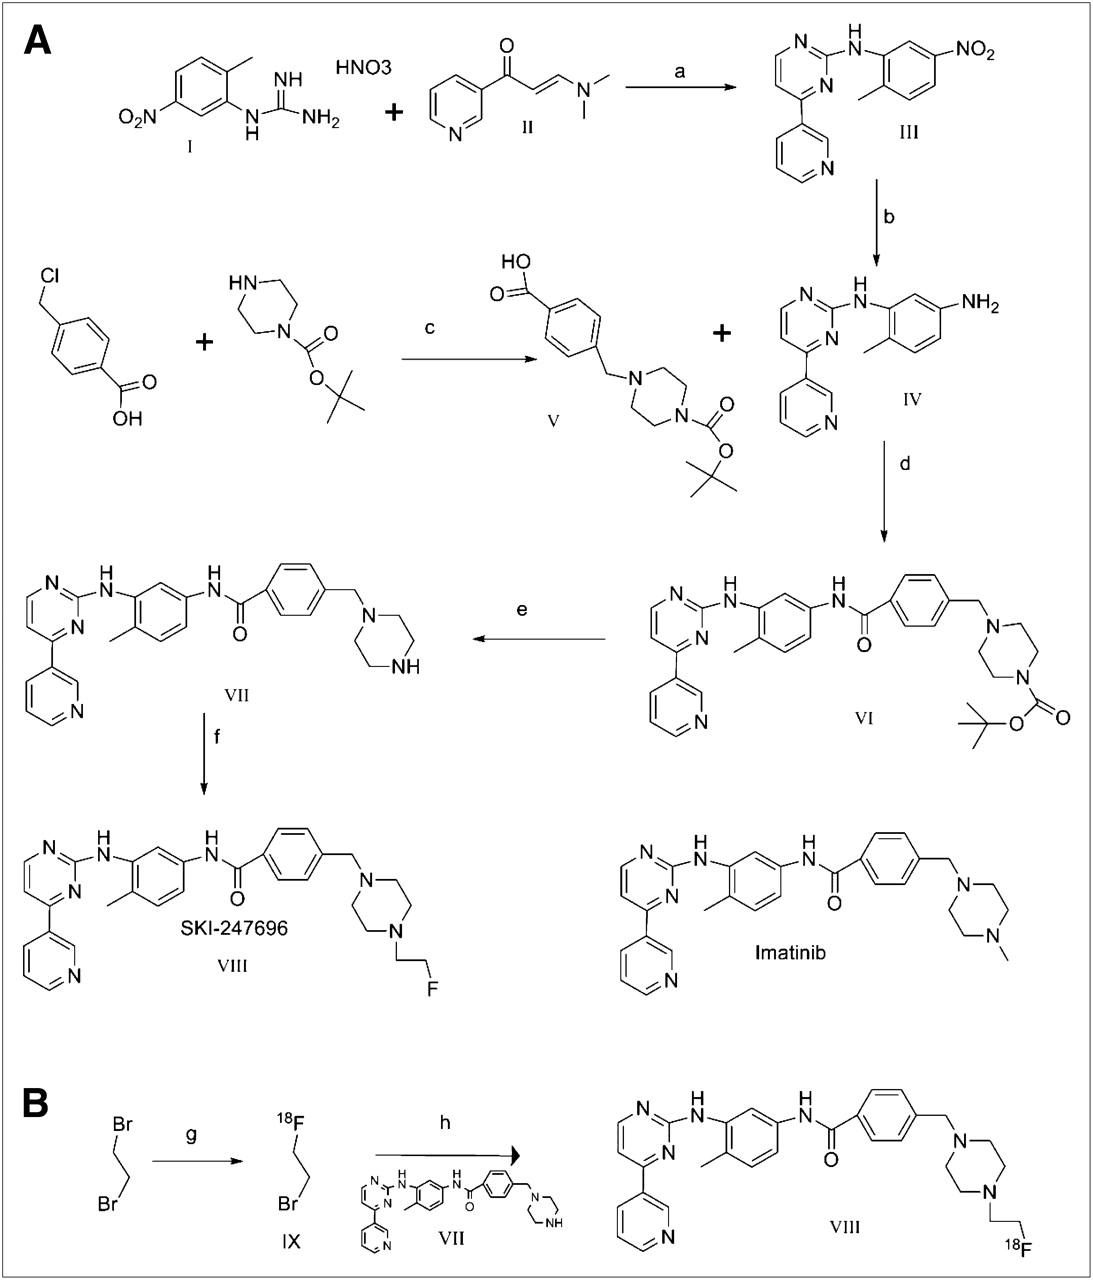
Synthesis of SKI696. (A) isopropanol/sodium hydroxide (a); iron/acetic acid/EtOH/water (b); triethyl amine/acetonitrile (c); 1-ethyl-3-(3-dimethylaminopropyl)carbodiimide hydrochloride/N,N-dimethylaminopyridine/dimethylformamide (d); trifluoroacetic acid/dichloromethane (e); potassium carbonate/acetonitrile (f). (B) 18F-KF/Kryptofix/1,2-dichlorobenzene (g); dimethylformamide/acetonitrile (h).
Synthesis of 18F-SKI696
18F-SKI696 was synthesized in a 2-step procedure. Briefly, 18F-fluoride (from 18O(p,n)18F reaction) in 18O-H2O solution was transferred to a Reacti-Vial (10 mL; Pierce) containing 80 μL of 0.25 M potassium carbonate and 15 mg of Kryptofix (40 μmol; Merck) in 1 mL of acetonitrile. Water was removed by azeotropic distillation with CH3CN (3 × 1 mL) at 100°C−105°C under a slow stream of argon. The vial was cooled to 0°C, 1,2-dibromoethane (3 mg, 16 μmol) in o-dichlorobenzene (500 μL) was added, and the reaction was heated at 105°C for 10 min. The 2-bromo-1-18F-fluoroethane formed in the Reacti-Vial was distilled at 120°C by bubbling a slow stream of argon (∼100 mL/min) into another Reacti-Vial maintained at −20°C, containing a solution of precursor VII (5 mg, 8.62 μmol), sodium iodide (9 mg; 60 μmol), and cesium carbonate (5 mg; 15.3 μmol) in 300 μL of dimethyl formamide and 200 μL of acetonitrile. The resulting solution was heated at 130°C for 60 min. The reaction mixture was allowed to cool and was diluted with 1 mL of 30% acetonitrile in water. The crude product was purified using a semipreparative HPLC column (Luna C-18, reversed phase, 250 × 10 mm, 5 μm) and eluting the product under gradient conditions with a combination of 50 mM sodium acetate/acetic acid buffer (pH ∼5.5) (A) and acetonitrile (B) as solvents at a flow rate of 4 mL/min. The gradient conditions used for purification were as follows: 0–5 min, 20% B; 5–15 min, 20%–80% B; 15–20 min, 80% B; 20–25 min, 80%–20% B; 25–30 min, 20% B. Under these conditions, 18F-SKI696 elutes with a retention time of 12.9 min. The product was collected and solvent evaporated under reduced pressure and reformulated in 0.9% saline and used for analytic HPLC and animal studies. The total synthesis time was about 135 min. The product was analyzed using analytic HPLC (Luna C-18, 250 × 4.6 mm, 5 μm) with 60% 50 mM sodium acetate/acetic acid buffer (pH ∼5.5) (A) and 40% acetonitrile (B) as eluents with a flow rate of 1 mL/min, during which the compound elutes with retention time of about 6.8 min.
Cell Lines
K562 cells, which are Bcr-Abl–positive, were obtained from American Type Culture Collection and cultured in RPMI medium with 10% fetal calf serum and penicillin–streptomycin.
In Vitro Assays
Displacement binding studies were performed using either SKI696 or imatinib as competitors to displace the binding of 18F-SKI696 to K562 cells (Fig. 3). Briefly, triplicate samples of 18F-SKI696 (20,000 cpm) and increasing amounts (0.001–1,000 nM) of nonradiolabeled competitor were mixed with K562 cells (∼200,000). The mixtures were shaken on an orbital shaker for 1 h at ambient temperature. The cells were then isolated by rapid filtration and washed with ice-cold Tris-buffered saline using a cell harvester (Brandel). Isolated cell samples were counted, along with suitable blanks, with a γ-counter (1480 Wizard 3″ Automatic Gamma Counter). Nonspecific uptake of 18F-SKI696 was determined in the presence of 1,000 nM SKI696, and the specific uptake of 18F-SKI696 was determined. These data were plotted against the concentration of cold competitors to give sigmoidal displacement curves to yield the 50% inhibitory concentrations for each competing ligand (Fig. 3).
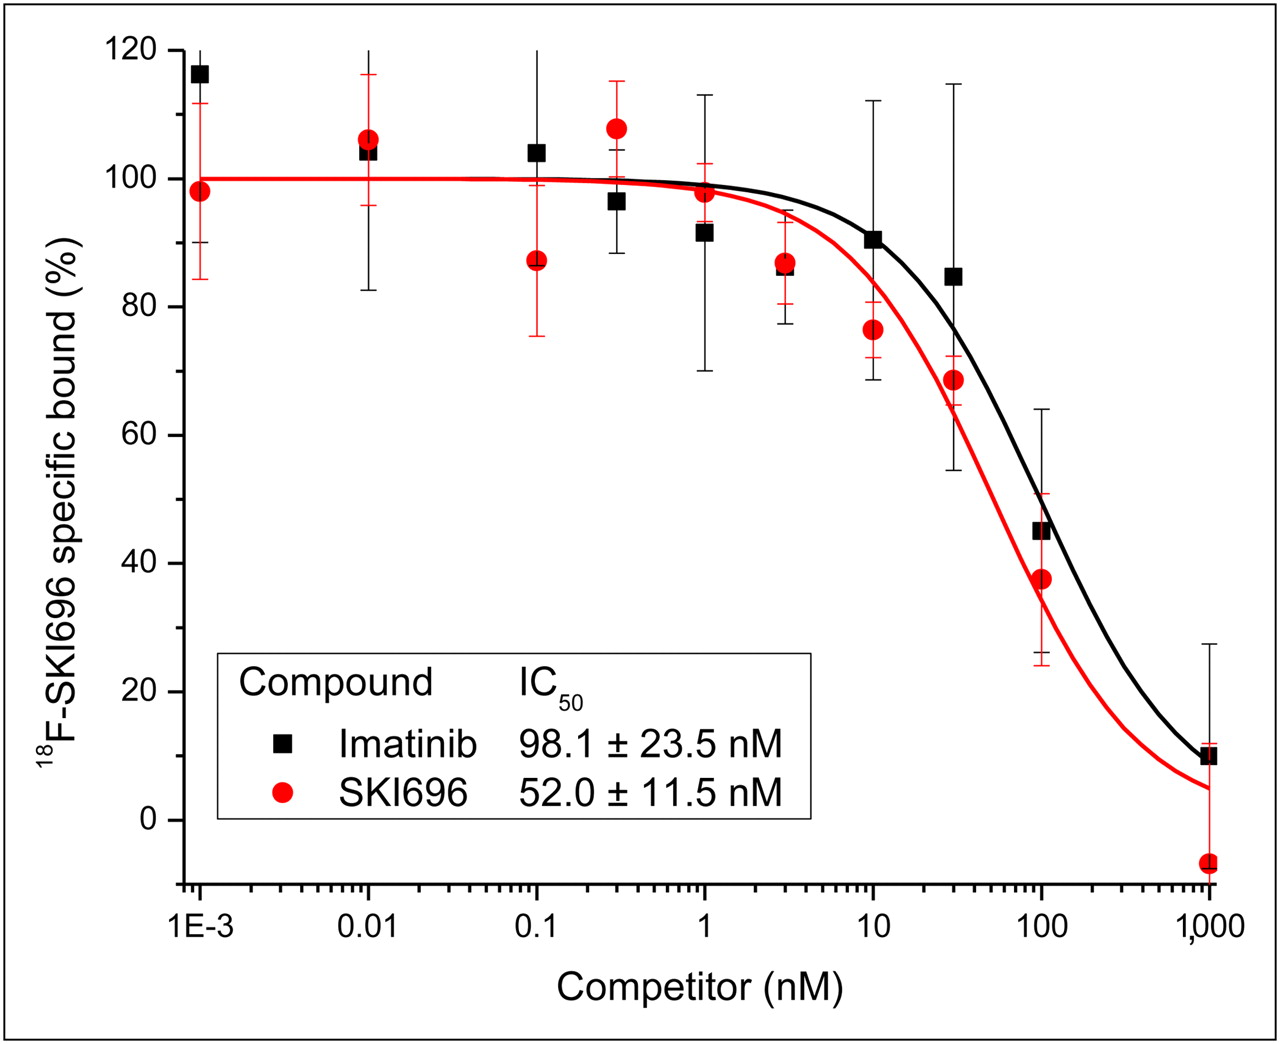
Displacement binding of 18F-SKI696 to K652 cells by imatinib and SKI696.
Tyrosine Kinase Inhibition Assay
The potency and selectivity of SKI696 was compared with imatinib and staurosporine using the QuickScout tyrosine kinase activity assay panel. The assay was performed by Carna Biosciences and consisted of a panel of 21 different tyrosine kinases. The assay measured the ability of the compounds to inhibit phosphorylation of the substrate at an inhibitor concentration of 100 nM. To calculate the percentage of inhibition, the amount of phosphorylated peptide in each assay was directly compared with the amount of phosphorylated peptide in the control (staurosporine at 100 nM).
Generation of Tumor Xenografts
All animal experiments were done in accordance with protocols approved by the Institutional Animal Care and Use Committee of Memorial Sloan-Kettering Cancer Center and followed National Institutes of Health guidelines for animal welfare. Tumor xenografts were established over a 2-wk period in nude female mice (20–25 g; Taconic) by subcutaneous injection of 5 × 10⁶ tumor cells in 200 μL of suspension (50% cell culture medium and 50% Matrigel [BD Biosciences]) in the right forelimb of mice; the mice were anesthetized with 2% isoflurane.
Small-Animal PET
A dedicated small-animal PET scanner (microPET Focus 120; Siemens Medical Solutions) was used for mouse imaging. During the entire scanning period, mice were anesthetized with 2% isoflurane in oxygen at 2 L/min. Imaging was performed at 1 and 2 h after administration of approximately 11.1 MBq (300 μCi) of 18F-SKI696 via the lateral tail vein. An energy window of 350–700 keV and a coincidence timing window of 6 ns were used. The imaging data were corrected for nonuniformity of the scanner response, dead-time count losses, and physical decay before the time of injection. The imaging data were not corrected for attenuation, scatter, or partial-volume averaging. The measured reconstructed spatial resolution of the microPET Focus 120 is about 1.6 mm in full width at half maximum at the center of the field of view. The counting rates in the reconstructed images were converted to activity concentrations (percentage injected dose per gram of tissue [%ID/g]) using a system calibration factor derived from the imaging of a mouse-sized water-equivalent phantom containing 18F.
In Vivo Biodistribution Studies
Xenografts were established (n = 4) by injecting about 5 × 10⁶ K562 cells into the right forelimb of each mouse. Tumors were allowed to grow to approximately 500 mm3, and the mice were then injected with 11 MBq (300 μCi) of 18F-SKI696 via the tail vein. The mice were euthanized by CO2 asphyxiation at 1 h after injection, and the organs were recovered. 18F radioactivity was measured in a γ-counter (1480 Wizard 3″ Automatic Gamma Counter) along with 18F standards using a 400- to 600-keV energy window and automatic decay correction.
RESULTS
Molecular Modeling
Nagar et al. have published the crystal structure of imatinib bound to the inactive conformation of the Abl kinase domain (5). It was evident by examination of the crystal structure of imatinib using the molecular modeling programs Benchware and SYBYL that the piperazinyl methyl group was positioned outside the binding pocket (Fig. 1A). By modification of the methyl group, the fluoroethyl group was shown to also be positioned outside the binding domain and, therefore, to not affect binding of the analog to the ATP binding pocket (Fig. 1B). The replacement of an H with an FCH2 is not expected to greatly alter the biodistribution and pharmacodynamics of the analog.
Synthetic Chemistry
The decision was made to modify the piperazinyl methyl group of the parent structure after careful consideration of both the published crystal structures of imatinib in the Abl binding pocket and other data about the pharmacokinetics of imatinib. In addition, the methyl group was changed to a substituted ethyl group to facilitate radiofluorination. Nonradioactive SKI696 was synthesized primarily to verify that subtle modification of the parent structure would not dramatically alter the compound's uptake and biodistribution and also to generate the precursor for the production of 18F-SKI696. The overall synthesis of SKI696 from the pyridopyrimidine core III was completed in 5 steps with a 6.3% overall yield. The alkylation of piperazinyl nitrogen was the lowest-yield reaction, with yields of 17%, whereas all previous reactions had yields above 56%.
Radiochemistry
Originally, it was assumed that an ethyl group (substituted by a good leaving group) could be attached to the piperazine and that eventually the leaving group could be displaced with 18F. However, because of the disappointing results of our initial attempts at this approach, the focus of the synthesis shifted to a 2-step approach: first, a 2-carbon synthon was radiolabeled with 18F, and second, this was used as an alkylating agent with the piperazinyl nitrogen (15). The overall isolated yields of the final product were 8.9% ± 3.8% (decay-corrected, n = 11, 3.7%–14.3%) with greater than 98% radiochemical purity. The average specific activity was approximately 6,845–8,584 MBq (185 ± 232 mCi)/μmol.
Tyrosine Kinase Inhibition Assay
A kinase inhibition assay was performed on a panel of 21 protein tyrosine kinases to confirm that SKI696 and imatinib have similar binding affinity and selectivity for the same kinases (Fig. 4). Staurosporine, a broad-spectrum kinase inhibitor, was assayed in parallel as a positive control. In the kinase panel, imatinib (100 nM) inhibited the activity of PDGFRα 100%, c-Kit 30.6%, and Abl 33.4% relative to 100 nM staurosporine, whereas SKI696 inhibited the activity of these 3 kinases with similar potency and selectivity: 78.2%, 30.6%, and 10.4%, respectively. The inhibitory activity of both SKI696 and imatinib for the 18 additional kinases in the panel was below 10%, demonstrating the high specificity of both compounds for PDGFRα, c-Kit, and Abl kinases.

Percentage inhibition of phosphorylation by SKI696 and imatinib of tyrosine kinases as compared with staurosporine, at 100 nM concentration of inhibitors.
Displacement Assay
Displacement assay performed in our laboratory showed that the binding of 18F-SKI696 diminished as excess SKI696 (nonradiolabeled) was added to the cell cultures. The studies also showed that imatinib was a competitive inhibitor of 18F-SKI696 (Fig. 3). Because imatinib and SKI696 show identical displacement curves, it is safe to assume that the lead drug and our analog have the same binding target.
Small-Animal PET Studies
Mice implanted with K562 xenografts were allowed to grow tumors of about 5 mm. The mice were then injected via the tail vein with a formulation of 18F-SKI696 in 0.1% acetic acid in 0.9% saline and imaged with a small-animal PET camera. Animals (n = 3) were imaged at 1 and 2 h after injection (Fig. 5). At 1 h, images showed the highest tumor uptake of the radiotracer (1.2 ± 0.4 %ID/g) and a tumor-to-background ratio of 2.1 ± 0.4. At 2 h, images showed a somewhat lower tumor uptake of the radiotracer (0.7 ± 0.2 %ID/g) and a tumor-to-background ratio of 1.4 ± 0.2. The tumor was adequately visualized at both 1 h and 2 h. Most of the radioactivity accumulated in the liver and in the digestive tract.
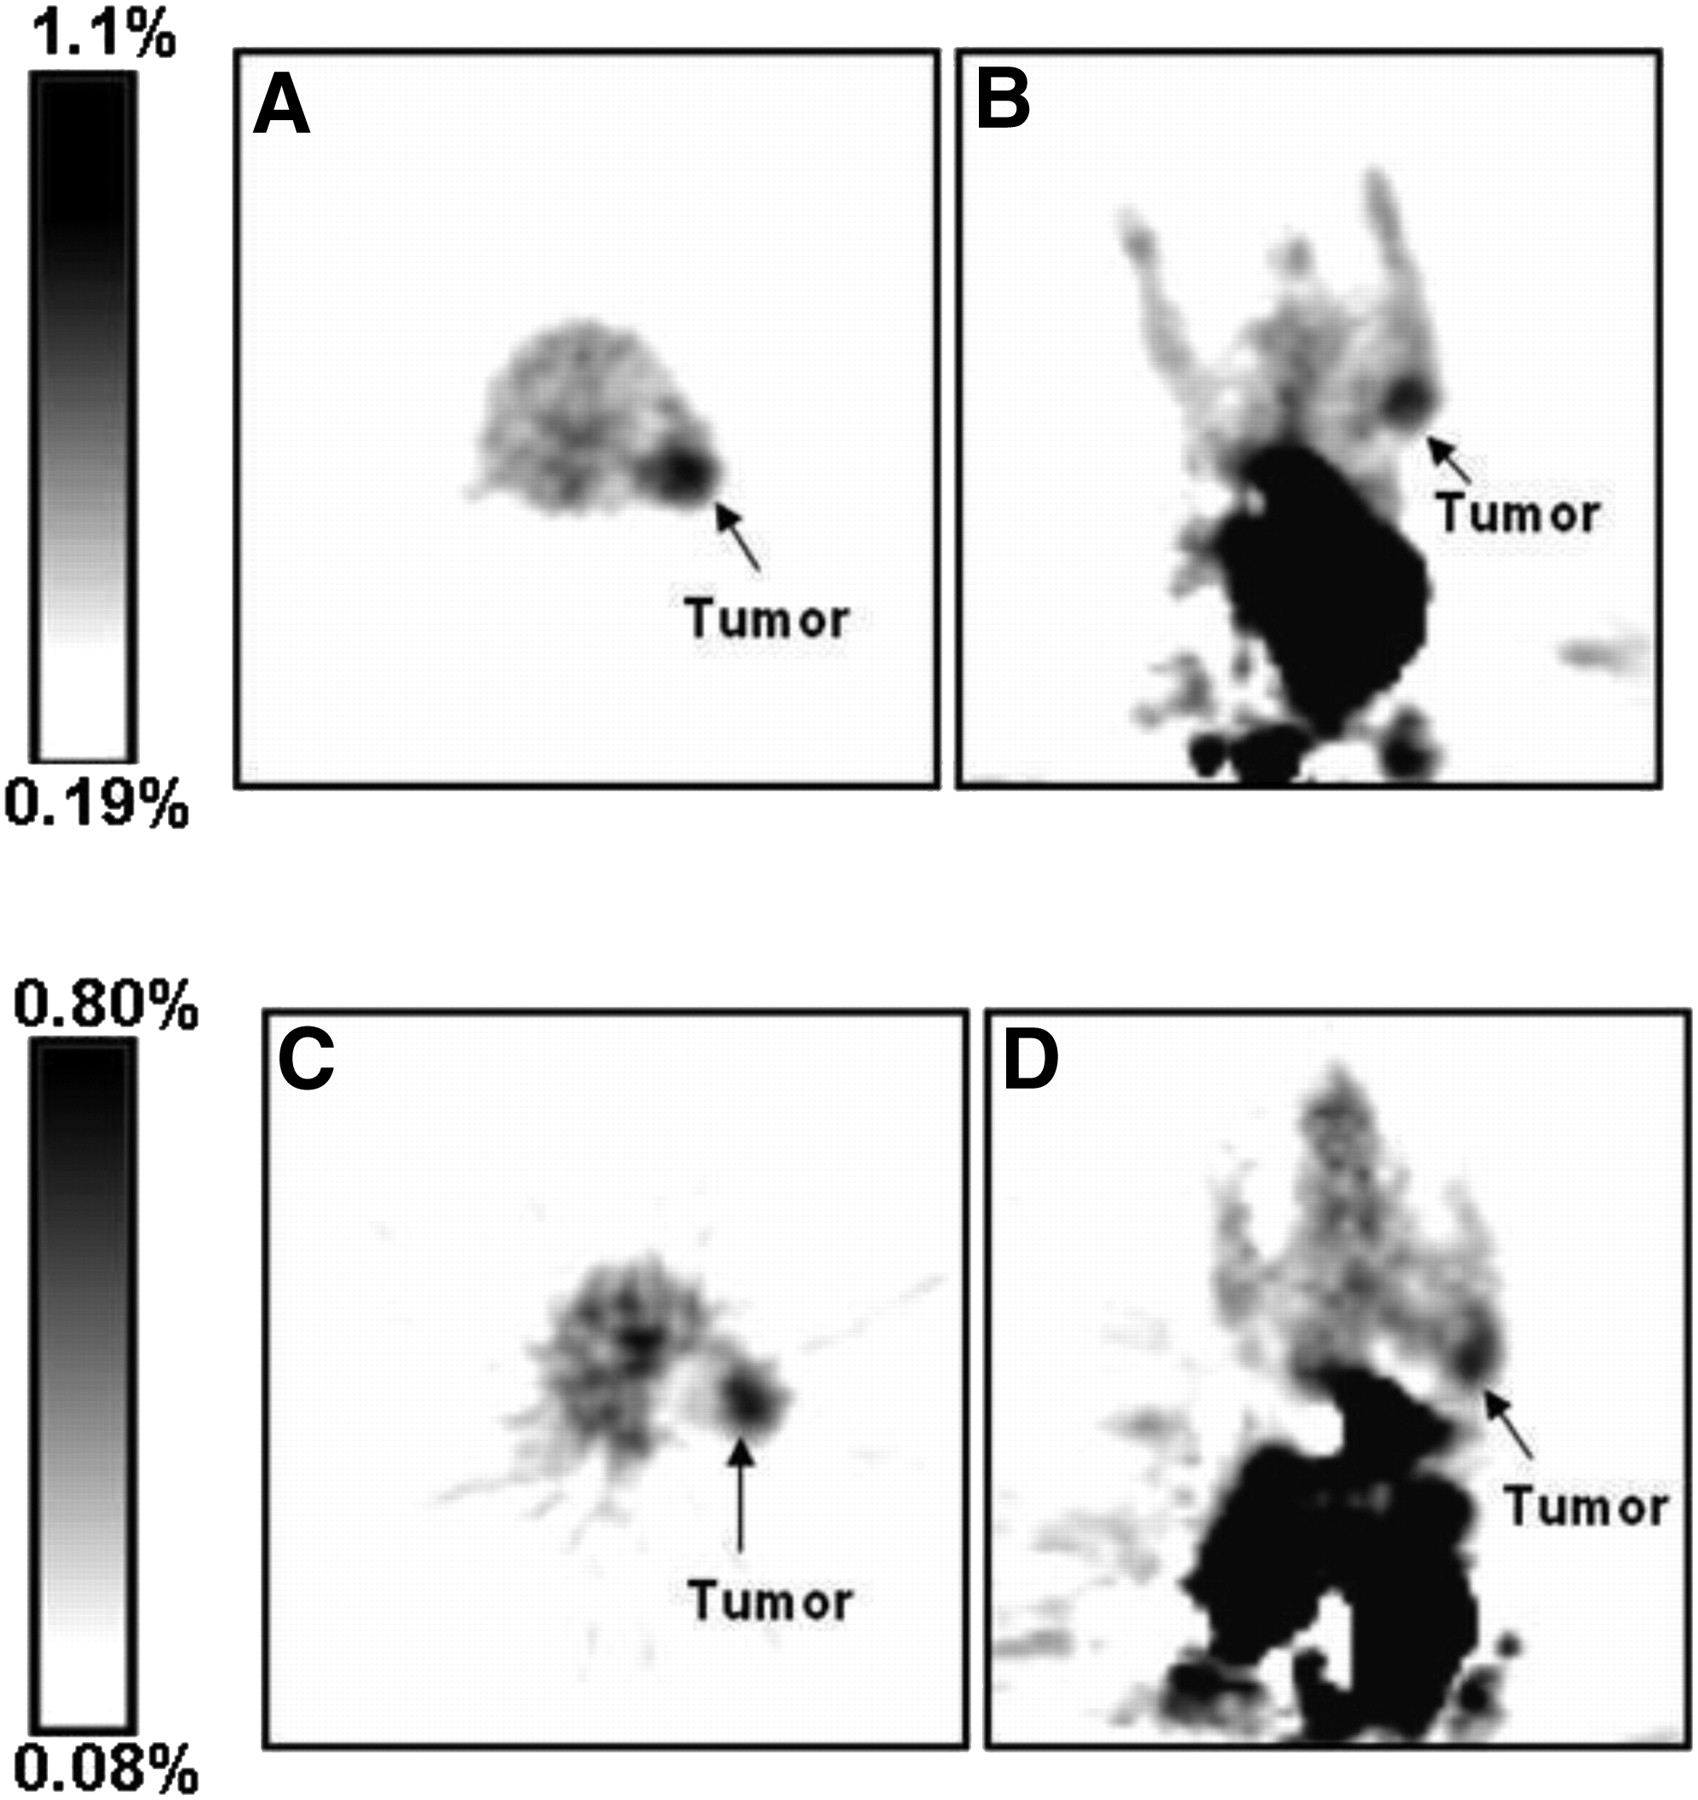
Transverse and coronal small-animal PET images of mouse bearing K652 tumor xenograft at 1 h (A and B) and 2 h (C and D) after injection.
Biodistribution Studies
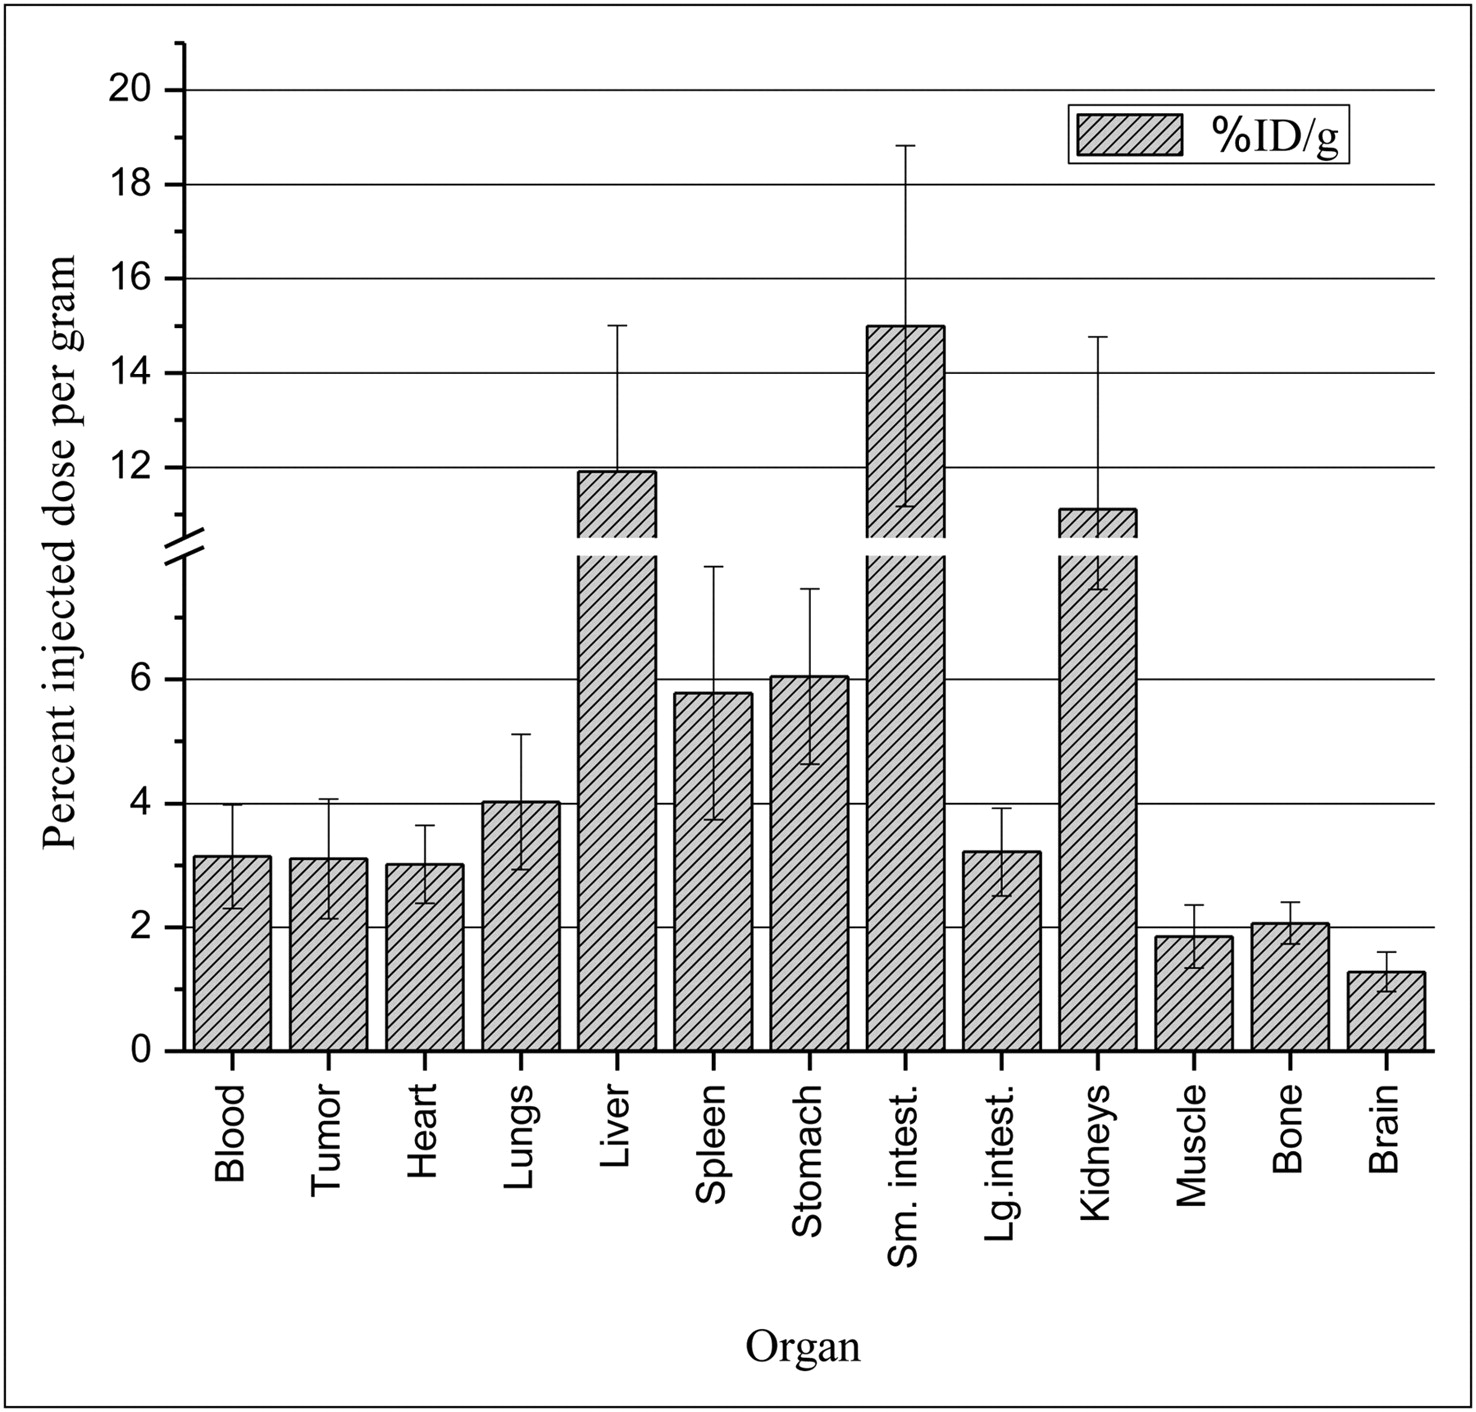
The biodistribution results (Fig. 6 and Supplemental Fig. 1) closely matched the trends in the PET data. The %ID/g found in the tumors ranged from 1.3 ± 0.3 to 6.0 ± 1.4. The small intestine, liver, and kidneys had the highest amounts of radioactivity present, at 4.8, 3.8, and 3.6 times the %ID/g of the tumor, respectively. The brain, muscle, and bone had the lowest amounts of radioactivity present, at 0.4, 0.6, and 0.7 times the %ID/g of the tumor, respectively. It is important to emphasize that despite high background, the major requirement is that radioactivity, because of uptake of the radiolabeled drug in the tumor, can be quantified as a basis for intertumoral pharmacokinetics. Both imaging and biodistribution studies support this concept.

Biodistribution of 18F-SKI696 in mice with K562 tumors at 1 h after injection.
DISCUSSION
Imatinib mesylate showed impressive results versus interferon-α plus cytosine arabinoside in the original clinical trials; there was a 40% increased complete hematologic response and an 84% increased complete cytogenetic remission (3). After 60 mo, the patients were reassessed, and of the 382 patients still receiving imatinib, 368 (96%) had a complete cytogenic response (16). Although the patients who are still receiving treatment showed a high response, it is expected that 20%–30% of these patients will develop resistance to imatinib (17).
The ability to define the best dosing regimen based on %ID/g is a goal of this study. A drop in %ID/g during therapy would indicate the need for either an increase in the dose or a change in the therapy, if possible. Therefore, creation of a PET radiopharmaceutical able to delineate whether a tumor will respond or develop resistance to imatinib treatment will be of great interest. This current work is the first step in achieving this goal.
Resistance to imatinib can be classified as either primary or secondary. In patients with primary resistance, the disease will not respond to treatment with imatinib. Secondary resistance is acquired resistance; the patient originally has a response to treatment with imatinib but later stops responding to treatment (3). We can assume that there is a correlation between the uptake level of imatinib and the development of resistance to it, as shown in a study by Zhao et al. (18). In that study, a resistant strain of cells was obtained from a cell line grown in culture containing 500 nM imatinib. The resistant cells did not display a dose-dependent suppression of proliferation over the same dose range as the sensitive lines. At higher concentrations, the resistant cells also showed inhibition of proliferation, as well as cell death, in a dose-dependent manner. Certain clinical and biologic markers, such as Bcr-Abl kinase domain mutations and BCR-ABL gene amplification, have been associated with a lower probability of response to imatinib; however, these markers have not been used to predict response to treatment (3).
A study of patients with mutations in the Bcr-Abl kinase domain showed that there were 31 different positional mutations in 245 patients (19). Several of these mutations are associated with resistance to treatment with imatinib and other tyrosine kinase inhibitors. These mutations are usually located in the ATP binding loop and can reduce or preclude drug binding by inducing different conformations of the loop or by disrupting critical contact points (20,21). In SKI696, an analog of imatinib, the piperazine methyl group was replaced by a fluoroethyl group. Molecular modeling studies suggested that modification of the imatinib structure at the methyl position is unlikely to disrupt binding to the Bcr-Abl kinase domain (5).
Most imatinib analogs previously studied were unsuitable for PET because they were labeled with 14C and 3H. The decision was made in this current study to substitute the terminal methyl group of imatinib with a fluoroethyl group after consideration of the orientation of imatinib in the binding pocket of bcr-abl as shown in the reported x-ray crystal structure (5) and the structure of the active metabolite of imatinib (11). The 110-min half-life of 18F made it a prime candidate as a PET agent because Gschwind et al. had already shown that the maximum plasma levels of imatinib were reached between 1 and 2 h after dosing (22). SKI696 was then examined in parallel with imatinib in a tyrosine kinase inhibition assay to demonstrate that these 2 compounds had similar activity profiles. The results of the kinase panel showed that both compounds had a strong affinity for PDGFRα, Kit, and Abl kinases. Even though there are some minor differences in the inhibition profile, these were to be expected because SKI696 is an analog of imatinib that has been structurally modified so that it can be labeled. The 2 compounds also had similar displacement curves, suggesting that these compounds have similar targets within the cell and thus validating our premise that SKI696 would make a good mimic for imatinib.
Once the binding affinity of the SKI696 had been established in vitro, an imaging study of K562-bearing mice was undertaken. The tumors implanted in the right shoulder were visible in all mice; the only drawback was a high uptake of tracer in the digestive track. The tumors were visualized at both 1 h and 2 h after injection, but at the 2-h time point the amount of radioactivity still left in the tumor was quite low. The large amount of radioactivity in the liver and the intestines was not unexpected because the main route of elimination of imatinib is through biliary excretion or through hepatic metabolism (22).
Biodistribution studies were performed to quantify the radioactivity pattern seen in PET. Four mice were sacrificed at 1 h after injection, and their organs were harvested. The highest uptake in the organs was in the small intestine (15.03 ± 3.9 %ID/g), liver (11.84 ± 3.1 %ID/g), and kidney (11.13 ± 3.7 %ID/g), followed by the stomach (6.00 ± 1.4 %ID/g) and the spleen (5.8 ± 2.1 %ID/g). The trends seen in this biodistribution reflected the study reported by Kil et al., in which 11C-labeled imatinib was used as the imaging agent in female baboons (Papio anubis) (9). In the 11C study, the organs with highest uptake at 1 h after injection were the gallbladder (0.09 %ID/cm3), liver (0.03 %ID/cm3), kidney (0.022 %ID/cm3), and heart (0.022 %ID/cm3). The values for the organs with highest uptake from both studies were within the same range after the size of the animals was considered. The 2 species were compared to show general trends, and they both showed high hepatic metabolism of the tracer. The rate of metabolism of the small molecules may not be identical in the 2 species, but they should have similar biodistribution patterns.
CONCLUSION
An imatinib analog was synthesized that has the same binding targets as the original pharmacophore. The analog was labeled with 18F for use as a surrogate PET tracer for imatinib therapies; 18F-SKI696 was used in in vivo experiments to distinguish the K562 tumor that had been implanted in the mice. Because there was reasonable tumor uptake, 18F-SKI696 can be used as a radiotracer for imatinib drug distribution. The tracer was also taken up in the abdominal cavity, leading to a low signal-to-noise ratio. Thus, 18F-SKI696 was demonstrated to have potential for mapping the true distribution of imatinib, including not only tumor uptake and retention but also the fraction metabolized by the liver and excreted into the gut and urine. Our plan is to explore the hypothesis that this radiotracer form of imatinib can be used to improve knowledge of individual variations in metabolism in patients, thus allowing identification of patients who would be more likely to benefit from imatinib therapy, as well as patients who are developing or who have developed resistance to this mode of treatment.
DISCLOSURE STATEMENT
The costs of publication of this article were defrayed in part by the payment of page charges. Therefore, and solely to indicate this fact, this article is hereby marked “advertisement” in accordance with 18 USC section 1734.
Acknowledgments
We thank Dr. Jason Lewis and Franklin Torres for help with preparing and editing the manuscript. We also thank the U.S. Department of Energy for support under contracts DE-FG02-86ER60407 and ER63693 and the National Institutes of Health for support under contracts P50 CA86438 and P30 CA008748. We gratefully acknowledge the technical services that were provided by the MSKCC Small-Animal Imaging Core Facility, supported in part by NIH Small-Animal Imaging Research Program (SAIRP) grant R24 CA83084 and NIH Center grant P30 CA08748, and the Radiochemistry and Cyclotron Core for production and supply of 18F. No other potential conflict of interest relevant to this article was reported.
- © 2011 by Society of Nuclear Medicine
REFERENCES
- Received for publication November 8, 2010.
- Accepted for publication March 31, 2011.


