


Abstract
Although the clinical applications of 18F-FDG PET/CT and diffusion-weighted MRI (DWI) are similar to each other in head and neck cancer, the image acquisition methods in the 2 modalities are significantly different. 18F-FDG PET/CT traces glucose metabolism, a nonspecific process essential for tumor growth. On the other hand, DWI provides information on Brownian motion of water molecules in tissues, which represents cellularity. The aim of our study was to investigate whether apparent diffusion coefficient (ADC) values at b = 1,000 (ADC1,000) and 2,000 (ADC2,000) s/mm2 or whether the change (ADCratio) of ADC values from b = 1,000 to 2,000 s/mm2 has any significant correlation with the standardized uptake value (SUV) in patients with head and neck squamous cell carcinoma (HNSCC). Methods: Our hospital's institutional review board approved this retrospective study. We included 47 patients (32 men and 15 women) with histopathologically proven HNSCC, who underwent both DWI (at both b = 1,000 s/mm2 and b = 2,000 s/mm2) and 18F-FDG PET/CT in the 2 wk before treatment. ADCratio maps were generated using a pixel-by-pixel computation for which ADCratio is (ADC2,000/ADC1,000) × 100. The mean ADC1,000, ADC2,000, and ADCratio values were evaluated within a manually placed polygonal region of interest within the main tumor on every slice of the ADC1,000, ADC2,000, and ADCratio maps, respectively. In addition, the maximal SUV (SUVmax) and mean SUV (SUVmean) were measured for the entire tumor region of interest. Comparisons were made using Pearson correlation analysis, and partial correlation coefficients were derived. Results: No significant correlation was found between the mean ADC1,000 and SUVmean (r = −0.222, P = 0.1325) or the mean ADC2,000 and SUVmean (r = −0.1214, P = 0.4163). However, the ADCratio was significantly and positively correlated to both the SUVmean (r = 0.667, P < 0.001) and SUVmax (r = 0.5855, P < 0.001). Conclusion: The ADCratio and SUV were significantly correlated with each other in primary HNSCC patients, possibly because of a higher-cellularity region as a result of relatively increased tumor proliferation. Further studies are warranted to investigate the possible complementary role of DWI and PET/CT in various clinical settings, including staging and treatment response.
Head and neck squamous cell carcinoma (HNSCC) comprises most head and neck cancers. Accurate staging at the time of diagnosis is critical for selection of the appropriate treatment strategy (1). Thus, routine imaging work-up in HNSCC often involves combined 18F-FDG PET/CT to evaluate occult distant metastases, nodal involvement, and recurrences (1,2). PET/CT may also be potentially used for determining response to chemo- or radiotherapy in organ preservation protocols in head and neck cancer patients (3). Recently, diffusion-weighted MRI (DWI) has played an increasing role in diagnosis and management planning of HNSCC (4–7), and the apparent diffusion coefficient (ADC) can be used as a marker for prediction and the early detection of response to concurrent chemoradiation therapy in HNSCC (8).
Although the clinical applications of 18F-FDG PET/CT and DWI are similar to each other in head and neck cancer, the image acquisition methods in both modalities are significantly different. 18F-FDG PET/CT traces increased glucose metabolism, a well-known phenomenon in cancer since the discovery of the Warburg effect. On the other hand, DWI provides information on the random (Brownian) motion of water molecules in tissues, which represents cellularity (9). Notably, some recent studies that compare DWI with 18F-FDG PET/CT have shown that DWI at 1.5 T is comparable with 18F-FDG PET/CT for detection of malignant lesions (10,11). Thus, it seems to be necessary to investigate whether there is a correlation between the parameters from DWI and 18F-FDG PET/CT to compare the clinical usefulness of the 2 modalities.
Water diffusion in biologic tissues is commonly described in terms of fast equilibration between 2 main components (12,13): slow-diffusing water molecules, which are either bound to macromolecules or confined within the cell by the cell membrane, and fast-diffusing water molecules, which are mostly extracellular (14,15). ADC values decrease when b values are increased beyond 1,000 s/mm2, which can be explained by biexponential signal intensity (SI) decay (12,13,16–19). Hence, ADC values at the standard b value of 1,000 s/mm2 (ADC1,000) are higher than those at a high b value of 2,000 s/mm2) (ADC2,000). Theoretically, any architectural changes in the proportion of extracellular to intracellular water protons would alter the level of the decrease in ADC values from b = 1,000 s/mm2 to 2,000 s/mm2. In this context, the change of ADC values at different b values may vary according to the microstructure and pathophysiologic state of the tissues. To our best knowledge, however, there have been no reports regarding the correlation of DWI and PET/CT in HNSCC. Thus, the aim of our study was to investigate whether ADC values at b = 1,000 and 2,000 s/mm2 or the change of ADC values from b = 1,000 to 2,000 s/mm2 have any significant correlation with the standardized uptake value (SUV) in patients with HNSCC.
MATERIALS AND METHODS
Patient Selection
Our hospital's institutional review board approved this retrospective study, and the requirement for informed consent was waived. From a computerized search of our hospital's pathology files and medical records between October 2008 and December 2009, we identified 77 patients with histopathologically proven HNSCC who had undergone surgical treatment, radiation therapy, or chemotherapy. Patients who met all of the following criteria were included in our study: patients with HNSCC who had undergone both DWI (at both b = 1,000 s/mm2 and b = 2,000 s/mm2) and 18F-FDG PET/CT in the 2 wk before treatment and patients with tumors of 2 cm or more in maximal transverse diameter on MR images. In addition, 5 patients who met the inclusion criteria were excluded because their images showed motion or susceptibility artifacts. Consequently, we included 47 patients (32 men and 15 women), and the ages ranged from 36 to 82 y (mean, 62.9 y). The mean maximal transverse diameter (±SD) of the tumors on MR images was 3.7 ± 1.3 cm. The locations of the tumors included the oral cavity (n = 32), pharynx (n = 12), and sinonasal cavity (n = 3). The HNSCCs were classified as well-differentiated (n = 35), moderately differentiated (n = 6), or poorly differentiated (n = 6).
MRI Examination
MRI was performed using a 1.5-T MRI system (Signa HDx or HDxt; GE Healthcare) with an 8-channel head and neck coil. A transverse fat suppression T2-weighted turbo spin echo sequence was performed with a repetition time (TR) of 5,700 ms and an echo time (TE) of 105 ms, 30 slices, a 4-mm slice thickness, a 1.2-mm interslice gap, a field of view of 22 × 22 cm, a matrix of 320 × 192, 1 acquired signal, an echo train length of 16, and a pixel resolution of 0.7 × 1.1 × 4.0 mm. A transverse T1-weighted spin echo sequence was performed with a TR/TE of 550/11, 30 slices, a 4-mm slice thickness, a 1.2-mm intersection gap, a field of view of 22 × 22 cm, a matrix of 320 × 192, 1 acquired signal, and a pixel resolution of 0.7 × 1.1 × 4.0 mm.
Echo-planar DWI was performed in the transverse plane before the contrast material injection with a TR/TE of 7,100/84 (at b = 0 and 1,000 s/mm2) and 10,000/75 (at b = 0 and 2,000 s/mm2), 30 slices, a bandwidth of 1,953 Hz/pixel, a 4-mm slice thickness, a 1.2-mm interslice gap, a field of view of 24 × 24 cm, a matrix of 160 × 160, 4 acquired signals, and a pixel resolution of 1.5 × 1.5 × 4.0 mm. Diffusion-weighted images were acquired in 3 orthogonal directions and combined into a trace image. The durations of diffusion-weighted imaging at b = 0 and 1,000 s/mm2 and b = 0 and 2,000 s/mm2 were 1 min 23 s and 2 min 50 s, respectively. ADC1,000 and ADC2,000 maps were calculated using the manufacturer's software that was built into the MR unit.
In all 47 patients, the T1-weighted sequence was repeated after the intravenous administration of a single dose of gadopentetate dimeglumine (Magnevist; Bayer Schering Pharma AG). A fat suppression pulse was added to the T1-weighted spin echo sequence after administration of the contrast agent. Depending on the location of the primary tumor, coronal or sagittal T1-weighted sequences were performed with identical imaging parameters after contrast agent administration.
PET Image Acquisition
PET images were acquired using integrated PET/CT scanners (Gemini, Philips, or Biograph 40; Siemens). After fasting for at least 6 h, patients were injected with 18F-FDG (5.2 MBq/kg), and images were acquired 1 h later. A CT scan was obtained for attenuation correction, and an emission scan was obtained from the base of the skull to the proximal thigh for 2 min per bed position. Images were reconstructed using an iterative algorithm (ordered-subset expectation maximization) with image size of 256 × 256 matrix.
MRI Analysis
MR data of ADC1,000 and ADC2,000 maps were digitally transferred from the PACS workstation to a personal computer and processed with ImageJ (available at http://rsb.info.nih.gov/ij/) and software developed in house using Microsoft Visual C++. One author performed all image processing, region-of-interest (ROI) drawing, and data analyses.
ADCratio (change of ADC values from b = 1,000 to 2,000 s/mm2) maps were generated using a pixel-by-pixel computation according to the following equation: ADCratio = (ADC2,000/ADC1,000) × 100, where ADC1,000 and ADC2,000 are the ADC values of the diffusion weighted images obtained with b values of 0 and 1,000 s/mm2 and 0 and 2,000 s/mm2, respectively.
The mean ADC1,000, ADC2,000, and ADCratio values were evaluated within a manually placed polygonal ROI within the main tumor on every slice of the ADC1,000, ADC2,000, and ADCratio maps, respectively, on which the tumor border was drawn by visual evaluation of T2-weighted images or contrast-enhanced T1-weighted-images.
For comparison, a total of 3 contiguous sections encompassing the largest areas of the deep cervical muscles were included for analysis. On each section, a polygonal ROI that encompassed the deep cervical muscles was placed on the ADC1,000, ADC2,000, and ADCratio maps. The sizes of the ROIs were approximately 800–900 pixels for each deep cervical muscle (summed areas of 3 contiguous sections). The mean ADC1,000, ADC2,000, and ADCratio values were also measured for the deep cervical muscles.
PET Image Review and Analysis
PET/CT fusion datasets were retrospectively reviewed by 2 nuclear medicine specialists experienced in PET/CT interpretation. For 18F-FDG uptake, SUV was defined as tissue concentration of radioactivity (kBq/mL) divided by injected dose per weight (kBq/g), as is commonly used. Tumor ROI was drawn on each axial PET/CT fusion image with reference to T2-weighted images or contrast-enhanced T1-weighted images, to cover the whole tumor volume. Afterward, maximal SUV (SUVmax) and mean SUV (SUVmean) of the whole tumor ROI were measured using an open-source DICOM analysis software (OsiriX; available at http://www.osirix-viewer.com).
Statistical Analysis
Statistical analyses were performed using commercially available software (SPSS 15.0 for Windows [Microsoft]; SPSS, and MedCalc, version 11.1.1.0 [MedCalc Software]). For all statistical analyses, a 2-tailed P value of less than 0.05 was considered to indicate a statistically significant difference.
The 2-sided paired Student t test was used to assess differences between HNSCCs and deep cervical muscles in terms of the mean ADC1,000, ADC2,000, and ADCratio values.
For HNSCCs, the following comparisons were made using Pearson correlation analysis, and partial correlation coefficients were derived; mean ADC1,000 versus SUVmean, mean ADC2,000 versus SUVmean, ADCratio versus SUVmean, and ADCratio versus SUVmax. Among the well-, moderately, and poorly differentiated squamous cell carcinomas (SCCs), the comparisons of ADC1,000, ADC2,000, ADCratio, SUVmean, and SUVmax were performed by an ANOVA test.
RESULTS
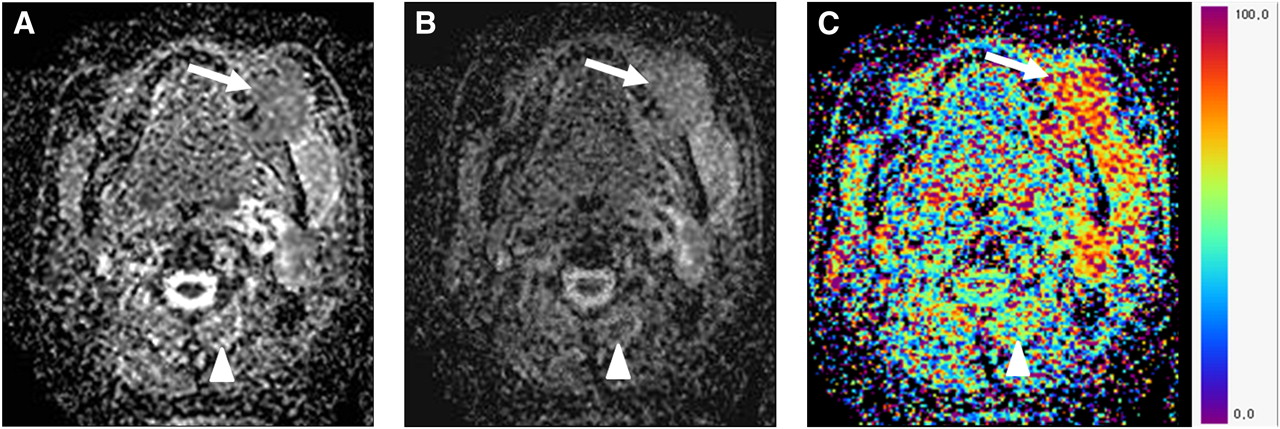
Table 1 summarizes the mean ADC1,000, ADC2,000, and ADCratio values of main tumors and deep cervical muscles. The mean ADC1,000 of main tumors was lower than that of deep cervical muscles (1,220 ± 285 × 10−6 mm2/s vs. 1,436 ± 124 × 10−6 mm2/s, P < 0.001), whereas main tumors showed a higher mean ADC2,000 value than deep cervical muscles (952 ± 196 × 10−6 mm2/s vs. 768 ± 96 × 10−6 mm2/s, P < 0.001). The mean ADCratio of main tumors was 79.4% ± 6.8% and that of deep cervical muscles was 48.7% ± 5.4%, resulting in statistical significance (P < 0.001). Figure 1 shows the ADC1,000, ADC2,000, and ADCratio maps of a patient with lower gingival SCC in the left molar region.
ADC Values of HNSCCs and Deep Cervical Muscles

(A) Transverse ADC1,000 map shows lower gingival SCC (arrow) in left molar region, of which ADC1,000 is 1,294 × 10−6 mm2/s. ADC1,000 of deep cervical muscle (arrowhead) is measured as 1,544 × 10−6 mm2/s. (B) ADC2,000 of gingival cancer (arrow) and deep cervical muscle (arrowhead) is 1,020 × 10−6 and 789 × 10−6 mm2/s, respectively, on transverse ADC2,000 map. (C) Transverse ADCratio map shows that ADCratio of gingival cancer and deep cervical muscle are 78% and 51%, respectively.
The SUVmean and SUVmax of main tumors were 5.2 ± 2.0 and 12.0 ± 5.5, respectively. The results of the main tumors showed no significant correlation between the mean ADC1,000 and the SUVmean (r = −0.222, P = 0.1325) or the mean ADC2,000 and the SUVmean (r = −0.1214, P = 0.4163) (Fig. 2). In contrast, the ADCratio was significantly and positively correlated with both the SUVmean (r = 0.667, P < 0.001) and the SUVmax (r = 0.5855, P < 0.001) (Figs. 3 and 4).

Scatterplots demonstrate results of linear regression between SUVmean and mean ADC values of HNSCCs as determined on ADC1,000 (A) and ADC2,000 maps (B). Correlation is not significant. For each scatterplot, best-fit line is shown as solid line. Curves above and below best-fit line represent upper and lower bounds of 95% confidence interval.

Scatterplots demonstrate results of linear regression between mean ADCratio (%, ratio of ADC2,000 to ADC1,000 values of tumors) and SUVmean (A) and SUVmax (B) of HNSCCs. Significant positive correlation is found. For each scatterplot, best-fit line is shown as solid line. Curves above and below best-fit line represent upper and lower bounds of 95% confidence interval.

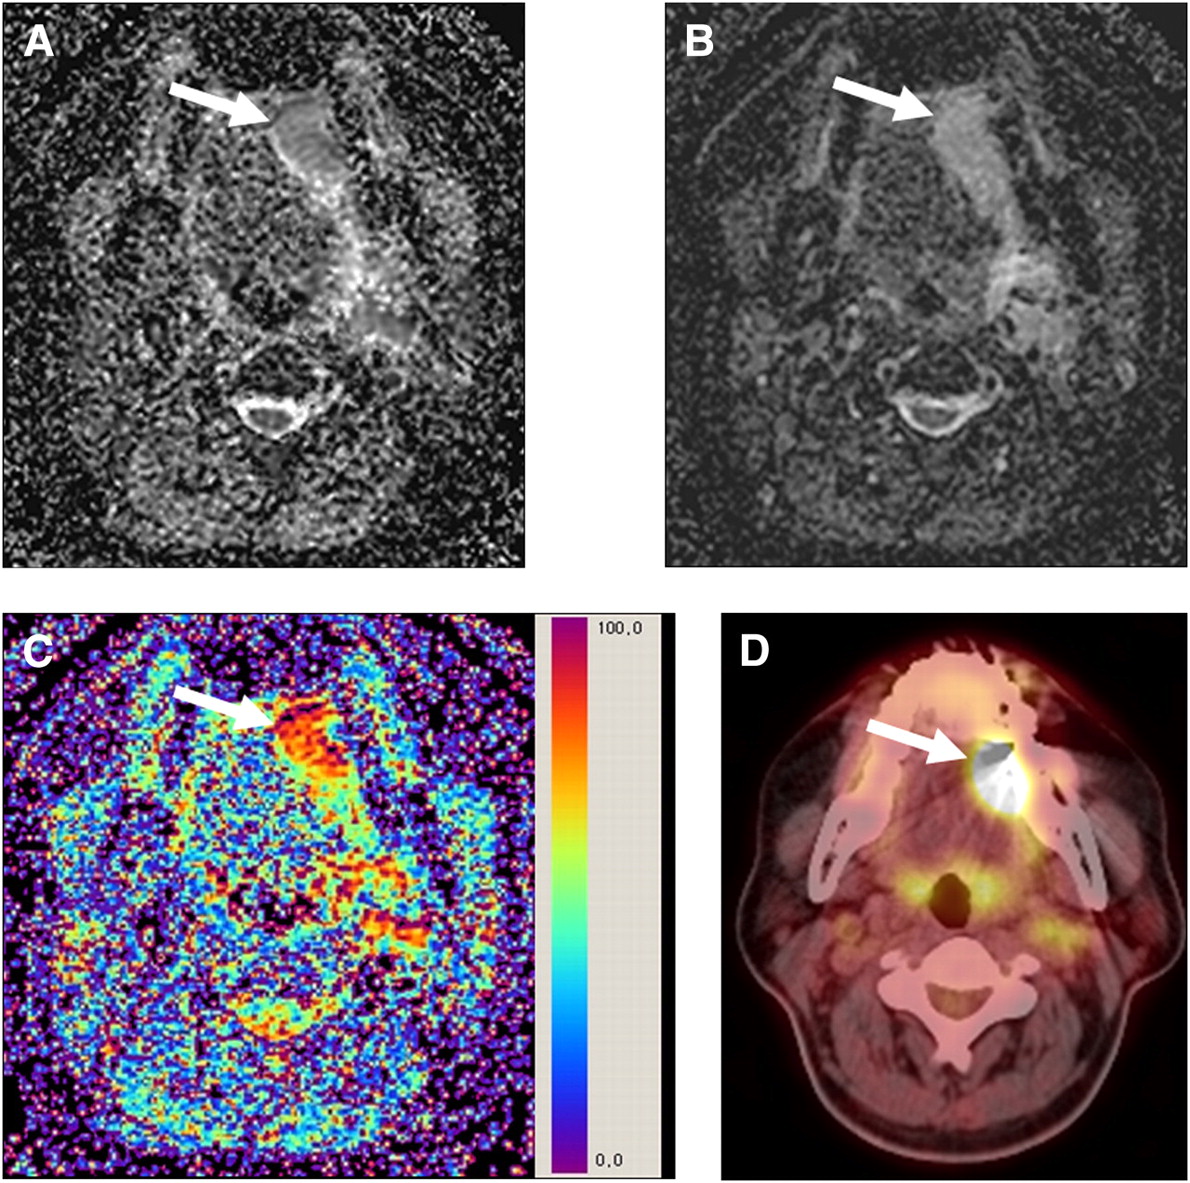
(A) Transverse ADC1,000 map shows left tongue SCC (arrow), of which ADC1,000 is 1,216 × 10−6 mm2/s. (B) ADC2,000 of SCC (arrow) is 1,021 × 10−6 mm2/s on transverse ADC2,000 map. (C) Transverse ADCratio map shows that ADCratio of SCC is 84%. (D) SUVmean and SUVmax of SCC are 6.61 and 10.01, respectively.
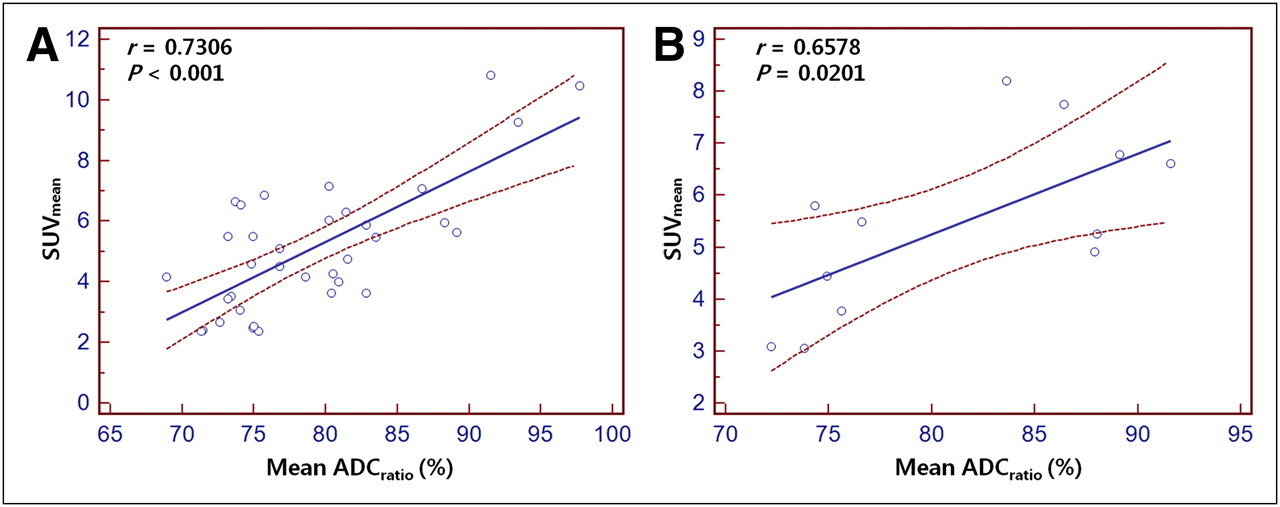
Table 2 shows the ADC1,000, ADC2,000, ADCratio, SUVmean, and SUVmax values of well-, moderately, and poorly differentiated SCCs, of which none revealed a significant difference. In terms of well-differentiated SCCs (n = 35), the ADCratio was significantly and positively correlated with the SUVmean (r = 0.7306, P < 0.001), and we also found a significant correlation between the ADCratio and the SUVmean (r = 0.6578, P = 0.0201) for moderately and poorly differentiated SCCs (n = 12) (Fig. 5).
ADC Values and SUVs of Well-, Moderately, and Poorly Differentiated SCCs

Scatterplots demonstrate results of linear regression between mean ADCratio (%, ratio of ADC2,000 to ADC1,000 values of tumors) and SUVmean of well-differentiated (A) and moderately or poorly differentiated (B) HNSCCs. Significant positive correlation is found. For each scatterplot, best-fit line is shown as solid line. Curves above and below best-fit line represent upper and lower bounds of 95% confidence interval.
DISCUSSION
Although tissue cellularity and glucose metabolism may represent 2 different facets of tumor biology, previous data have demonstrated a positive correlation between tumor 18F-FDG uptake and the degree of cellularity (1,2,7). The ADC value, measured by DWI, has been known to correspond to tumor cellularity (20–22). However, our results show that there is no significant correlation observed between the SUVmean and either the mean ADC1,000 (r = −0.222, P = 0.1325) or the mean ADC2,000 (r = −0.1214, P = 0.4163) in HNSCC patients. Instead, our correlation analysis results reveal a significant positive correlation between the ADCratio and SUVmean (r = 0.667, P < 0.001). It has also been reported that the minimum ADC and mean ADC at b = 1,000 s/mm2 are not correlated with the SUVmax and SUVmean, respectively, in uterine cervical cancer (9).
When compared with the ADC values of deep cervical muscle, HNSCC showed a lower ADC1,000, higher ADC2,000, and higher ADCratio than the muscle. In terms of muscle, our ADC data are similar to a previous report that showed that the ADC value of muscle is 1,440 ± 100 × 10−6 mm2/s at 1.5 T, with b values of 0–1,000 s/mm2 (23). We believe that the larger decrease in the ADC values of muscle with the increase in the b value from 1,000 to 2,000 s/mm2 (lower ADCratio values) than that of HNSCCs is due to the lower cellularity and higher extracellular water content.
Recent studies have shown that DWI may be a valuable cancer imaging biomarker for detecting metastasis and cancer relapse (24,25). Physical boundaries of cell membranes, together with cellular and subcellular structures, restrict water diffusion in both normal and neoplastic tissues. The ADC, measured by DWI, has been shown to be inversely correlated with tumor cellularity (20–22). ADC values decrease when b values are increased beyond 1,000 s/mm2 (12,13,16–19). DeLano et al. (16) reported that, for some ROIs, ADC values decreased by approximately 30%–35% when b values were increased from 1,000 s/mm2 to 3,000 s/mm2. If the relationship between the MR signal and the b value was monoexponential, the ADC value would remain constant for any 2-point calculation as the b value is increased. The observed ADC decrease with increasing b value can be explained by biexponential SI decay. Fast and slow diffusion components have been described in human brain models, and at a relatively low b value the SI is dominated by fast diffusion, whereas at a high b value, the SI is governed predominantly by slow diffusion. Intracellular and extracellular water are considered to correspond to, but not exactly equal, slow and fast diffusion components, respectively (12,19,26,27). According to the biexponential SI decay model, some investigators have used different b values of more than 10 (range, 15–4,000 s/mm2) to calculate the fractions of slow and fast diffusion components in tumors, which took more than 3 min per slice (28,29). Although this imaging technique is useful for the differentiation of slow and fast diffusion components, the long scanning time seems to be a limitation for routine clinical practice. We obtained ADC1,000 and ADC2,000 maps from the SIs of 2 points of the b value (b = 0 and 1,000 and 0 and 2,000 s/mm2), for which the total scan time was 4 min 13 s. In addition, we hypothesized that the decrease in ADC values (ADCratio = ADC2,000/ADC1,000) by increasing the b values from 1,000 s/mm2 to 2,000 s/mm2 would reflect the proportion of slow and fast diffusion components in the HNSCCs. The greater the proportion of the slow diffusion component becomes, the higher are the ADCratio increases in tumors, which may be a feasible alternative biomarker for cellularity in HNSCCs.
18F-FDG uptake on PET/CT usually expressed as SUV, is a well-known biomarker for tumor malignancy and prognosis, not only in head and neck cancer but also in most other malignancies. 18F-FDG uptake is primarily determined by glucose transporter and hexokinase activity at a single-cell level, which is affected by various intra- and extracellular conditions such as oncogene activation or hypoxia. These single-cell characteristics are not directly related to ADC. However, at a tissue level, cellularity of viable tumor cell is another main factor in determining 18F-FDG uptake. Although some researchers tried to use this concept to correlate 18F-FDG uptake with ADC, there was no significant correlation between 18F-FDG uptake and ADC1,000 or ADC2,000 in this study. Our correlation analysis resulted in a significant positive correlation between the ADCratio and the SUVmean (r = 0.667, P < 0.001), regardless of tumor differentiation.
The ADC values of HNSCC are known to be lower than those of benign solid tumors in the head and neck, because of hypercellularity (4). However, the ADC values of HNSCCs increase because of micronecrosis and hypervascular portions in the tumors (4), and these conditions correspond to an increased fraction of fast diffusion component in tumors, resulting in a decrease in the ADCratio. Similarly, 18F-FDG uptake is correlated with the number of viable tumor cells and their metabolic activity (30–33) and cellularity (1,2,7), whereas necrosis decreases the SUV of the tumor (2). Therefore, tissue heterogeneity of tumor from necrosis would be one of main factors that bring about a correlation between ADCratio and 18F-FDG uptake. Ho et al. (9) have reported that regions with a relatively low ADC value are significantly and inversely correlated with areas of relatively high SUV in patients with uterine cervical cancer, as was explained by the theory that a tumor with a relatively high SUVmax would have a higher-cellularity region as a result of a relatively high tumor proliferation. However, the correlation was not observed in patients with SCC or poorly differentiated tumors. Thus, we believe that the cellularity of tumors estimated by a single ADC value seems to be limited, and the measurement of ADC based on high b value imaging is necessary to estimate the low diffusion component, which is known to be sensitive to intracellular water.
In the present study, to ensure high-quality images for both qualitative and quantitative assessments, we optimized scanning factors to maximize signal-to-noise ratio and reduce artifacts (e.g., from motion, incomplete fat suppression, residual eddy currents induced by diffusion gradients, and EPI-related artifacts) (34). Thus, we used multiple averaging (n = 4) and the shortest TE achievable in the scanners, and optimized fat suppression technique and bandwidths.
Apart from the intrinsic limits of any retrospective study, other limitations should be mentioned. We used longer TRs (10,000 ms) and shorter TEs (75 ms) for the acquisition of the ADC2,000 maps than for the ADC1,000 maps (TR, 7,100; TE, 84) to optimize the image quality. Ogura et al. (35) investigated the influence of imaging parameters, that is, b value, TR, and TE on the ADC values using a 1.5-T MRI scanner. Their study indicated that scanning DWIs with a long TR (>6,000 ms) and short TE (<100 ms) did not significantly affect the ADC values. Thus, we believe that the ADCratio was barely affected by the TR and TE parameters in the present study.
CONCLUSION
Our study revealed that the ADCratio and the SUVmean were significantly correlated with each other in primary HNSCC patients, possibly because of a higher-cellularity region as a result of relatively increased tumor proliferation. In addition, we believe that a combination of DWI and PET might hold promise for future development of molecular cancer imaging in terms of simultaneous PET/MRI application recently spreading in the clinical field. Further studies are warranted to investigate the possible complementary role of DWI and PET/CT in various clinical settings, including staging and treatment response.
DISCLOSURE STATEMENT
The costs of publication of this article were defrayed in part by the payment of page charges. Therefore, and solely to indicate this fact, this article is hereby marked “advertisement” in accordance with 18 USC section 1734.
Acknowledgments
We thank So Young Yun for her continuous support with updating and organizing the clinical data. This study was supported in part by a grant from the Korea Healthcare Technology R&D Projects, Ministry for Health, Welfare and Family Affairs (A07001 and A090406). No other potential conflict of interest relevant to this article was reported.
Footnotes
↵* Contributed equally to this work.
- © 2011 by Society of Nuclear Medicine
REFERENCES
- Received for publication February 15, 2011.
- Accepted for publication May 2, 2011.


