


Abstract
Prokineticin receptor 1 (PKR1) and its ligand Bv8 were shown to be expressed in inflammation-induced pain and by tumor-supporting fibroblasts. Blocking this receptor might prove useful for reducing pain and for cancer therapy. However, there is no method to quantify the levels of these receptors in vivo. Methods: A nonpeptidic PKR1 antagonist, N-{2-[5-(4-fluoro-benzyl)-1-(4-methoxy-benzyl)-4,6-dioxo-1,4,5,6-tetrahydro-[1,3,5]triazin-2-ylamino]-ethyl}-guanidine, which contains a free guanidine group, was labeled with 18F by reacting the guanidine function with N-succinimidyl-4-18F-fluorobenzoate to give the guanidinyl amide N-(4-18F-fluoro-benzoyl)-N′-{2-[5-(4-fluoro-benzyl)-1-(4-methoxy-benzyl)-4,6-dioxo-1,4,5,6-tetrahydro-[1,3,5]triazin-2-ylamino]-ethyl}-guanidine (18F-PC-10). Inflammation was induced in C57BL/6 mice by subcutaneous injection of complete Freund adjuvant in the paw. The mice were imaged with 18F-PC-10, 18F-FDG, and 64Cu-pyruvaldehyde bis(4-methyl-3-thiosemicarbazone) (64Cu-PTSM) at 24 h after complete Freund adjuvant injection using a small-animal PET device. Results: 18F-PC-10 was synthesized with a radiochemical yield of 16% ± 3% (decay-corrected). 18F-PC-10 accumulated specifically in the inflamed paw 4- to 5-fold more than in the control paw. Compared with 18F-PC-10, 18F-FDG and 64Cu-PTSM displayed higher accumulation in the inflamed paw but also had higher accumulation in the control paw, demonstrating a reduced signal-to-background ratio. 18F-PC-10 also accumulated in PKR1-expressing organs, such as the salivary gland and gastrointestinal tract. Conclusion: 18F-PC-10 can be used to image PKR1, a biomarker of the inflammation process. However, the high uptake of 18F-PC-10 in the gastrointestinal tract, due to specific uptake and the metabolic processing of this highly lipophilic molecule, would restrict its utility.
Prokineticin receptor 1 (PKR1) and prokineticin receptor 2 (PKR2) are closely related G-protein–coupled receptors (1–3). PKR1 is widely distributed in the peripheral tissues, including the gastrointestinal system, lungs, blood leukocytes, spleen, pancreas, testes, salivary gland, and endocrine glands (1,4). The messenger RNA of both PKR1 and PKR2 is expressed in the gastrointestinal system. However, whereas PKR1 is abundantly expressed in the stomach, small intestine, colon, rectum, and other gastrointestinal tissues, PKR2 is expressed only in the ileocecum, suggesting that PKR1 has a major role in the mediation and regulation of gastrointestinal motility (1). PKR2 is also highly expressed in discrete nuclei of the central nervous system (1,5,6).
The prokineticin Bv8—one of the ligands of PKR1—is a small protein (8 kDa) rich in cysteine residues, which was isolated from the skin secretion of the frog Bombina variegata (5,7,8). Homologs of Bv8 were found in skin secretions of other amphibians, lizards, and fish (5). Mamba intestinal toxin-1 (MIT-1), found in the venom of the black mamba, is another Bv8 homolog (5). The mammalian homologous proteins of Bv8 are prokineticin 1 (or vascular endothelial growth factor) and prokineticin 2 (or mBV8) (5,8,9).
Prokineticin proteins have been shown to promote angiogenesis, mainly in several endocrine organs (10–12). These proteins are also involved in other biologic processes such as reproduction, neuronal survival, neurogenesis, control of circadian rhythms, and cancer (5,8,10,13–15). Another reported function of prokineticin proteins is to stimulate the contraction of the isolated guinea pig ileum and relaxation of the colon (7,9,16). Prokineticin 2, but not prokineticin 1, is highly expressed in the bone marrow, lymphoid organs, and leukocytes, suggesting a role for prokineticin 2 in hematopoiesis and in inflammatory and immunomodulatory processes (17,18). Prokineticin 2 also plays a role in the regulation of tumor-supporting myeloid cells (19). Shojaei et al. showed that Bv8 plays a role in the mobilization of tumor angiogenesis, promoting myeloid cells from the bone marrow during tumor development (19).
The prokineticin 2–PKR1 axis plays a major role in pain perception (4). Furthermore, reduction in the pain threshold produced by prokineticin 2 acting on prokineticin receptors in sensory neurons indicates that Bv8 and prokineticin and their receptors may act as mediators of inflammatory and neuropathic pain (20–22). Giannini et al. showed that the prokineticin 2–PKR1 axis plays a role in inflammation-related pain, demonstrating that prokineticin 2 released by inflammatory cells can bind to activated PKR1 on primary sensitive neurons and contribute to inflammatory pain (23). Blocking the prokineticin 2–PKR1 axis might prove useful for reducing pain and for cancer therapy.
To this end, several nonpeptidic prokineticin antagonists have been developed (24–28). However, there is no method to quantify the levels of PKR1 in vivo, to guide appropriate treatment of candidates. In this study, we developed a biomarker based on the nonpeptidic PKR1 antagonist N-{2-[5-(4-fluoro-benzyl)-1-(4-methoxy-benzyl)-4,6-dioxo-1,4,5,6-tetrahydro-[1,3,5]triazin-2-ylamino]-ethyl}-guanidine (PC-7) (Fig. 1) for the noninvasive quantification of PKR1 in an inflammatory pain model using PET. PC-7 contains a free guanidine group and was labeled with the PET isotope 18F by coupling the guanidine function to N-succinimidyl fluorobenzoate (18F-SFB), to give N-(4-18F-fluoro-benzoyl)-N′-{2-[5-(4-fluoro-benzyl)-1-(4-methoxy-benzyl)-4,6-dioxo-1,4,5,6-tetrahydro-[1,3,5]triazin-2-ylamino]-ethyl}-guanidine (18F-PC-10) (Fig. 1). 18F-PC-10 was further evaluated as a biomarker in mice injected with complete Freund adjuvant (CFA), which was shown to induce inflammatory pain by upregulation of prokineticin 2 and PKR1 (23).

(A) Nonradioactive synthesis of PC-10. (B) Radioactive synthesis of 18F-PC-10. DIPEA = diisopropylethyl amine; DMF = dimethylformamide; HOBt = 1-hydroxybenzotriazole; WSC = N-(3-dimethylaminopropyl)-N'-ethylcarbodiimide hydrochloride.
MATERIALS AND METHODS
Chemistry
General Methods.
Compounds were purified by preparative reversed-phase high-performance liquid chromatography (HPLC) (δ-Prep 4000 system with a Prep LC 40-mm assembly column C18; 30 × 4 cm, 15-μm particles; Waters) and eluted at a flow rate of 20 mL/min with mobile phase solvent A (10% acetonitrile + 0.1% trifluoroacetic acid [TFA] in H2O, v/v) and a linear gradient from 10% to 60% B (60%, acetonitrile + 0.1% TFA in H2O, v/v) for 25 min. Analytic HPLC analyses were performed with a System Gold device (Ultrasphere ODS Column, 250 × 4.6 mm, 5-μm particles; Beckman). Analytic determinations and the capacity factor (K′) of the products used for HPLC in solvents A and B were programmed at flow rate of 1 mL/min with linear gradients from 0% to 100% B for 25 min. The analogs had less than 5% impurities at 220 and 254 nm.
The molecular weights of the compounds were determined by a matrix-assisted laser desorption ionization time of flight analysis (G2025A LD-TOF system mass spectrometer; Hewlett Packard) and α-cyano-4-hydroxycinnamic acid as a matrix. 1H-NMR (δ) spectra were measured, when not specified, in dimethylsulfoxide-d6 solution using a spectrometer (AC-200; Bruker), and peak positions are given in parts per million downfield from tetramethylsilane as an internal standard. PC-7 was synthesized according to a published procedure (29).
Synthesis of PC-10.
PC-7 (1 equivalent) and LiOH•H2O (3 equivalents) were dissolved in dimethylformamide. The solution was stirred in an oil bath at 100°C; 4-fluorobenzoic acid (1 equivalent), N-(3-dimethylaminopropyl)-N′-ethylcarbodiimide hydrochloride (1.1 equivalent), and 1-hydroxybenzotriazole (1.1 equivalent) were added in 1 pot as solids. After 1 h at 100°C, the solvent was evaporated and the residue purified by preparative HPLC: yield 40%; HPLC K′ 5.88; m/z 564.6 (M+H)+; 1H-NMR (dimethylsulfoxide-d6) δ 2.50–2.57 (m, 4H), 3.72 (s, 3H), 4.86 (s, 2H), 5.06 (s, 2H), 6.65–7.93 (m, 12H).
Radiochemistry
General Methods.
Kryptofix 2.2.2 was purchased from EMD Chemicals. All other solvents and chemicals were purchased from Sigma-Aldrich Co. Pyruvaldehyde bis(4-methyl-3-thiosemicarbazone) (PTSM) was purchased from ABX GmbH. 18F-fluoride was obtained from the National Institutes of Health Clinical Center cyclotron facility from the irradiation of an 18O-water target by the 18O(p,n)18F nuclear reaction. C18 cartridges (Waters Corp.) were each activated with 5 mL of ethanol and 10 mL of water. 18F-FDG was purchased from Cardinal Health. 64Cu-PTSM was synthesized according to a published procedure (30).
Radiosynthesis of 18F-PC-10.
18F-PC-10 was synthesized in 2 radiochemical steps: radiosynthesis of 18F-SFB and coupling of 18F-SFB with PC-7 to give the desired product 18F-PC-10. 18F-SFB was radiosynthesized on a modular system (Eckert & Ziegler Eurotope GmbH) according to a published procedure (31). 18F-SFB was redissolved in 150 μL of dimethylformamide. PC-7 (200 μg in 50 μL of dimethylformamide) was added, followed by 20 μL of diisopropylethyl amine, and incubated at 60°C for 10 min.
18F-PC-10 was purified on a reversed-phase HPLC system using a Vydac C4 (214TP510, 5 μm, 10 × 250 mm; Grace) column. The flow was set at 4 mL/min using a gradient system starting from 70% solvent A and 30% solvent B and increasing to 35% solvent A and 65% solvent B at 30 min. The retention time (Rt) of 18F-PC-10 on this system was 15.1 min. The HPLC solution of 18F-PC-10 was diluted with 10 mL of water and loaded on an activated C-18 cartridge. The cartridge was washed with 10 mL of water, and 18F-PC-10 was eluted with 80% ethanol. The ethanol was completely evaporated under a stream of argon, and 18F-PC-10 was formulated in saline with the addition of 50 μL of dimethylsulfoxide, to prevent tackiness to the glass tube.
18F-PC-10 quality control was monitored using analytic reversed-phase HPLC on a Vydac C4 (214TP5415, 5 μm, 4.6 × 150 mm) column with a gradient system starting from 100% solvent A (0.1% TFA in water) and 0% solvent B (0.1% TFA in acetonitrile) for 5 min and increasing to 50% solvent A and 50% solvent B at 30 min (flow, 1 mL/min; Rt, 25.81 min). The ultraviolet absorbance was monitored at 254 nm, and the identification of 18F-PC-10 was confirmed by a coinjection with unlabeled PC-10. The Rt of unlabeled PC-10 was 25.65 min.
Biology
Chinese Hamster Ovarian (CHO)-PKR1 and CHO-PKR2 Cell Culture.
CHO-PKR1 and CHO-PKR2 cell lines were kindly provided by Dr. Qun-Yong Zhou from the University of California–Irvine. The cells were grown in Dulbecco's modified Eagle's medium (Gibco) supplemented with 10% (v/v) fetal bovine serum under 5% CO2 at 37°C.
Competition Cell-Binding Assay.
PKR1 and PKR2 binding was assayed to determine binding affinities of PC-10. Briefly, CHO-PKR1 and CHO-PKR2 cells were cultured in Dulbecco's modified Eagle's medium with fetal bovine serum. When cells reached 80% confluence, they were scraped off and suspended with binding buffer (20 mM Tris-HCl, pH 7.4, 150 mM NaCl, 2 mM CaCl2, 1 mM MgCl2, and 1 mM MnCl2, 0.1% bovine serum albumin) for a final concentration of 2 × 10⁶ cells/mL. In a 96-well plate, 1 × 10⁵ of either CHO-PKR1 or CHO-PKR2 cells per well were incubated with 1.11 kBq/well (0.03 μCi/well) of 125I-MIT-1 (Perkin-Elmer) in binding buffer in the presence of different concentrations of PC-10 at room temperature for 2 h. After incubation, the plate was washed 3 times with phosphate-buffered saline (PBS), and the radioactivity was measured by γ-counting. The inhibitory concentration of 50% (IC50) was calculated by nonlinear regression analysis using the GraphPad Prism computer-fitting program (GraphPad Software, Inc.). Each data point is a result of the average of duplicate wells.
Cell Uptake, Internalization, and Efflux Studies.
For cell uptake studies, CHO-PKR1 cells were seeded into a 24-well plate at a density of 1 × 10⁵ cells per well and incubated with 444 kBq/well (12 μCi/well) of 18F-PC-10 at 37°C for 15, 30, 60, and 120 min. Tumor cells were then washed twice with cold PBS and harvested by addition of 250 μL of 0.1 M NaOH. Internalization studies were performed similarly to the procedure described for the cell uptake studies. After 15, 30, 60, and 120 min of incubation of CHO-PKR1 cells with 18F-PC-10 at 37°C, the cells were washed twice with cold PBS and then incubated for 1 min with acid-washing buffer (50 mmol/L glycine, 0.1 M NaCl, pH 2.8) to remove surface-bound radioactive ligand. Thereafter, the cells were washed twice with cold PBS and harvested by addition of 250 μL of 0.1 M NaOH. For efflux studies, 444 kBq/well (12 μCi/well) of 18F-PC-10 were added to CHO-PKR1 cells in a 24-well plate and incubated for 2 h at 37°C. Then cells were washed twice with cold PBS and incubated with Dulbecco's modified Eagle's medium for 15, 30, 60, and 120 min. After being washed twice with PBS, cells were harvested by addition of 250 μL of 0.1 M NaOH. The cell suspensions were collected and measured in a γ-counter (1480 Wizard 3; Perkin-Elmer). Each data point is an average of triplicate wells.
CFA Inflammation Model.
CFA (Sigma-Aldrich) was emulsified with PBS in a 1:1 ratio and injected subcutaneously into the paw in a volume of 20 μL. Inflammation-induced pain was shown to peak at 24 h after CFA injection; hence, 18F-PC-10, 18F-FDG, or 64Cu-PTSM was administered at that time point. Inflammation was verified visually by inspection of the draining lymph node.
PET Studies.
CFA-injected mice were anesthetized using isoflurane/O2 (1.5%–2% v/v) and injected with 1.85–3.7 MBq (50–100 μCi) of 18F-PC-10, 18F-FDG, or 64Cu-PTSM in a volume of 100 μL of PBS. For blocking experiments, 1.85–3.7 MBq (50–100 μCi) of 18F-PC-10 were coinjected with 350 μg of unlabeled PC-7. PET scans were obtained using an Inveon DPET scanner (Siemens Medical Solutions) at 0.5, 1, and 2 h after injection. Each group contained 3–5 mice. The images were reconstructed by a 3-dimensional ordered-subsets expectation maximum algorithm, and no correction was applied for attenuation or scatter. Images were analyzed using ASI Pro VM software. The percentage injected dose per gram (%ID/g) for the various tissues was determined by drawing regions of interest surrounding the paws on the coronal images. The radioactivity contained in the region of interest divided by the dose administered to the animal gave the %ID, and the volume of the region of interest was converted to mass assuming a density of 1 for the tissue.
Biodistribution.
At 2 h after injection of 18F-PC-10, mice were anesthetized and their blood was drawn from the heart. The liver, muscle, kidneys, gastrointestinal tract, bone, salivary gland, and control and inflamed paws were removed. The organs were weighed and assayed for radioactivity using a γ-counter (1480 Wizard 3; Perkin-Elmer). Each group contained 4–5 mice.
Statistical Analysis
Results were expressed as mean ± SD. Two-tailed paired and unpaired Student t tests were used to determine differences within groups and between groups, respectively. P values of less than 0.05 were considered statistically significant.
RESULTS
Synthesis of PC-10
The nonpeptidic PKR1 antagonist PC-7 was synthesized according to a published procedure (29). PC-7 was coupled with 4-fluorobenzoic acid for 1 h at 100°C using the coupling reagents N-(3-dimethylaminopropyl)-N′-ethylcarbodiimide hydrochloride and 1-hydroxybenzotriazole to give PC-10 as a white powder in a 40% yield (Fig. 1A).
Radiosynthesis of 18F-PC-10
18F-SFB conjugation to PC-7 occurred on a free guanidine group in the presence of a base (Fig. 1B). The conjugation was done with moderate heating for 10 min. Analytic HPLC was performed to follow the conversion to the desired 18F-PC-10 and the consumption of 18F-SFB.
When only 100 μg of PC-7 were used, there was still unreacted 18F-SFB (Rt, 10.91 min) remaining, as detected by analytic HPLC (Fig. 2). There is also a formation of 4-18F-fluorobenzoic acid (Rt, 4.09 min) due to the basic conditions of the coupling reaction. The formation of 18F-PC-10 can be clearly seen by elution of the radioactive peak at a Rt of 25.81 min (Fig. 2). There are several other unidentifiable radioactive peaks formed during the coupling reaction.

Radioactive analytic HPLC of crude sample of conjugation reaction of PC-7 (100 μg) with 18F-SFB to give 18F-PC-10. mAU = milliabsorbance unit.
18F-PC-10 was purified on a reversed-phase HPLC system and was achieved with radiochemical and chemical purities both greater than 99% and a specific activity of 70.3 ± 7.4 TBq/mmol (1,900 ± 200 Ci/mmol) at the end of synthesis. The overall decay-corrected yield of 18F-PC-10 was 16% ± 3% (n = 4), based on 18F-fluoride radioactivity at the start of synthesis. The average total synthesis time, including HPLC purification and formulation, was about 160 min.
Competitive Binding Assay with 125I-MIT-1
The affinity of PC-10 to CHO cells transfected with either human PKR1 or human PKR2 was evaluated in a competitive binding assay with the commercially available Bv8 homolog MIT-1, labeled with 125I (125I-MIT-1). The IC50 of PC-10 binding to CHO-PKR1 cells was much lower than that achieved for PC-10 binding to CHO-PKR2 cells (109.7 ± 4.91 vs. 1,200 ± 69.47 nM, respectively). The binding affinity of PC-10 to PKR1 is 3-fold lower than the functional IC50 of PC-7 (33 nM) required to induce calcium mobilization in human PKR1–expressing cells, as previously reported in the literature (29).
Uptake, Internalization, and Efflux Studies
The cell uptake, internalization, and efflux of 18F-PC-10 were evaluated in CHO-PKR1 cells. 18F-PC-10 uptake increased between 15 min and 0.5 h (Fig. 3A), reached a plateau at 0.5 h, and remained at a similar level for up to 1 h. There was a slight decrease in the uptake between 1 and 2 h (Fig. 3A). To evaluate the internalization of the tracer, cells were treated with acid buffer (pH 2.8) before the final wash. Approximately half of the observed uptake was due to internalization of 18F-PC-10 into the cells. The internalization also reached a plateau at 0.5 h, remaining stable up to 2 h after incubation. Retention studies showed a rapid release of 18F-PC-10 by CHO-PKR1, and within 15 min after the replacement of the medium, half of the activity was unbound and reached a plateau after 1 h.

(A) Cell uptake, internalization, and efflux assays of 18F-PC-10 in CHO-PKR1 cells. (B) Representative coronal (right) and axial (left) PET images of a C57BL/6 mouse injected with CFA into right paw at 1 h after injection with 3.7 MBq (100 μCi) of 18F-PC-10. Arrows indicate inflamed paw. CPM = counts per min.
PET and Biodistribution
The targeting efficiency of 18F-PC-10 in a CFA-induced inflammatory pain model in mice was evaluated by static small-animal PET scans. 18F-PC-10 had clearly higher accumulation in the inflamed paw than in the control paw (Fig. 3B). 18F-PC-10 had an uptake of 0.95 ± 0.20 %ID/g in the inflamed paw at 0.5 h after injection. This uptake was slightly increased at 1 h (1.21 ± 0.32 %ID/g, Fig. 4A). At 2 h after injection, the uptake decreased to 0.78 ± 0.04 %ID/g in the inflamed paw and from 0.25 ± 0.06 %ID/g to 0.13 ± 0.01 %ID/g in the control paw (Fig. 4A). At all time points, 18F-PC-10 uptake in the inflamed paw was significantly higher than in the control paw (P < 0.01, Fig. 4A).

(A) Uptake of 18F-PC-10 in inflamed, control, and inflamed-block paws of C57BL/6 mice, treated with CFA at 24 h before imaging and at 0.5, 1, and 2 h after injection. Results are calculated from PET scans and are shown as averages of 4–5 mice ± SD. (B) Biodistribution of C57BL/6 CFA–treated mice injected with 18F-PC-10 at 2 h after injection. Results shown are averages of 4–5 mice ± SD. CTRL = control. *P < 0.01 vs. control paw. #P < 0.05 vs. inflamed-block paw.
To determine the PKR1 specificity of 18F-PC-10 in vivo, CFA-treated mice were coinjected with 18F-PC-10 and an excess amount of the potent PKR1 antagonist PC-7. The uptake in the inflamed paw decreased significantly by approximately 70% at 1 h after injection (0.35 ± 0.01 %ID/g), confirming specific binding of 18F-PC-10 to PKR1 (Fig. 4A).
18F-PC-10 also accumulated in PKR1-expressing organs (Figs. 3B and 4B), such as the salivary gland (3.05 ± 1.10 %ID/g at 2 h after injection) and gastrointestinal tract (54.3 ± 2.5 %ID/g at 2 h after injection). 18F-PC-10 had fast clearance from the blood (0.22 ± 0.05 %ID/g at 2 h after injection) and moderate uptake in the liver and kidneys (3.80 ± 1.14 and 5.26 ± 1.06 %ID/g, respectively, at 2 h after injection, Fig. 4B). 18F-PC-10 uptake in the bone was low (0.69 ± 0.12 %ID/g at 2 h after injection, Fig. 4B), suggesting that there is no significant defluorination in vivo.
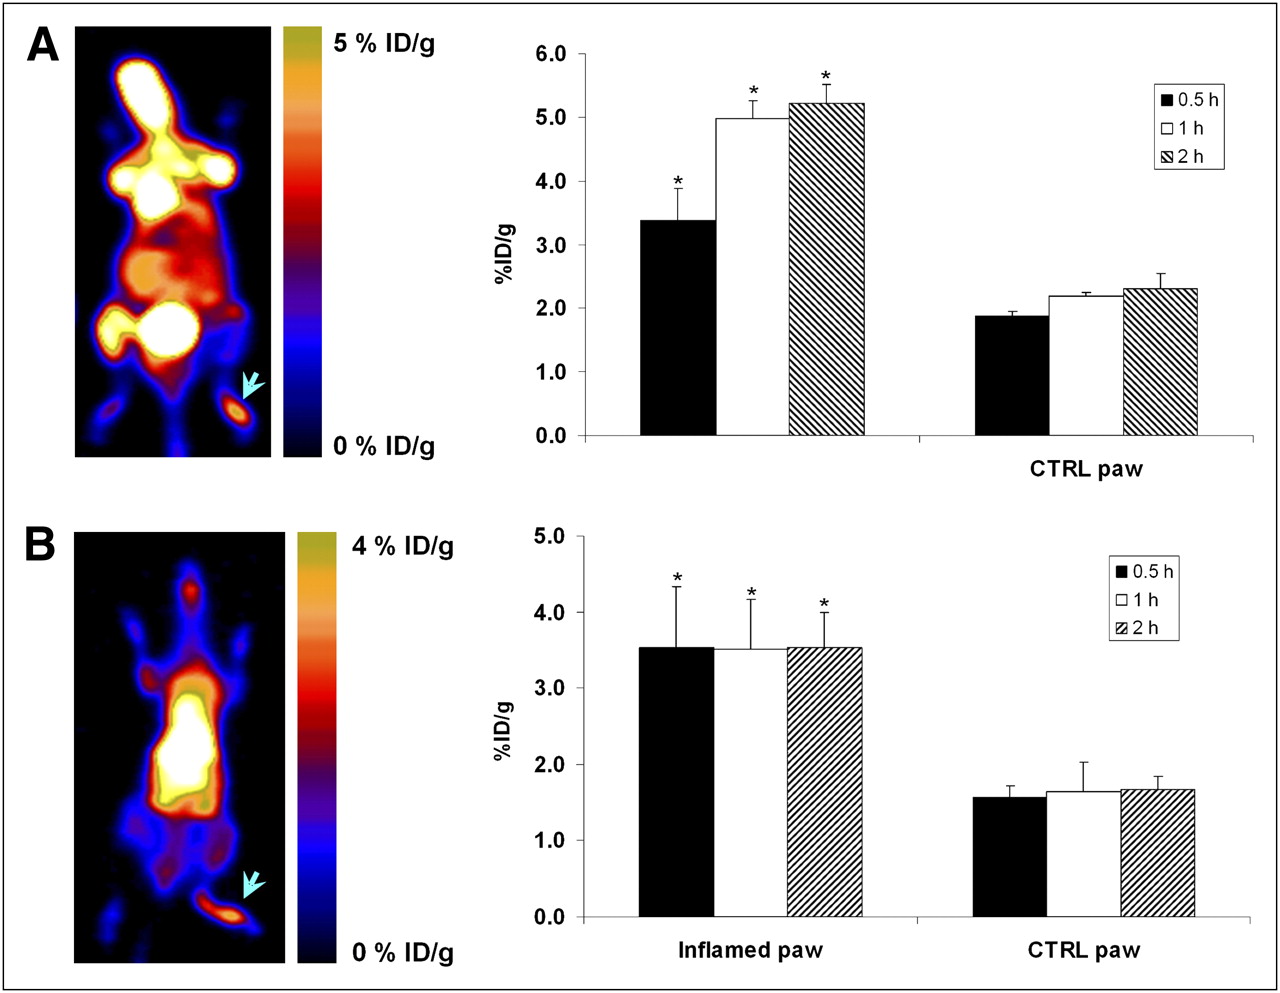
To compare the efficiency of 18F-PC-10 as a biomarker for inflammation, CFA-treated mice were injected with 18F-FDG—which measures glucose metabolism rate and is known to accumulate in inflammatory foci (32,33)—and scanned at 0.5, 1, and 2 h after injection (Fig. 5A). At all time points, 18F-FDG uptake was higher than 18F-PC-10 uptake in the inflamed paw. For example, at 1 h, 18F-FDG uptake in the inflamed paw was 4.98 ± 0.28 %ID/g (Fig. 5A), which is almost 5 times higher than the uptake achieved with 18F-PC-10. This difference was further increased at 2 h after injection, because 18F-PC-10 started to undergo clearance. 18F-FDG uptake in the inflamed paw, however, remained stable and high, because of its retention mechanism within the cell (5.21 ± 0.29 %ID/g, Figs. 4A and 5A).

(A; left) Representative coronal PET image of C57BL/6 mouse injected with CFA into right paw at 1 h after injection with 3.7 MBq (100 μCi) of 18F-FDG. (Right) Uptake of 18F-FDG in inflamed and control paws of C57BL/6 mice, treated with CFA at 24 h before imaging and at 0.5, 1, and 2 h after injection. Results are calculated from PET scans and are shown as averages of 3–4 mice ± SD. (B; left) Representative coronal PET image of C57BL/6 mouse injected with CFA into right paw at 1 h after injection with 3.7 MBq (100 μCi) of 64Cu-PTSM. (Right) Uptake of 64Cu-PTSM in inflamed and control paws of C57BL/6 mice, treated with CFA at 24 h before imaging and at 0.5, 1, and 2 h after injection. Results are calculated from PET scans and are shown as averages of 3–4 mice ± SD. CTRL = control. *P < 0.01 vs. control paw.
In addition, 18F-PC-10 uptake in the inflamed paw was compared with CFA-treated mice injected with the perfusion imaging agent 64Cu-PTSM. 64Cu-PTSM also had higher uptake in the inflamed paw than did 18F-PC-10 at all time points (Fig. 5B). 64Cu-PTSM uptake in the inflamed and control paws was stable at all time points (∼3.50 %ID/g in the inflamed paw and 1.60 %ID/g in the control paw, Fig. 5B).
Uptake in the control paw was much higher for both 18F-FDG and 64Cu-PTSM than for 18F-PC-10. 18F-FDG and 64Cu-PTSM uptake in the inflamed paw was only 2-fold higher than in the control paw (Fig. 5). In contrast, 18F-PC-10 uptake was 4–5 times higher in the inflamed paw than in the control paw (Fig. 4). The ratios between the inflamed and control paws at all time points show that the inflamed paw–to–control paw ratio is higher for 18F-PC-10 than for either 18F-FDG or 64Cu-PTSM (Fig. 6).

Inflamed paw–to–control paw ratios of either 64Cu-PTSM (white bars), 18F-FDG (hatched bars), or 18F-PC-10 (black bars) at 0.5, 1, and 2 h after injection. Results shown are averages of 3–5 mice ± SD. CTRL = control.
DISCUSSION
Prokineticin receptors are G-protein–coupled receptors belonging to the neuropeptide Y receptor class, and their importance is emphasized by the fact that one of their ligands, MIT, is present in snake venom (5). The prokineticin 2–PKR1 axis was shown to be expressed in inflamed tissue and was suggested as a link between cells infiltrating the inflamed tissue and the development of inflammatory pain (23). Giannini et al. have demonstrated that the development and duration of CFA-induced hyperalgesia correlates with the messenger RNA expression level of prokineticin 2 in the inflamed paw, and they have shown that 24 h after CFA induction, there is elevation in messenger RNA expression of PKR1 (23). One possible explanation for higher PKR1 expression in the inflamed tissue is that prokineticin 2, which was also shown to have chemotactic capability, induces accumulation of cells that express its receptor.
To quantify PKR1 levels in inflammation induced by CFA injection, we modified the known nonpeptidic PKR1 antagonist PC-7 (29). PC-7 contains a free guanidine group and was conjugated with p-fluorobenzoic acid to give PC-10 (Fig. 1A). The affinity of PC-10 to PKR1 and PKR2 was tested and demonstrates that PC-10 is more selective and potent to PKR1 than to PKR2.
PC-7 was also used as a precursor for the labeling with 18F (Fig. 1B). PC-10 was labeled with 18F via conjugation of PC-7 with 18F-SFB. 18F-SFB is a prosthetic group, which is usually used in peptide labeling for coupling to ε- or α-amino groups (31,34,35). PC-7 was conjugated with 18F-SFB in dimethylformamide in the presence of a base and for a short reaction time. One of the byproducts of the coupling reaction was 18F-fluorobenzoic acid (Fig. 2). Because the reaction was conducted in dimethylformamide and base (diisopropylethyl amine), the formation of both 18F-PC-10 and 18F-fluorobenzoic acid was rapid. Increasing the amount of PC-7 used for the radiosynthesis (from 100 to 200 μg) resulted in a higher radiochemical yield of 18F-PC-10 and complete elimination of 18F-SFB. Increasing the amount of PC-7 even more did not change significantly the reaction kinetic and yield. Unreactive PC-7 was detected by ultraviolet absorbance (data not shown). Attempts to use only 100 μg of PC-7 resulted in unreactive 18F-SFB (Fig. 2). When additional base was added to improve the conversion to 18F-PC-10, decomposition of 18F-SFB to 18F-fluorobenzoic acid was detected, along with an overall decrease in the radiochemical yield of desired product.
Inflammation-related pain was induced in C57BL/6 mice by subcutaneous injection of CFA into the right paw, and 24 h later, the mice were injected intravenously with 18F-PC-10. 18F-PC-10 was clearly visualized in the inflamed paw (Figs. 3B), and the uptake in the inflamed paw was 4- to 5-fold higher at all time points (0.5, 1, and 2 h) than the uptake in the control paw (Fig. 4A). 18F-PC-10 uptake in the inflamed paw was decreased at 2 h after injection, suggesting that the optimal imaging time with 18F-PC-10 should not exceed 2 h after injection. This result is in accordance with the cell studies, with optimal uptake of 18F-PC-10 at 1 h after incubation and some reduction in the activity on the cells at 2 h. Blocking studies by coinjection of 18F-PC-10 and the more potent PKR1 antagonist PC-7 (which has a chemical structure similar to that of PC-10) showed a significant decrease in the inflamed paw uptake, suggesting a specific binding to PKR1 (Fig. 4A).
18F-PC-10 also displayed uptake in PKR1-expressing organs, such as the salivary gland and gastrointestinal tract. Low uptake in the kidneys and liver (Fig. 4B) and increased uptake in the gastrointestinal tract suggest that the main clearance route of 18F-PC-10 is via the small intestine and colon, which means that the radioactivity in the gastrointestinal tract is not solely due to specific binding to PKR1. Clearance via the gastrointestinal tract could possibly be because of the lipophilicity of 18F-PC-10, and modification of the small molecule to be more hydrophilic might change the pharmacokinetics and enable the visualization of specific binding of 18F-PC-10 to PKR1 in the lower abdomen, including the intestine. The high uptake in the intestine is most unfortunate, because several conditions could induce inflammatory pain in this organ (36).
Another issue that we addressed here was the possibility that the higher accumulation in the inflamed paw was due to the inflammatory process, which may cause regional increases in blood flow, vascular permeability, and extracellular volume that result in nonspecific uptake of biomarkers. For these reasons, we compared 18F-PC-10 uptake with 18F-FDG and 64Cu-PTSM uptake in the inflamed paw. 18F-FDG measures the glucose metabolic rate and is mainly used as a cancer imaging agent but also accumulates in inflammatory lesions (32,33). 64Cu-PTSM is known as a perfusion imaging biomarker and should be able to determine blood flow to the region (37,38).
18F-FDG and 64Cu-PTSM had 2-fold higher uptake in the inflamed paw than in the control paw at all time points, implying that there is high blood flow in the CFA-treated animal model that we used. Neither of these tracers is specific. They can give information regarding perfusion and metabolism but cannot give any biochemical information regarding the inflammation. Although 18F-FDG and 64Cu-PTSM had significantly higher uptake than 18F-PC-10 in the inflamed paw (Figs. 4A and 5), they also had significantly higher uptake than 18F-PC-10 in the control paw (10-fold higher).
Therefore, a comparison of the ratio of inflamed paw to control paw (Fig. 6) shows that 18F-PC-10 has an advantage over 18F-FDG and 64Cu-PTSM in term of less background (less accumulation in the control paw), leading to higher PET image contrast between the inflamed and control paws. In addition, 18F-PC-10 binds specifically to PKR1 in vivo and gives information that might be helpful for therapeutic intervention for inflammation-related pain.
CONCLUSION
Overall, we successfully labeled the selective nonpeptidic PKR1 ligand 18F-PC-10. A CFA injection induced 18F-PC-10 specific uptake in the inflamed paw that expressed PKR1. 18F-PC-10 showed a higher inflamed paw–to–control paw ratio than 18F-FDG and 64Cu-PTSM, resulting in better PET contrast. PKR1 and PKR2 should be further investigated as potential targets for the imaging of pain. More hydrophilic imaging agents can be developed and may improve the image quality.
Acknowledgments
We thank Weihua Li for skillful assistance with data acquisition and Dr. Roberta Lattanzi for the preliminary in vivo assay of cold PC-10. This research was supported in part by the Intramural Research Program (IRP) of the National Institute of Biomedical Imaging and Bioengineering (NIBIB), National Institute of Allergy and Infectious Diseases (NIAID), National Institutes of Health (NIH), International Cooperative Program of National Science Foundation of China (NSFC) (81028009), and Italian Ministry of University and Scientific Research (PRIN 2007).
- © 2011 by Society of Nuclear Medicine
REFERENCES
- Received for publication October 29, 2010.
- Accepted for publication December 28, 2010.


