


Abstract
Reliable assessment of hepatic function during liver regeneration is crucial after liver surgery or liver transplantation. 99mTc-galactosyl human serum albumin (99mTc-GSA) scintigraphy, 99mTc-mebrofenin hepatobiliary scintigraphy (HBS), the indocyanine green (ICG) clearance test, and the galactose elimination capacity (GEC) are common quantitative liver function tests. However, to our knowledge, comparative analysis between these tests has never been performed during liver regeneration. The aim of this study was therefore to compare 99mTc-GSA scintigraphy, 99mTc-mebrofenin HBS, the ICG clearance test, and GEC in the assessment of hepatic function during liver regeneration in rats. Methods: Rats were subjected to 70% partial hepatectomy (PHx). Liver function and functional volume were determined at predefined times after PHx and expressed as a percentage of baseline (pre-PHx) values. Results: During liver regeneration, functional liver volume measured by 99mTc-GSA SPECT correlated strongly with conventional liver volume based on wet weight. One day after 70% PHx, conventional liver volume overestimated liver function as measured by 99mTc-mebrofenin uptake and excretion rates, 99mTc-GSA uptake rate, and ICG clearance. On days 5 and 7, 99mTc-mebrofenin uptake and ICG clearance had recovered to levels similar to conventional liver volume, whereas 99mTc-GSA uptake reflected a reduced liver function in relation to conventional liver volume and 99mTc-mebrofenin uptake. The GEC measurements consistently overestimated liver function during regeneration. Conclusion: Volumetric assessment of the liver should be complemented by liver function–specific assays. Functional regeneration is impaired, compared with volumetric regeneration, in the early phase of liver regeneration. In later stages of liver regeneration, 99mTc-GSA uptake underestimates hepatic regeneration in comparison to liver volume and 99mTc-mebrofenin uptake. GEC is of less value because it is only minimally affected by 70% PHx and is influenced by factors not related to liver function. 99mTc-mebrofenin HBS has the advantage of providing visual and quantitative information regarding both uptake and excretory liver function.
- liver function
- indocyanine green
- hepatobiliary scintigraphy
- 99mTc-mebrofenin
- galactose elimination capacity
- 99mTc-GSA scintigraphy
The capacity of the liver to regenerate is crucial for the clinical outcome of patients undergoing liver transplantation or partial hepatectomy (PHx). Several conditions can influence liver regeneration, including the extent of resection, diabetes, and the presence of underlying liver disease ( 1). In the case of liver transplantation, the length of the cold ischemic period and the presence of organ rejection are of additional importance. Reliable assessment of liver function during regeneration is therefore important after transplantation or PHx.
Postoperative liver regeneration is clinically evaluated by measuring the increase in remnant liver volume using CT volumetry. Although liver volume constitutes the clinical gold standard for liver function ( 2, 3), it does not necessarily represent liver function during regeneration, underscoring the importance of liver function–specific methods ( 4– 6).
The liver is responsible for a spectrum of functions including the uptake, metabolism, conjugation, and excretion of various endogenous and foreign substances as well as the synthesis of vital plasma proteins. Over the last decades, several quantitative dynamic liver function tests have been developed, each measuring a distinct component of liver function. These quantitative dynamic liver function tests include the indocyanine green (ICG) clearance test and the galactose elimination capacity (GEC) ( 6– 8), of which the former is the most frequently used ( 2). ICG is a tricarbocyanine dye almost exclusively cleared from the plasma by hepatocyte transporters located on the basolateral membrane and subsequently excreted into the bile without biotransformation ( 9). The specific hepatic transporters for ICG are currently elusive, albeit the involvement of members of the organic anion transporter polypeptide (OATP) family has been proposed ( 10). GEC measures the rate of galactose elimination from the blood, which depends mainly on phosphorylation of galactose by galactokinase within the hepatocyte cytoplasm ( 11).
99mTc-labeled galactosyl human serum albumin (99mTc-GSA) scintigraphy and 99mTc-(2,4,6-trimethyl-3-bromo)-iminodiacetic acid (99mTc-mebrofenin) hepatobiliary scintigraphy (HBS) are 2 nuclear imaging techniques used for quantitative assessment of liver function in liver surgery and transplantation ( 3). 99mTc-GSA scintigraphy was developed in Japan and is currently not approved for clinical use in Europe and the United States. 99mTc-GSA is a synthetic asialoglycoprotein that binds to the asialoglycoprotein receptor (ASGPR). ASGPR is abundantly expressed on the hepatocyte sinusoidal surface ( 12), and its expression is reduced with increased severity of chronic liver disease such as cirrhosis ( 3, 13, 14). Dynamic 99mTc-GSA scintigraphy can be combined with SPECT, enabling the assessment of liver function and functional liver volume (FLV) within 1 test ( 1, 3). 99mTc-mebrofenin HBS has more recently been described for the assessment of liver function in the context of liver surgery ( 3, 4, 15, 16). 99mTc-mebrofenin is an organic anion that is transported into hepatocytes by OATPs ( 17) and is subsequently excreted in the bile. 99mTc-mebrofenin HBS measures both the uptake and the excretory function of the liver.
There are no studies comparing the outcome of the different quantitative liver function tests within a standardized, clinically relevant model, although all the tests are clinically used. We therefore compared 99mTc-mebrofenin HBS, 99mTc-GSA scintigraphy, ICG clearance, and GEC for the assessment of hepatic function during liver regeneration using a well-established rat model of 70% PHx.
MATERIALS AND METHODS
Animals
Experimental protocols were approved by the institute's animal ethics committee. Animals received care in accordance with the National Institutes of Health guidelines ( 18). Male Wistar rats (Harlan) were acclimatized for 1 wk under standardized laboratory conditions in a temperature-controlled room with a 12 h-light–dark cycle and access to standard chow and water ad libitum.
Surgical Procedure
Animals (270–320 g) were anesthetized by a mixture of O2:air (1:1 v/v, 2 L/min) and 2%–3% isoflurane (Forane; Abbott Laboratories) and subcutaneous administration of buprenorphine (0.1 mg/kg, Temgesic; Schering-Plough). After a midline laparotomy, 70% PHx was performed by resecting the median and left lateral lobes as described before ( 1).
Experimental Design
Animals (n = 60) were allocated to 2 protocols that were divided into 5 separate subgroups. In protocol 1, liver function was determined by 99mTc-GSA scintigraphy with SPECT, followed by the ICG clearance test on days 1, 3, 5, and 7 (n = 6/group) after 70% PHx. The control group (n = 6, day 0) underwent no resection. Protocol 2 was similar to protocol 1, except that liver function was measured by 99mTc-mebrofenin HBS, followed by the GEC test.
In clinical studies, many different quantification methods have been applied for the different liver function tests used in our experiments, of which only a few have been validated in small-animal models. Therefore, we used only the quantification methods that have been validated in small-animal models ( 3).
Animals were sacrificed after the liver function tests, and liver biopsy samples were snap-frozen in liquid nitrogen or fixed in 4% buffered formaldehyde for histologic or biochemical analyses.
Conventional Liver Volume (CLV)
Liver (wet) weight was measured after sacrifice using a laboratory scale. CLV was extrapolated using a density of 1.19 mL/g ( 19).
Hepatocyte Proliferation
Immunostaining for Ki-67 was performed as a marker of hepatocyte cell proliferation. Liver biopsy specimens were fixed in 4% buffered formaldehyde and embedded in paraffin. Sections (4 μm) were deparaffinized, and endogenous peroxidase activity was blocked by incubation in 0.3% H2O2 in methanol. Subsequently, sections were immersed in 10 mM Tris/1 mM ethylenediaminetetraacetic acid buffer, pH 9.0, boiled for 20 min, and incubated with rabbit anti-Ki-67 monoclonal antibody (Lab Vision) for 1 h at room temperature. Anti-Ki-67 antibodies were secondarily labeled with antirabbit poly-horseradish peroxidase (Immonologic) for 30 min, followed by incubation with diaminobenzidine (Sigma-Aldrich) to label peroxidase complexes. Sections were counterstained with hematoxylin. The percentage of Ki-67–positive hepatocytes was quantified with ImageJ software (Ki-67 plugin, National Institutes of Health) ( 20) using 6 visual fields per slide (20× magnification).
Hepatocyte Diameter
A microscope (DM400B; Leica Microsystems) equipped with a DC300 digital camera (Leica) and Qwin software was used to measure hepatocyte diameter on hematoxylin-stained slices at 40× magnification.
Oil Red O and Periodic Acid–Schiff Staining
Liver cryosections were routinely stained for the presence of fat with oil red O. Glycogen was stained in formaldehyde-fixed, paraffin-embedded sections with a periodic acid–Schiff stain. Sections were counterstained with hematoxylin.
Scintigraphic Imaging
Nuclear scans were obtained after an overnight fast as described before ( 1). A bolus of 40 MBq of 99mTc-mebrofenin (Bridatec; GE Healthcare) or 40 MBq of 99mTc-GSA (Nihon Mediphysics) in 0.3 mL of saline was administered through the tail vein. A γ-camera (ARC 3000; Philips) available in a dedicated animal care facility was equipped with a pinhole collimator fitted with a 3-mm tungsten insert. Dynamic images were acquired during 30 min (10 min at 5 s/frame and 20 min at 60 s/frame) at the 140-keV 99mTc peak with a 15% window in a 128 × 128 matrix. Data were processed with dedicated software (Hermes Medical Solutions).
99mTc-GSA Scintigraphy Data Acquisition and Analysis
The 99mTc-GSA uptake rate was calculated using scanned radioactivity values acquired between 60 and 180 s after injection as described before ( 1). 99mTc-GSA SPECT was used to calculate FLV as reported previously ( 1). After dynamic 99mTc-GSA scintigraphy, SPECT images were acquired at 30 min after intravenous injection of 99mTc-GSA. Fifty projections (matrix, 128 × 128) were made in a 360° orbit. SPECT reconstructions were compiled with Hermes software adapted for pinhole SPECT using filtered backprojection and a Butterworth postreconstruction filter (order of 5, 0.8 cycles/cm). An outline extraction method with a threshold of 40% of the maximal voxel count was applied to the reconstruction to determine the FLV.
ICG Clearance Test
The ICG clearance test was performed after 99mTc-GSA scintigraphy. ICG (PULSION Medical Systems) was dissolved in sterile water to a final concentration of 2.5 mg/mL. The right carotid artery was cannulated for blood sampling, after which freshly prepared ICG was injected into the penile vein (2.5 mg/kg). Blood samples were obtained before and at 1, 2, 3, 4, 6, 8, and 10 min after ICG injection. Plasma samples were diluted (150 μL of plasma with 750 μL of 1% bovine serum albumin in 0.9% NaCl) and measured spectrophotometrically at 805 nm (Uvikon 850; Kontron Instruments). The ICG disappearance constant (k) was derived from the slope of the semilogarithmic decay curve. Accordingly, the ICG plasma disappearance rate (%/min) was calculated by using the formula k × 100 ( 21).
99mTc-Mebrofenin HBS Data Acquisition and Analysis
The hepatic 99mTc-mebrofenin uptake rate (%/min) was calculated from 3 different time–activity curves obtained from regions of interest around the liver, mediastinum (the blood pool), and total field of view using radioactivity values acquired between 30 and 120 s after injection ( 22, 23). A liver region of interest, that excluded large bile ducts and superimposed bowel loops, was established to create a hepatic time–activity curve for the calculation of the excretory liver function. The time at which maximal hepatic activity occurred was determined, upon which the calculation of time required for peak activity to decrease by 50% (t½ peak) was based.
GEC
The right carotid artery was cannulated, after which a bolus of galactose (0.5 g/kg; 20%) was injected through the tail vein during a period of 2 min. Blood samples (400 μL) were drawn from the carotid artery before and at 10, 20, 25, 30, 35, 40, and 50 min after injection. After 50 min, urine was collected from the bladder. The galactose concentration in plasma and urine was assayed spectrophotometrically at 340 nm, based on the reaction of galactose and nicotinamide adenine dinucleotide (NAD), into galactolactone and nicotinamide adenine dinucleotide plus hydrogen (NADH). The amount of galactose excreted in the urine was calculated by multiplying the urine volume by the galactose concentration in the urine. The GEC was calculated using the equation modified from the work of Tygstrup (
11):
Quantitative Real-Time Polymerase Chain Reaction
Total RNA was isolated from frozen liver tissue (70–100 mg) with TRIzol Reagent (Invitrogen) according to the manufacturer's instructions. RNA quality was verified with a bioanalyzer (Agilent Technologies). First strand complementary DNA was generated from 1 μg of messenger RNA (mRNA) using a mixture of 40 pmol of gene-specific reverse-transcription primers ( Table 1), 11 pmol of 18S ribosomal RNA primer (household gene, Table 1), and 134 units of Superscript III reverse transcriptase (Invitrogen) in a 10-μL volume as described before ( 24). The gene-specific reverse-transcriptase reaction mixtures were column-purified using a Qiaquick PCR purification kit (Qiagen). Real-time quantitative polymerase chain reaction (PCR) was performed on a LightCycler 480 (Roche Diagnostics) using 1 μL of complementary DNA and 9 μL of a reaction mix containing 5 μL of LightCycler 480 SYBR Green I Master Mix (Roche Diagnostics), 1 μL of gene-specific primer pairs (5 pmol of forward and reverse primers) and 3 μL of PCR-grade water (Roche Diagnostics). PCR conditions were as follows: denaturation at 95°C for 6 min, followed by 45 cycles of amplification (95°C for 10 s, 60°C for 5 s, and 72°C for 15 s). PCR specificity was verified by melting-curve analysis and agarose gel electrophoresis. mRNA quantification was performed using LinReg PCR software ( 25). The mRNA starting levels were normalized to the 18S ribosomal RNA starting levels. The mRNA levels of the experimental groups were subsequently expressed as a percentage of control.
Primers Used for Real-Time Quantitative PCR
Statistical Analysis
Correlation between variables was tested using Spearman correlation analysis. Continuous data were compared by ANOVA using rank-transformed values, followed by a Dunnett post hoc test for comparing the experimental groups with the control group and a Tukey post hoc test for pairwise comparison of the experimental groups. For the comparative analyses between the different liver function tests and between the different mRNA expression profiles, a repeated-measurement ANOVA with rank-transformed values was used. All tests were performed using the Statistical Package for Social Sciences (SPSS, Inc.), and 2-tailed P values of less than 0.05 were considered significant. Data are expressed as mean ± SD.
RESULTS
Comparability of Protocols for Conventional Parameters of Liver Regeneration
No statistical differences were found between the 2 protocols with respect to the outcome of hepatocyte proliferation and the recovery of CLV ( Table 2). The lack of statistical differences for both liver regeneration–related parameters allowed the comparison between the different quantitative tests performed in the 2 protocols.
Two Protocols Showing Outcome of CLV and Mitotic Index
Hepatocyte Proliferation
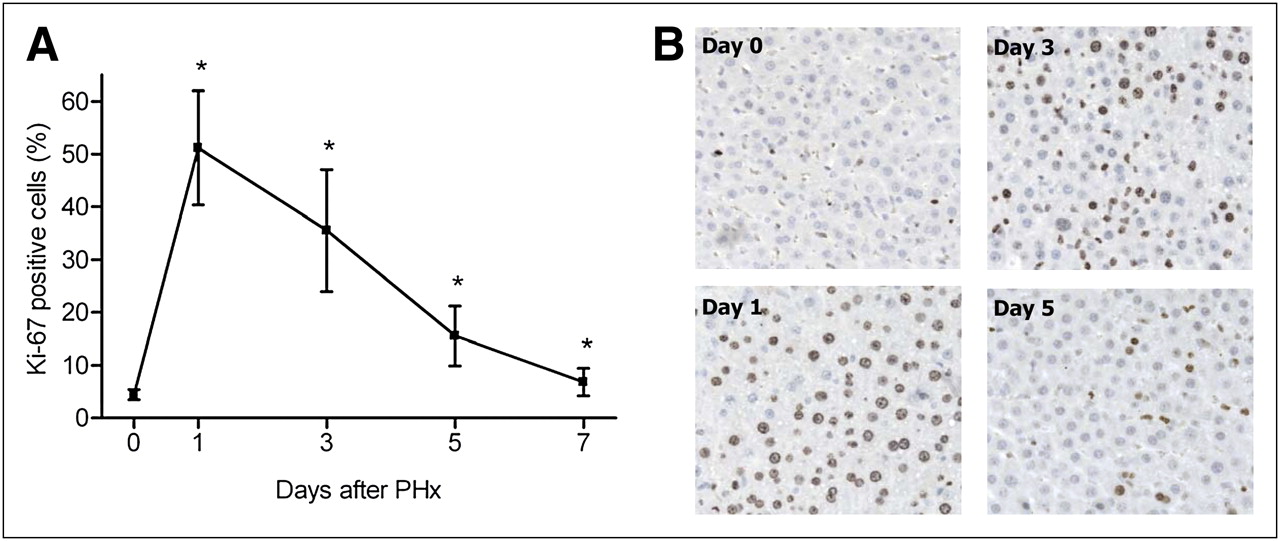
Data from the 2 protocols were combined for the evaluation of hepatocyte proliferation. The most substantial level of proliferation was observed at 1 d after PHx, which gradually decreased to near-baseline values during the next 6 d of liver regeneration ( Fig. 1A).

Percentage of Ki-67–positive hepatocytes (A), with representative histology (B). Percentage of proliferating hepatocytes significantly increased from 4.4% (baseline value) to 51.2% at 24 h after 70% PHx, after which it decreased on days 3 (35.6%), 5 (15.6%), and 7 (6.8%). Values are expressed as mean ± SD. * = statistically significant difference vs. baseline.
Histology
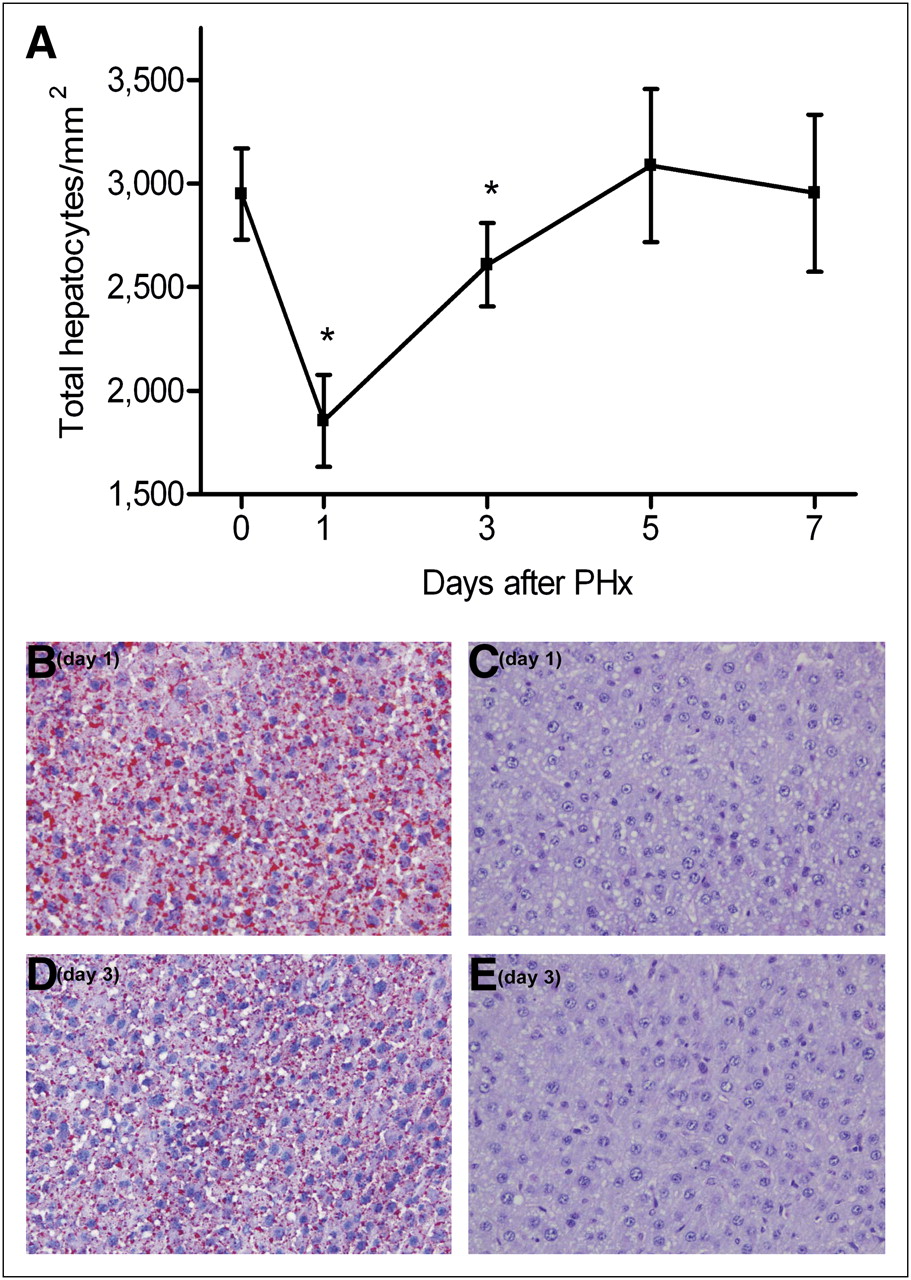
Histologic analysis revealed a reduced amount of hepatocytes per square millimeter of tissue (P < 0.0001) at 1 d after PHx due to hypertrophy of the hepatocytes (diameter, 24.9 ± 0.9 μm vs. 18.3 ± 1.1 μm in the control group, P = 0.009) ( Fig. 2A), suggesting that effectively fewer hepatocytes were present in the remnant liver. Intracytoplasmatic vesicles were observed on day 1 and, to a lesser extent, on day 3 after PHx. Oil red O staining confirmed the presence of fat within the vesicles ( Figs. 2B and 2D), indicating the manifestation of moderate steatosis during the early phase of liver regeneration. Minimal evidence of steatosis was found in the control group or during the late phase of liver regeneration (days 5 and 7). Periodic acid–Schiff staining ruled out the presence of glycogen in the vesicles ( Figs. 2C and 2E).

(A) Histologic evaluation revealed significantly reduced amount of hepatocytes per squared millimeter (P < 0.0001) at 24 h after induction of liver regeneration due to hypertrophy of hepatocytes. In addition, intracytoplasmatic vesicles were seen on day 1 and, to a lesser extent, on day 3 after PHx. (B and D) Oil red O staining confirmed presence of fat within vacuoles (stained red). (C and E) Periodic acid–Schiff staining was negative for glycogen.
Comparison Between CLV and FLV
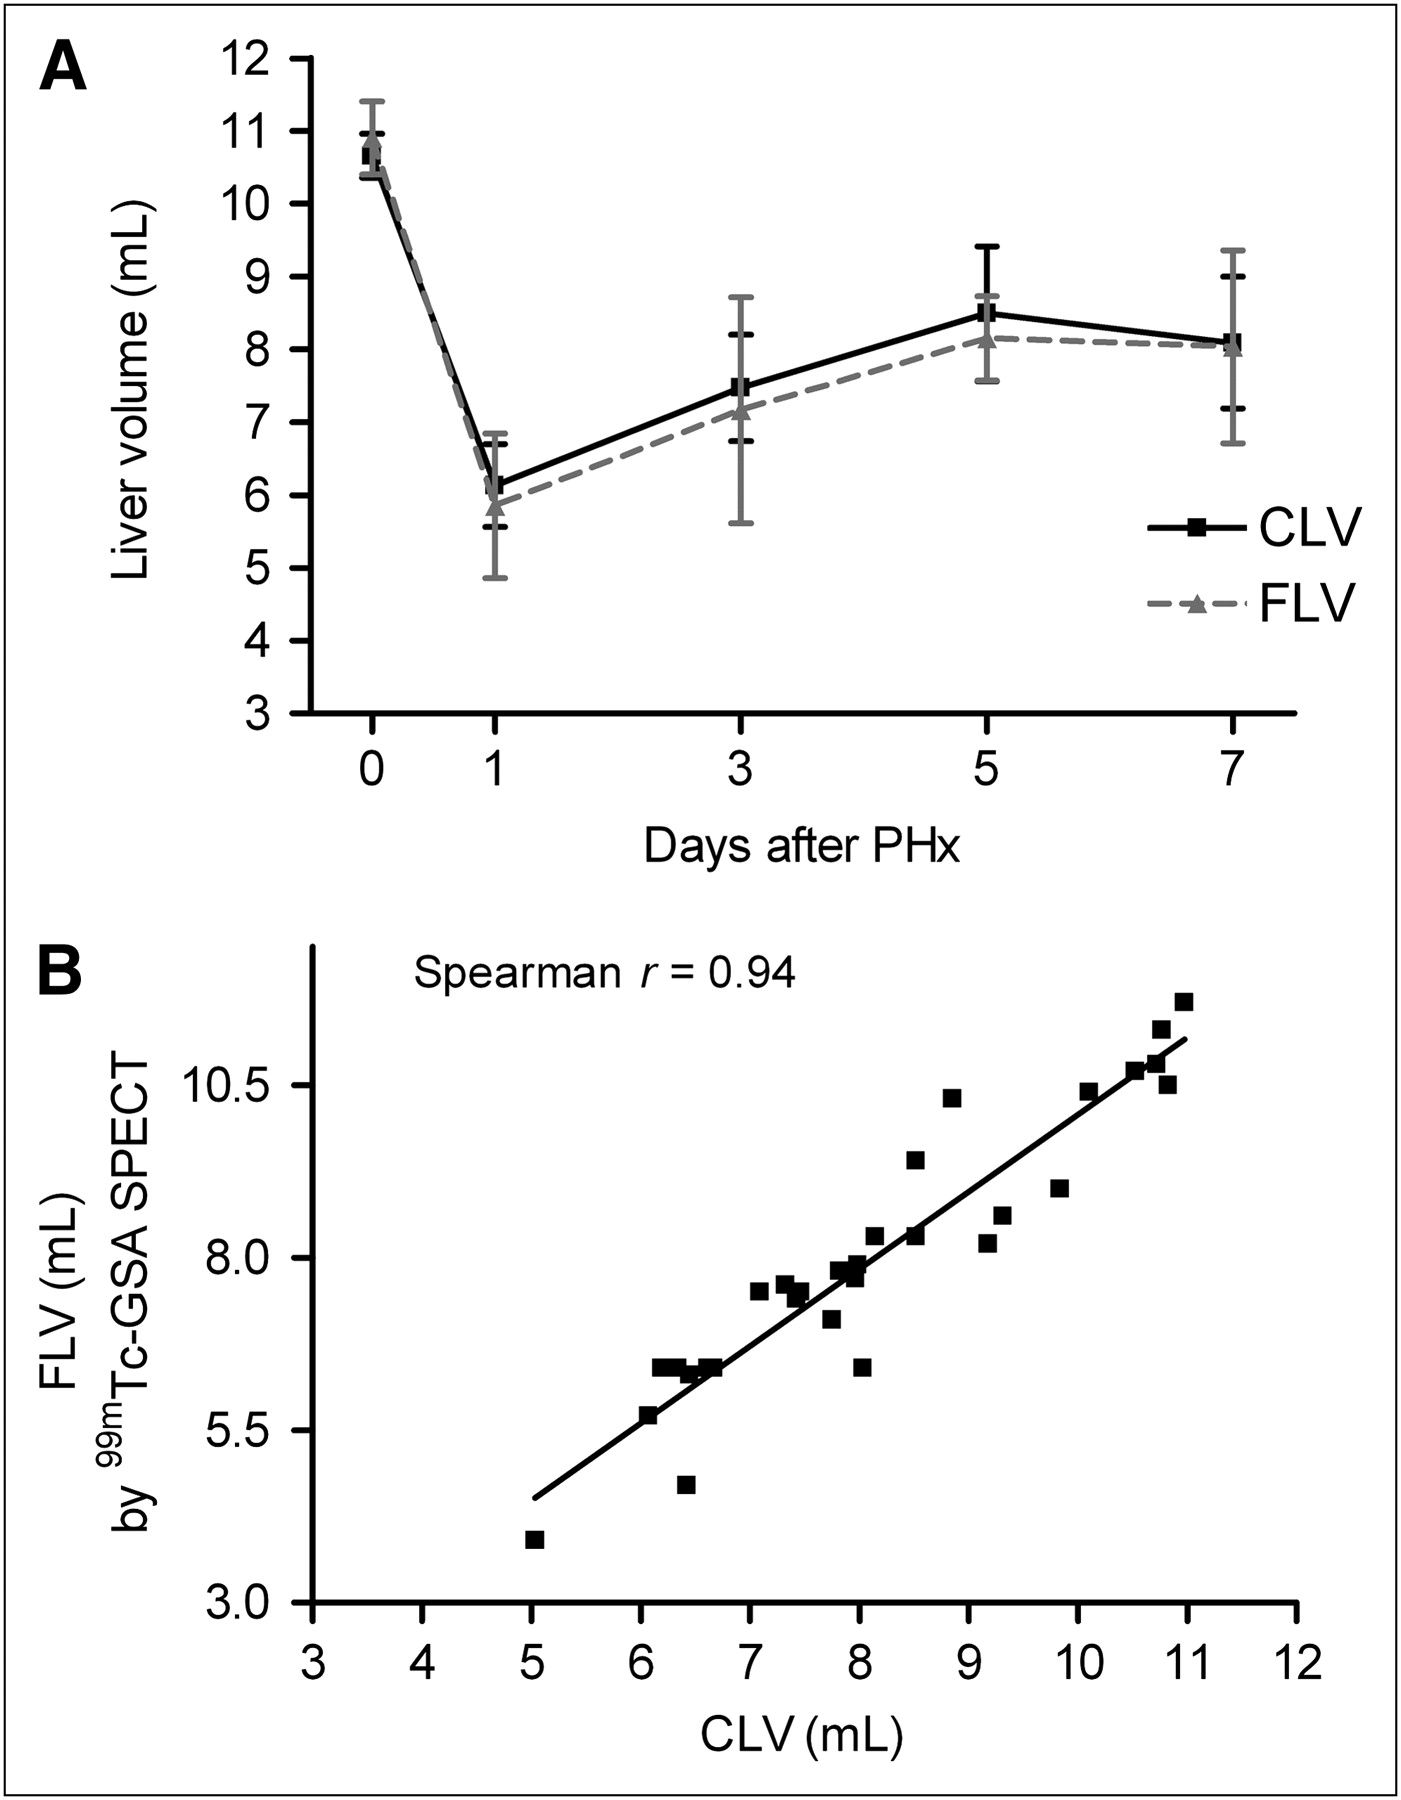
Although the median and left lateral lobes, comprising 69.5% ± 1.6% of the total liver, were resected, remnant CLV had returned to 60.6% ± 6.8% of baseline values 1 d after resection ( Fig. 3A), indicating a doubling of the remnant CLV within the first 24 h. CLV increased to 77% of the baseline volume on days 5 and 7.

(A) No difference was found between CLV and FLV during liver regeneration. (B) CLV and FLV exhibited strong correlation (Spearman r = 0.94, P < 0.0001).
FLV measured by 99mTc-GSA SPECT correlated strongly to CLV at any time point during liver regeneration ( Figs. 3A and 3B), confirming that 99mTc-GSA SPECT is a valuable, noninvasive method to assess hepatic functional volume ( 1).
Comparison Between 99mTc-Mebrofenin HBS, 99mTc-GSA Scintigraphy, and CLV
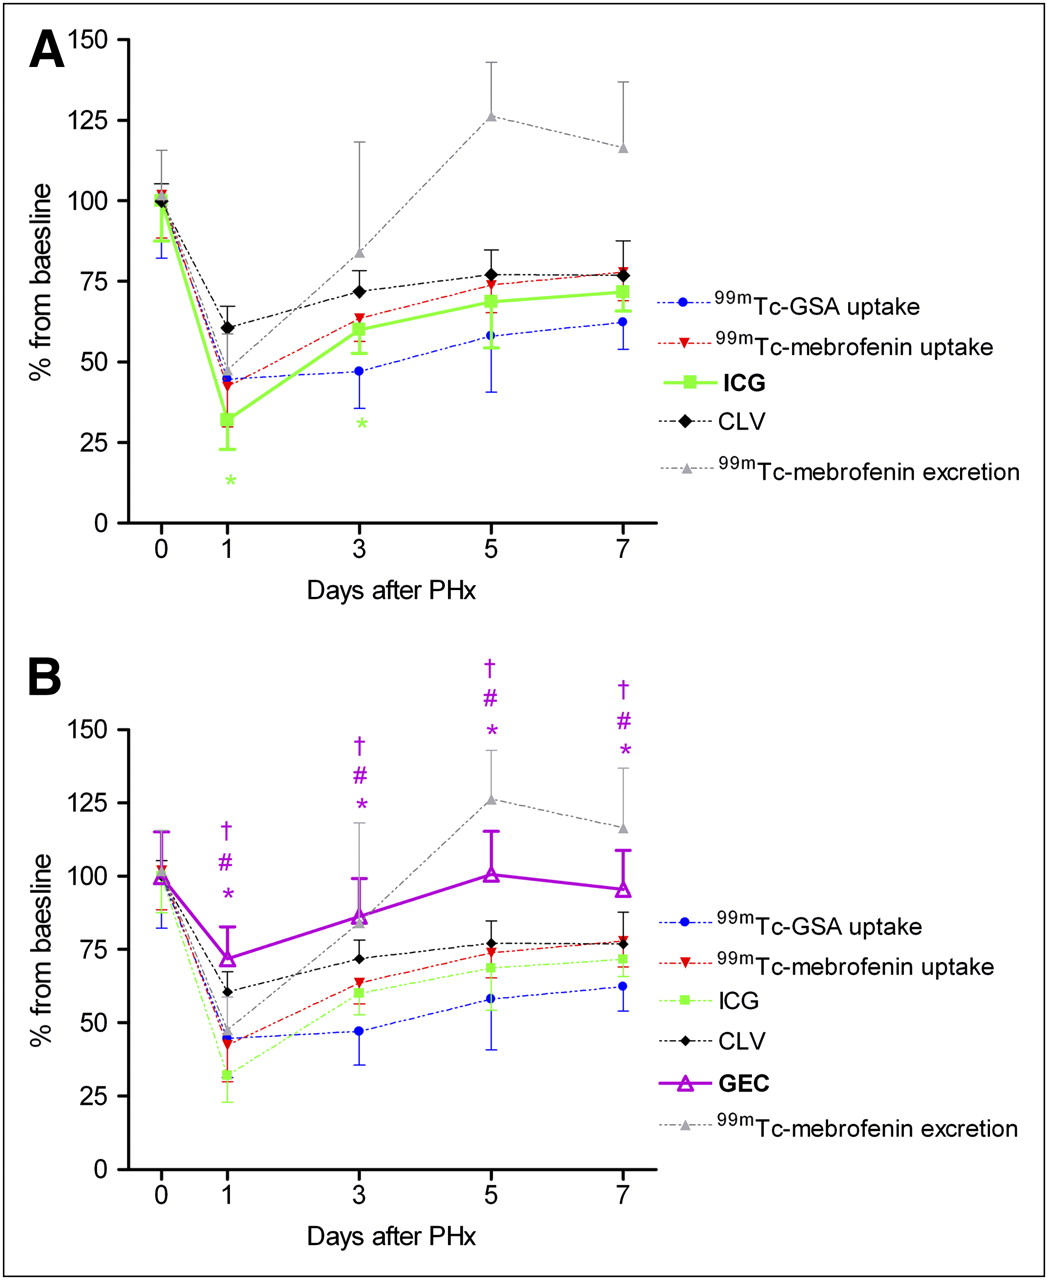
For the comparative analysis, data were expressed as a percentage of baseline values (pre-PHx). One day after 70% PHx, hepatic 99mTc-mebrofenin uptake rate decreased to 44.5% ± 13.0% of baseline, which was less than the CLV ( Fig. 4A). No significant differences were found between 99mTc-mebrofenin uptake rate and CLV on days 3, 5, and 7. Similarly, the 99mTc-mebrofenin excretion rate was more reduced than CLV at 1 d after 70% PHx ( Fig. 4A). Interestingly, the liver excretory function progressed from near-baseline values on day 3 to levels above baseline on days 5 and 7, indicating an excretory overcompensation in the late phase of liver regeneration.

Comparative analysis between nuclear imaging techniques and liver volume. (A) One day after 70% PHx, 99mTc-mebrofenin uptake rate and excretion were reduced to 44.5% ± 13.0% (*) and 50.4% ± 9.5% (#) of baseline, respectively, which was significantly less than CLV. On days 3, 5, and 7, there was no difference between 99mTc-mebrofenin uptake rate and CLV, whereas 99mTc-mebrofenin excretion was significantly enhanced on days 5 and 7 (#). (B) Hepatic 99mTc-GSA uptake rate was significantly more decreased than liver volume at all time points during liver regeneration (*). On days 3, 5, and 7, 99mTc-GSA uptake rate was significantly less than uptake and excretion of 99mTc-mebrofenin (†).
The hepatic 99mTc-GSA uptake rate was significantly more decreased than CLV during the entire 7-d regeneration period ( Fig. 4B). When the 2 nuclear imaging techniques were compared, 99mTc-GSA uptake rate was significantly lower than the uptake and excretion of 99mTc-mebrofenin on all days, with the exception of day 1 after PHx. Taken altogether, these data suggest that CLV overestimates liver function in the early phase of liver regeneration. 99mTc-GSA uptake rate during the late phase of liver regeneration implies a more reduced liver function than reflected by liver volume and 99mTc-mebrofenin HBS.
Comparison Between ICG Clearance Test, GEC, and Nuclear Imaging Techniques
During the early phase of liver regeneration (days 1–3), ICG clearance was significantly lower than CLV, whereas on days 5 and 7 no differences were found ( Fig. 5A). When individual time points were analyzed, no significant differences were found between the ICG clearance and 99mTc-mebrofenin or 99mTc-GSA uptake rates. However, overall during the regeneration process, the curve of the ICG clearance test was significantly different, compared to the 99mTc-mebrofenin uptake rate, with the ICG clearance test suggesting a reduced liver function.

Comparative analysis between quantitative liver function tests and liver volume. (A) Liver function measured by ICG clearance test decreased to 32.1% ± 9.0% of baseline values on day 1 after 70% PHx, after which it recovered to 60% on day 3 ([*] vs. CLV). On days 5 and 7, ICG plasma disappearance rate increased to 69% ± 14% and 72% ± 6% of baseline, respectively, and exhibited no differences vs. CLV. (B) GEC was reduced on day 1 (72% ± 10.9%), after which it recovered to baseline levels. GEC was only minimally affected by 70% PHx and showed significantly different pattern, compared with liver volume (*), 99mTc-GSA uptake rate (#), and 99mTc-mebrofenin uptake rate (†).
The GEC was minimally affected by 70% PHx, showing only a reduction versus baseline on the first day of liver regeneration ( Fig. 5B). Moreover, the GEC exhibited kinetics different from those of CLV as well as different from the 99mTc-GSA and 99mTc-mebrofenin uptake rates.
Analysis of Intrinsic Regulation of Liver Function
The intrinsic regulation of remnant liver function was determined by dividing the quantitative liver function data by the respective liver weight, which indicates whether liver function is up- or downregulated in response to liver regeneration. The corrected values were expressed as a percentage of control ( Table 3). 99mTc-mebrofenin uptake rate per gram of liver was reduced by 31% ± 14% at 1 d after PHx, after which it normalized to baseline levels. Similarly, 99mTc-mebrofenin excretion per gram of liver was significantly decreased on day 1 but significantly augmented on days 5 and 7. 99mTc-GSA uptake rate per gram of liver was significantly decreased on the third and fifth days of regeneration but exhibited no difference from control on days 1 and 7. The ICG clearance per gram of liver was reduced by 44% ± 19% on day 1 after PHx but did not differ from baseline values from the third day onward. The GEC demonstrated an overall increase in galactose elimination per gram of liver, with values reaching 135% ± 19% of baseline at 5 d after PHx.
Results of Liver Function Tests
Mechanistic Explanation for Differential 99mTc-Mebrofenin, ICG, and 99mTc-GSA Uptake
Members of the OATP family are involved in the uptake of 99mTc-mebrofenin ( 17) and possibly ICG ( 10). Cytokines produced during liver regeneration (IL-6 and TNF-α) influence the expression of several OATP isoforms ( 26– 29) and thereby likely affect the uptake of 99mTc-mebrofenin and ICG. There is contradictory evidence regarding the influence of cytokines on the expression of the ASGPR ( 30, 31).
The mRNA expression of rat OATP1a1, OATP1a4, and OATP1b2 was significantly decreased at 1 d after PHx ( Fig. 5A) that gradually recovered to baseline in the subsequent days ( Fig. 6A).
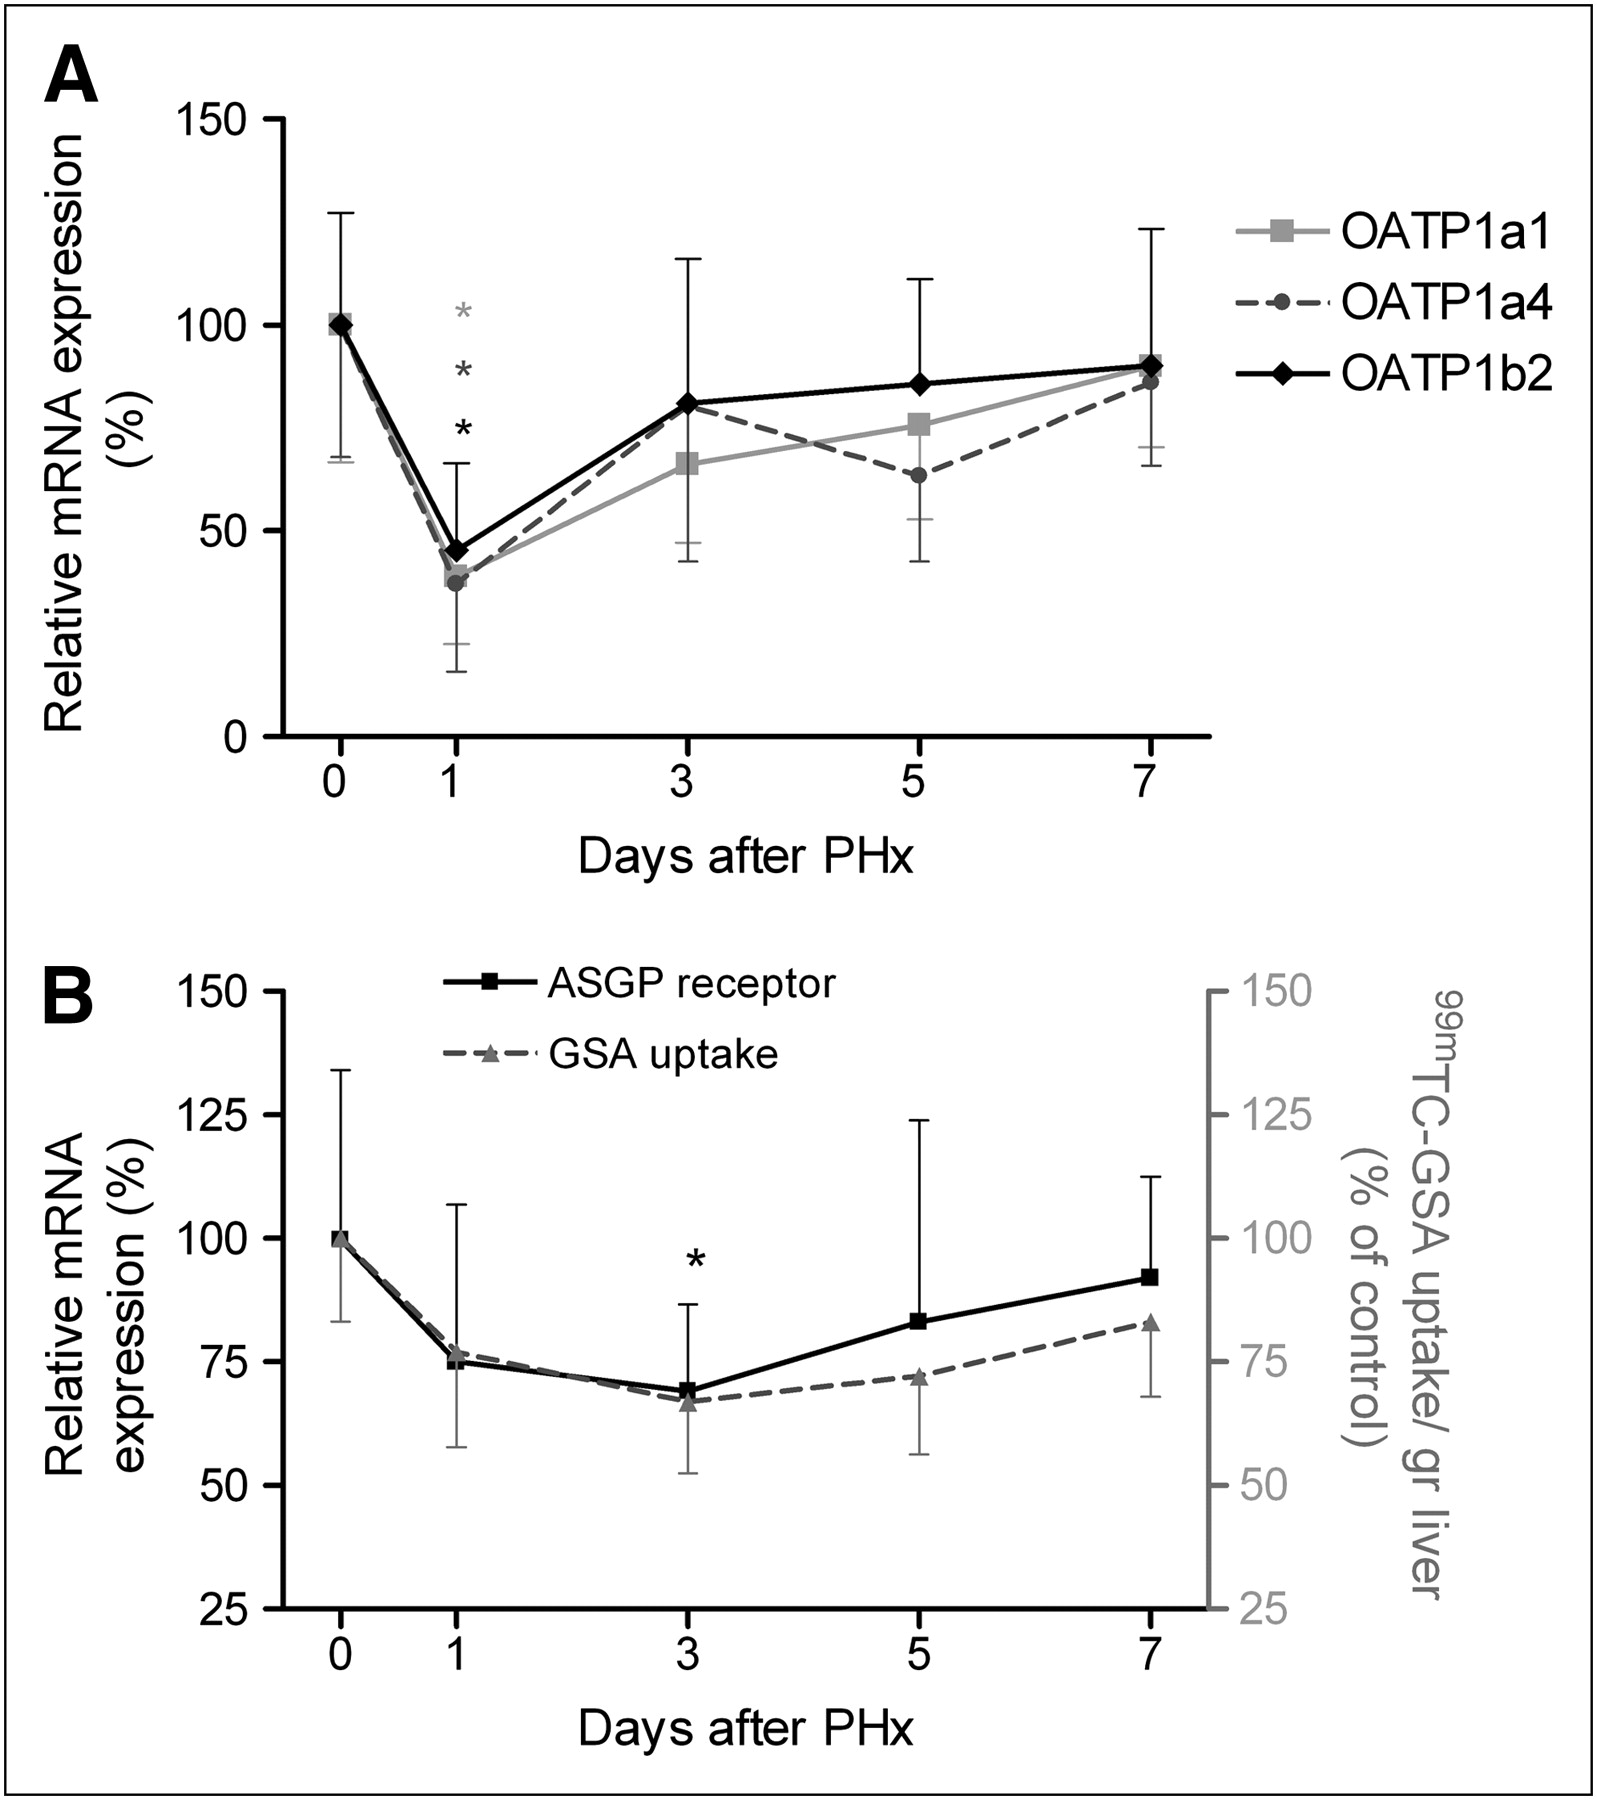
mRNA expression of 3 OATP rat isoforms and ASGPR. (A) mRNA expression of all OATP rat isoforms was significantly decreased at 24 h after 70% PHx (*). Nonparametric repeated-measurement ANOVA indicated that curve of OATP1b2 differed from OATP1a1 (P = 0.044) and OATP1a4 (P = 0.028) during liver regeneration. (B) mRNA expression of ASGPR showed a curve similar to GSA uptake rate per gram of liver, expressed as percentage of baseline. There was significant reduction in ASGPR mRNA expression on day 3 after PHx (*). mRNA levels of the experimental groups are given as percentage of control. Left y-axis represents ASGPR mRNA expression, and right y-axis represents GSA uptake per gram of liver.
During liver regeneration, the mRNA expression profile of OATP1b2 differed from that of OATP1a1 (P = 0.044) and OATP1a4 (P = 0.028). When the different time points were analyzed separately, OATP1a1 mRNA expression differed from OATP1a4 (P = 0.044) and OATP1b2 (P = 0.030) expression on day 3, whereas OATP1a4 mRNA expression differed from OATP1b2 on days 1 (P = 0.030) and 5 (P = 0.005). These results suggest that the mRNA expression of each specific OATP is decreased in an independent manner during liver regeneration.
The mRNA expression of ASGPR exhibited kinetics almost identical to 99mTc-GSA uptake ( Fig. 6B) and showed a significant reduction on day 3 after PHx. A decreased production of ASGPR may have contributed to the reduced 99mTc-GSA uptake rate.
DISCUSSION
In this study, several quantitative liver function tests in addition to conventional parameters of liver regeneration (liver volume and the percentage of proliferating hepatocytes, respectively) were compared. In our 70% PHx model, CLV was restored to roughly 60% of baseline in a 24-h period and reached a plateau on day 5 at approximately 77%, while liver volume is completely restored within this time period in the majority of rodent studies ( 32). Our rats were kept fasting overnight the day before sacrifice to minimize the effect of food ingestion on hepatic blood and bile flow, which can influence the outcome of the different quantitative liver function tests. The overnight fasting might be responsible for the incomplete recovery of liver volume after 7 d of liver regeneration. In addition, histologic examination showed the manifestation of moderate steatosis during the early phases of regeneration. Although the occurrence of steatosis within 24 h after 70% PHx has been described before ( 33), its function and relevance in relation to overnight fasting is unknown.
In both clinical and experimental studies, a discrepancy has arisen between volumetric and functional regeneration, from which 2 contradictory theories have emerged. The first theory suggests that hepatocyte proliferation is promoted at the expense of liver function ( 34). This is supported by Tanaka et al. ( 35), who found that functional regeneration measured by 99mTc-GSA scintigraphy was impaired, compared with the volumetric regeneration in patients who had undergone extensive liver resection. The second theory postulates that hepatocellular function is enhanced after major PHx to compensate for reduced liver mass ( 36– 38). In our study, functional recovery, compared with the volumetric recovery, was impaired on the first day after 70% PHx, as evidenced by the relatively lower liver function measured by all quantitative liver function tests except GEC. The impaired functional recovery during the early phase of regeneration may be partially explained by an increased hepatocyte size, which has a greater impact on liver volume than on liver function, although fewer hepatocytes are effectively present within the remnant liver volume to contribute to function. In addition, a significant reduction in mRNA levels of 3 rat OATP isoforms was observed 24 h after 70% PHx, which may further explain the decreased uptake rate of 99mTc-mebrofenin and ICG. mRNA levels of ASGPR had decreased to 75% of baseline levels, albeit the reduction was not significant on day 1 after PHx. Although mRNA analysis suggests a decrease in the synthesis of OATPs and ASGPR, the genetic profiles do not necessarily reflect coincident fluctuations in transport activity and the actual amount of transporters or receptors per hepatocyte. These parameters need to be elucidated more elaborately using proteomic approaches, which fell outside the scope of the present study.
During the late phase of liver regeneration, the uptake rate of ICG and 99mTc-mebrofenin recovered to levels comparable to CVL, whereas 99mTc-GSA uptake rate alludes to a suboptimal performance of this quantitative liver function test in relation to HBS and ICG clearance. These findings agree with previously published data ( 1). ASGPR mRNA expression was significantly reduced on day 3. In addition to a decreased DNA transcription, mature ASGPRs detach from the cell membrane in proliferating hepatocytes, which, together with the decreased production of ASGPRs, can cause a decrease in the net amount of ASGPRs present on the cell membrane and hence an impaired uptake rate of 99mTc-GSA.
The non–weight-corrected GEC exhibited only a slight decrease at 1 d after PHx but was almost completely restored to baseline values on day 3. Interestingly, the weight-corrected data insinuate compensatory mechanism for the volumetric reduction, as indicated by a substantially increased elimination per gram of liver at 5 d after 70% PHx. This phenomenon may be related to the metabolic roles of galactose, which is an essential component of membrane glycoproteins and glycolipids. During liver regeneration, an augmented galactose demand becomes prevalent because of increased membrane synthesis. In addition, galactose can be converted into glucose, which in turn can be used as an energy source, particularly in fasted rats. Together, these factors may contribute to the augmented galactose elimination per gram of liver during liver regeneration, providing false-positive results with respect to liver function.
In the final analysis, the liver encompasses multiple functions and each quantitative liver function test measures a distinct component of the broader liver function spectrum, which in turn may be differentially influenced during the regenerative process. Consequently, liver function may be reduced or augmented depending on the liver function test used and the time interval at which the test is performed. In general, however, functional regeneration, compared with volumetric regeneration, seems to be impaired in the early phase of regeneration. Volumetric assessment of the liver should therefore be complemented by liver function–specific assays. Hepatic 99mTc-GSA uptake rate underestimates hepatic regeneration in comparison to CLV and 99mTc-mebrofenin uptake rate in the late phase of liver regeneration. The GEC seems to be of less value because it is only minimally affected by 70% PHx and is influenced by factors not related to liver function. 99mTc-mebrofenin HBS has the advantage of providing both visual and quantitative information and allows the measurement of both the uptake and excretory function, which is especially relevant in the clinical setting to detect regions with impaired liver function or biliary complications. 99mTc-mebrofenin HBS is therefore deemed the most suitable liver function test ( 40).
CONCLUSION
In a rat model of 70% PHx, functional regeneration is impaired compared to volumetric regeneration in the early phase of liver regeneration. Hepatic 99mTc-GSA uptake rate, as a liver function test, underestimates hepatic regeneration in comparison to CLV and 99mTc-mebrofenin uptake rate in the late phase of liver regeneration. In later stages of liver regeneration, 99mTc-GSA uptake underestimates hepatic regeneration in comparison to liver volume and 99mTc-mebrofenin uptake. GEC is of less value because it is only minimally affected by 70% PHx and is influenced by factors not related to liver function.
- © 2011 by Society of Nuclear Medicine
REFERENCES
- Received for publication April 21, 2010.
- Accepted for publication June 25, 2010.


Jump to section
Related Articles
Cited By...
- No citing articles found.