


Abstract
In this study, we validated the use of 99mTc-hexamethylpropyleneamine oxime (99mTc-HMPAO) micro-SPECT combined with micro-CT for semiquantification of the infarct size after an experimental stroke in rats and compared our observations with those obtained from histology. This imaging strategy was applied to measure the longitudinal effect of mild hypothermia on the progression of brain damage after stroke in rats. Methods: The endothelin-1 model was used to elicit a transient focal cerebral ischemia in rats. This resulted in a reproducible insult in which the core is represented by the striatum and the penumbra by the cortex. Micro-SPECT and micro-CT images were taken at 1, 3, and 7 d after infusion of endothelin-1 and compared with those taken before the insult. After the last acquisition, rats were sacrificed and the infarct volume was determined via Nissl staining. The results obtained with micro-SPECT and micro-CT were compared with histology at the same time points. Mild hypothermia (33°C) was induced for 2 h, starting 20 min after the insult. Results: Brain damage was estimated using micro-SPECT and micro-CT and was reproducible with minimal interobserver variability. Normothermic stroke rats had reduced 99mTc-HMPAO uptake at 1 and 3 d after the insult, whereas hypothermia improved damage after stroke. These findings corroborate with histology at the same time points. At 1 wk after the insult, no reduction of radioactive uptake was observed in any treatment group. Conclusion: Micro-SPECT and micro-CT allow quick and reproducible semiquantification of brain damage as an interesting alternative to histology to measure the extent of infarcted tissue in small animals after stroke.
Stroke is an important cause of death in industrialized countries, and few therapeutic strategies for stroke exist thus far (1,2). In the endothelin-1 (Et-1) model, a potent vasoconstrictor is infused adjacent to the middle cerebral artery to elicit an occlusion of approximately 30 min before gradual reperfusion takes place (3). A reproducible infarct can be obtained in which the core is represented by the striatum and the penumbra by the surrounding cortex (4). The Et-1 model mimics the most common form of stroke, which is a transient focal cerebral ischemia (2). Infarct volume measurement is an important parameter for assessing the effectiveness of neuroprotective therapies. Unfortunately, histologic measurement of the infarct volume coincides with the sacrifice of many animals. Noninvasive imaging techniques could significantly reduce the number of animals, attenuate intersubject variability, and allow longitudinal studies in the same animal (5). This study concentrated on micro-SPECT combined with micro-CT, using 99mTc-hexamethylpropyleneamine oxime (99mTc-HMPAO) as the radioactive tracer, to noninvasively visualize infarcted tissue after stroke in small animals. Until now, micro-SPECT images have provided more qualitative rather than quantitative information on brain damage after cerebral ischemia (6,7). Therefore, we developed a method to estimate the infarcted area with micro-SPECT and micro-CT and compared our data with those obtained using histologic assessment after transient focal cerebral ischemia in rats. Mild hypothermia is a robust neuroprotective agent (8). Previous histologic findings in our laboratory indicated that hypothermia reduces the infarct volume by half, a day after the administration of Et-1 (4). Here, we monitored the same rat up to 1 wk after an Et-1–induced insult using micro-SPECT and micro-CT to gather information on the long-term effects of a hypothermic treatment (9–11).
MATERIALS AND METHODS
The experiments were performed according to the National Guidelines on Animal Experimentation and approved by the Ethical Committee for Animal Experimentation of the Faculty of Medicine and Pharmacy of the Vrije Universiteit Brussel.
Protocol of Et-1 Experimental Model
Male albino Wistar rats (Charles River Laboratories) weighing between 270 and 300 g were anesthetized with a mixture of ketamine and diazepam (respectively, 75 and 4 mg/kg intraperitoneally) to undergo minor surgery for implantation of 2 intracerebral guides (12). One was positioned in the pyriform cortex, close to the middle cerebral artery (coordinates relative to bregma: +0.9 mm anteroposterior, +5.0 mm lateral, and +5.8 mm ventral from the dura mater) and one in the contralateral prefrontal cortex (+3.2 mm anteroposterior, −3.0 mm lateral, and +2.3 mm ventral from the dura mater). Immediately after surgery, the rats received a 4 mg/kg dose of ketoprofen intraperitoneally. The next day, the insult was induced in sevoflurane (Sevorane; Abbott)-anesthetized rats. The first guide was replaced by a probe (CMA Microdialysis AB) by which 500 pmol of Et-1 (Sigma), dissolved in Ringer solution, was infused at a rate of 1 μL/min during 6 min. The result was a focal reproducible insult in the ipsilateral hemisphere (4,13). The second guide was substituted by a thermoprobe (HYP-O-SLE; Omega Corp.) to measure the brain temperature throughout the experiment in the contralateral hemisphere (4). Inducing the insult under anesthesia was necessary to avoid shivering in rats that underwent the hypothermic treatment protocol. These animals were subjected to 2 h of reduced brain temperature (33.0°C ± 0.5°C), started 20 min after Et-1 infusion. In 10 min, brain temperature was reduced by surface cooling. After the treatment, the animals were gradually rewarmed during 30 min. Subsequently, the rats were kept at 37°C for another 30 min before anesthesia was stopped and they were allowed to awaken. All rats received the same amount of anesthesia.
Experimental Setup
Four experimental groups (Fig. 1) can be distinguished. Control rats were not subjected to any treatment. Sham rats underwent surgery and infusion of Et-1 vehicle only. Normothermic rats were treated with Et-1 but did not undergo hypothermia. In both groups, brain temperature was kept constant at 37.0°C ± 0.5°C during all experimental procedures. Hypothermic rats received Et-1 and were subjected to the hypothermic protocol. Rats were randomly assigned into each group. Groups meant for histology were sacrificed at 1, 3, or 7 d after the infusion of Et-1. The rats subjected to micro-SPECT and micro-CT were scanned at baseline (5 d before Et-1 infusion) and at 1, 3, or 7 d after Et-1 injection. After the last acquisition, the rats were sacrificed and the infarct volume was determined using histologic examination. In total, 25 rats were used for the micro-SPECT and micro-CT and 59 animals were needed for histology.
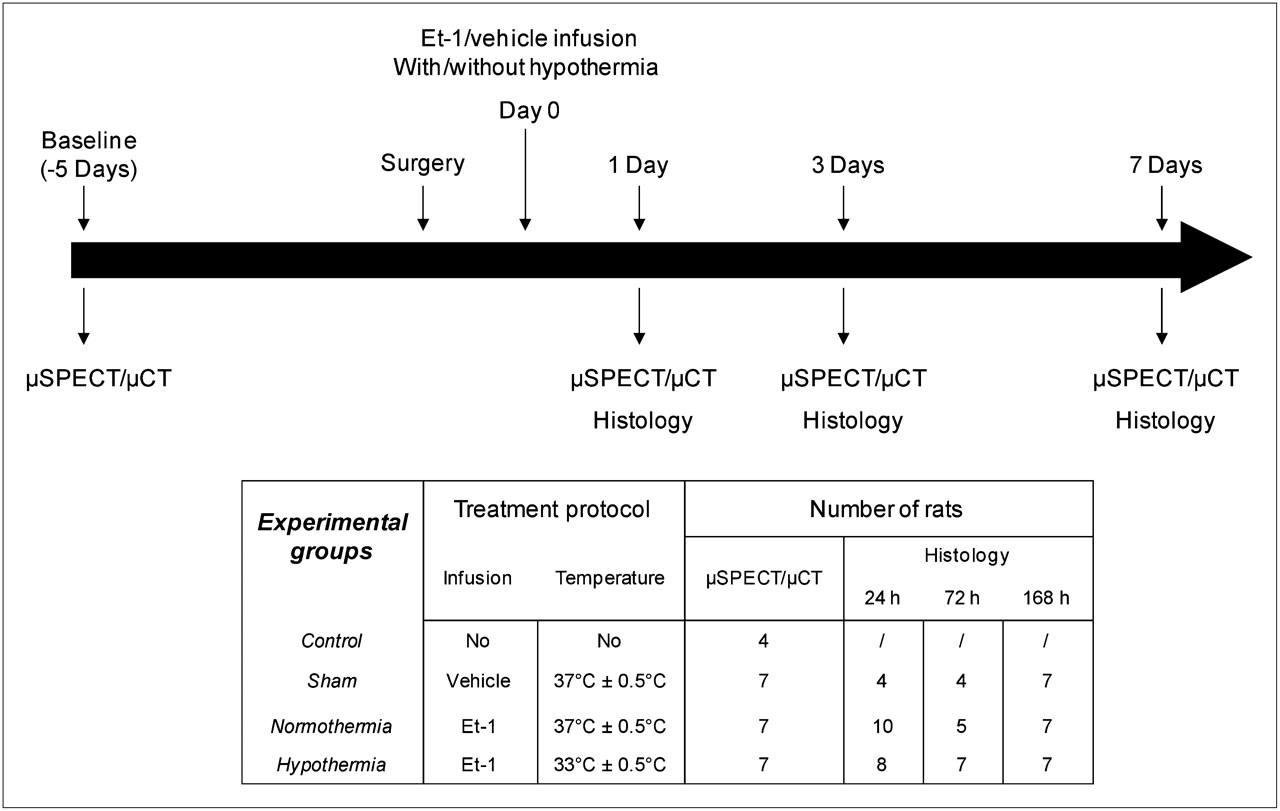
Schematic representation of experimental protocol. Four experimental groups (control, sham, normothermia, and hypothermia) were always compared with each other at 5 d before and 1, 3, and 7 d after Et-1 administration. Rats in histology groups were sacrificed at each time point, whereas those in micro-SPECT and micro-CT group were sacrificed after 1 wk.
Micro-SPECT and Micro-CT Acquisition and Data Analysis
To optimize the in vivo imaging alternative to estimate brain damage after stroke, micro-SPECT images had to be combined with micro-CT acquisitions. Using skull reference points on the micro-CT images, all the images of an animal were orientated similarly and compared. Second, because the micro-CT images visualized the skull nicely, delineation of the cortex in each slice was made easier. Third, situating the thermoprobe and the Et-1 probe (distinguished by micro-CT) precisely in the micro-SPECT images was essential to allow semiquantification (14).
Twenty minutes before the micro-SPECT and micro-CT acquisition, 446.22 ± 95.46 MBq (mean ± SD, n = 100 acquisitions) of 99mTc-HMPAO (stabilized Ceretec; GE Healthcare) in a volume of 0.5 mL were injected intravenously via the lateral tail vein into conscious animals. After 15 min, the rats were anesthetized by an intraperitoneal injection of pentobarbital (50 mg/kg). They were placed supine on a bed with their head firmly fixed between 2 circular disks containing three 3.7-MBq 57Co point sources (Canberra). This bed can be interchanged between the micro-CT and micro-SPECT scanners. The 6 beads provided reference points in both image modalities and were used as fiducial markers to generate a spatial transformation matrix (15). First, micro-CT images were acquired using a model 1178 high-throughput in vivo system (SkyScan). X-ray projection images were acquired into an 85 × 85 matrix at 50 kV and 615 μA. By means of 2 x-ray detector–source pairs, 96 projections were acquired over 180°, with a total acquisition time of 2 min. The micro-CT images were reconstructed using the software provided by the scanner manufacturer (15). The micro-SPECT images were acquired using a dual-head γ-camera (e.cam180; Siemens Medical Solutions) equipped with a 1-mm pinhole collimator (focal length, 250 mm; 257-mm radius of rotation) (Nuclear Fields). Sixty-four projections, each 40 s, were acquired over 360° of rotation into a 128 × 128 matrix with a zoom factor of 1. The total imaging time (micro-CT and micro-SPECT) was approximately 45 min. The images were reconstructed using a modified version of the ordered-subsets expectation maximization algorithm, previously described by Vanhove et al. (16,17). Corrections were made for attenuation and scatter (15,17,18).
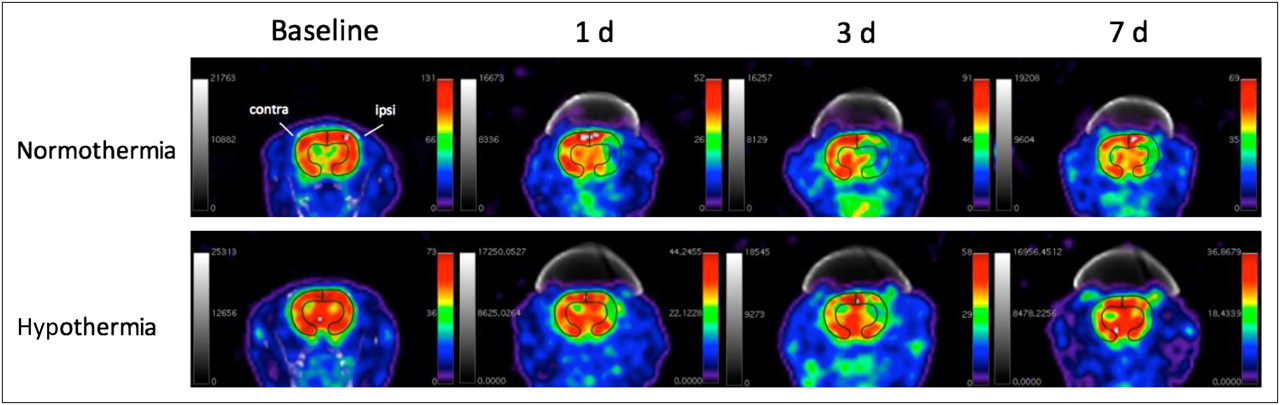
In the Et-1 model, the penumbra is represented by the cortex and histology has proven that hypothermia mostly salvages the penumbra (4). Using OsiriX imaging software, a region of interest (ROI) of the cortex was delineated in the ipsi- and contralateral hemispheres on the baseline images in 6 consecutive slices with a thickness of 600 μm, starting from the position of the thermoprobe as visualized on micro-CT. These ROIs were transposed to the acquisitions of the same animal at 1, 3, and 7 d after the insult. The mean radioactive intensity was calculated in these ROIs. Finally, the ratio between the values of the contra- and ipsilateral hemispheres was calculated to allow comparison. The analysis of the micro-SPECT and micro-CT images is illustrated in Figure 2. To determine the reproducibility of the assay, the interobserver variability was assessed: 2 independent observers, without knowledge of the nature of the prior treatment, analyzed the fused micro-SPECT and micro-CT image sets.

Analysis of micro-SPECT and micro-CT images. Micro-SPECT acquisitions were color-coded with National Institutes of Health spectrum color scale that assigns white to maximum pixel value in image. For visual presentation, images were scaled to obtain maximum pixel value in cortex. Cortex was delineated on baseline images of each rat and was then transposed onto images at 1, 3, and 7 d after administration of Et-1. Contra = contralateral; ipsi = ipsilateral.
Histologic Assessment of Infarct Size
At 1, 3, or 7 d after the administration of Et-1, the rats were sacrificed with 6% sodium pentobarbital and transcardially perfused with saline followed by freshly prepared buffered 4% paraformaldehyde (Sigma). The brains were dissected out and then fixed in the same buffer. Fifty-micrometer-thick slices were cut and preserved on phosphate-buffered saline (0.01 M) with sodium azide (0.1%) as a preservative. To quantify the infarct volume, Nissl staining was performed on these slices, when mounted onto gelatin-coated glass slides. Pictures of the slices at a magnification of 1.25 were transferred to a computer and scaled. Every 600 μm for 6 consecutive slices after the thermoprobe; the insult area in the cortex was delineated and calculated using Image J (version 1.37; National Institutes of Health).
Statistical Analysis
All data are expressed as mean ± SD. Data analysis was performed using the statistical program InStat (GraphPad Software; version 3.06 for Windows XP [Microsoft]). For statistical testing of differences as a function of time with micro-SPECT and micro-CT, repeated-measures ANOVA was used with the Dunnett post hoc test compared with baseline levels (−5 d). For histology, 1-way ANOVA with the Dunnett post hoc test compared the infarct volume 1 d after the induction of the insult with 3 and 7 d. At each time point, 1-way ANOVA was used with the Dunnett post hoc test to compare control, sham, and hypothermic rats with the normothermic ones. The level for significance was 0.05.
RESULTS
Quantification of Damaged Brain Tissue with Micro-SPECT and Micro-CT Is Reproducible
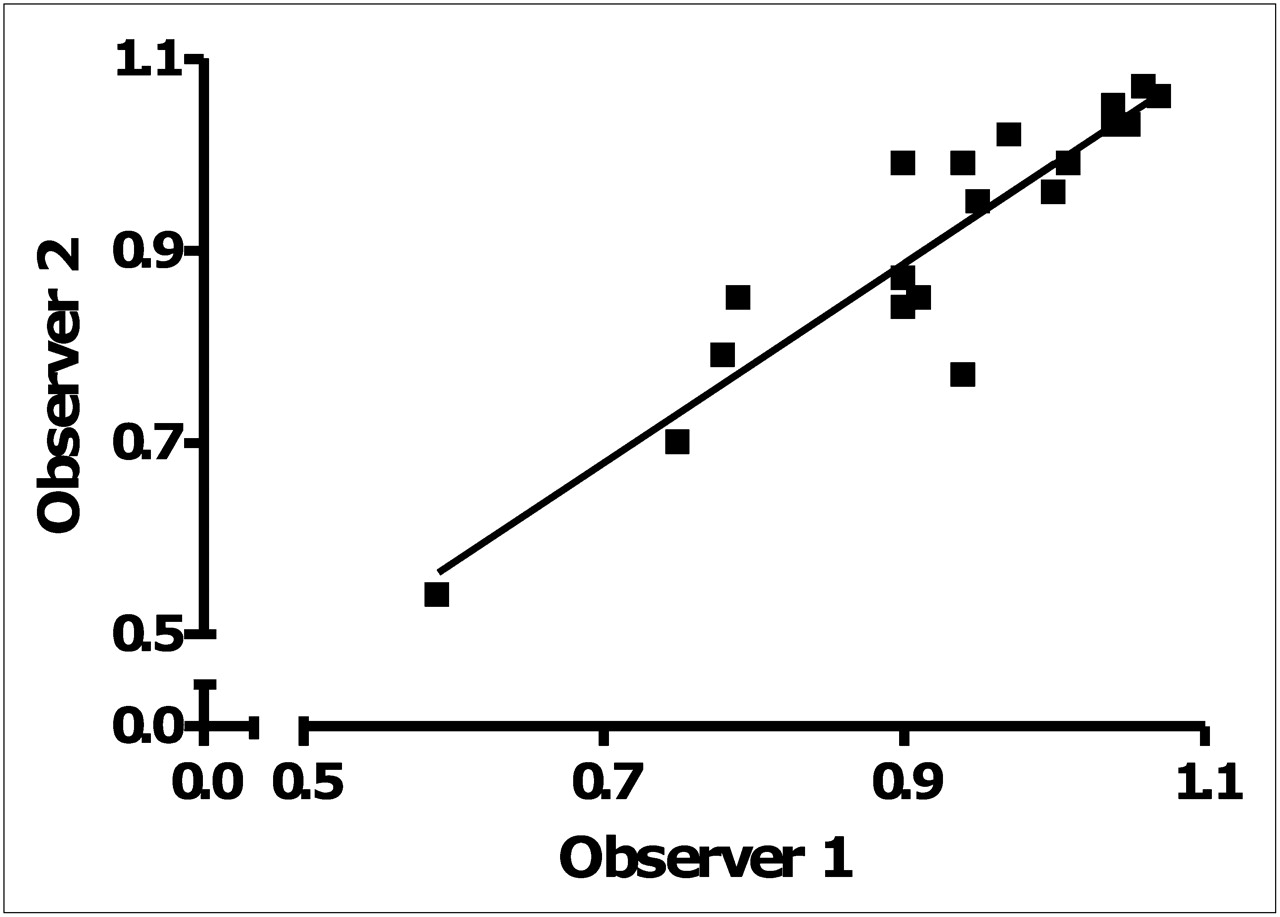
Because reproducible quantification of the infarcted area using micro-SPECT and micro-CT was an important aim of this study, the acquired images were handled by 2 independent observers who did not know the treatment protocol, in order to assess interobserver variability. The mean difference (±SD) on the ratios of the cortex between the observers was 0.012 ± 0.055, with an associated 95% confidence interval of −0.000 to 0.024 (Student t test) (19). When the interobserver reproducibility of the normothermic rat data was compared, the equation of the graph was y = 1.039x – 0.049 with a high linear correlation: R2 = 0.845 (Fig. 3). The absolute quantification difference ranged from 0.000 to 0.173 between the 2 observers, and the maximal variation on baseline levels was calculated to be 8.3%.

Graphic representation of variability between observers 1 and 2 of data obtained of normothermic animals at 5 d before and 1, 3, and 7 d after Et-1 administration. Linear regression analysis resulted in equation y = 1.039x – 0.049 and R2 of 0.845.
Hypothermia Reduces Brain Damage, 1 Day After Et-1–Induced Stroke, as Shown by Semiquantification with Micro-SPECT and Micro-CT
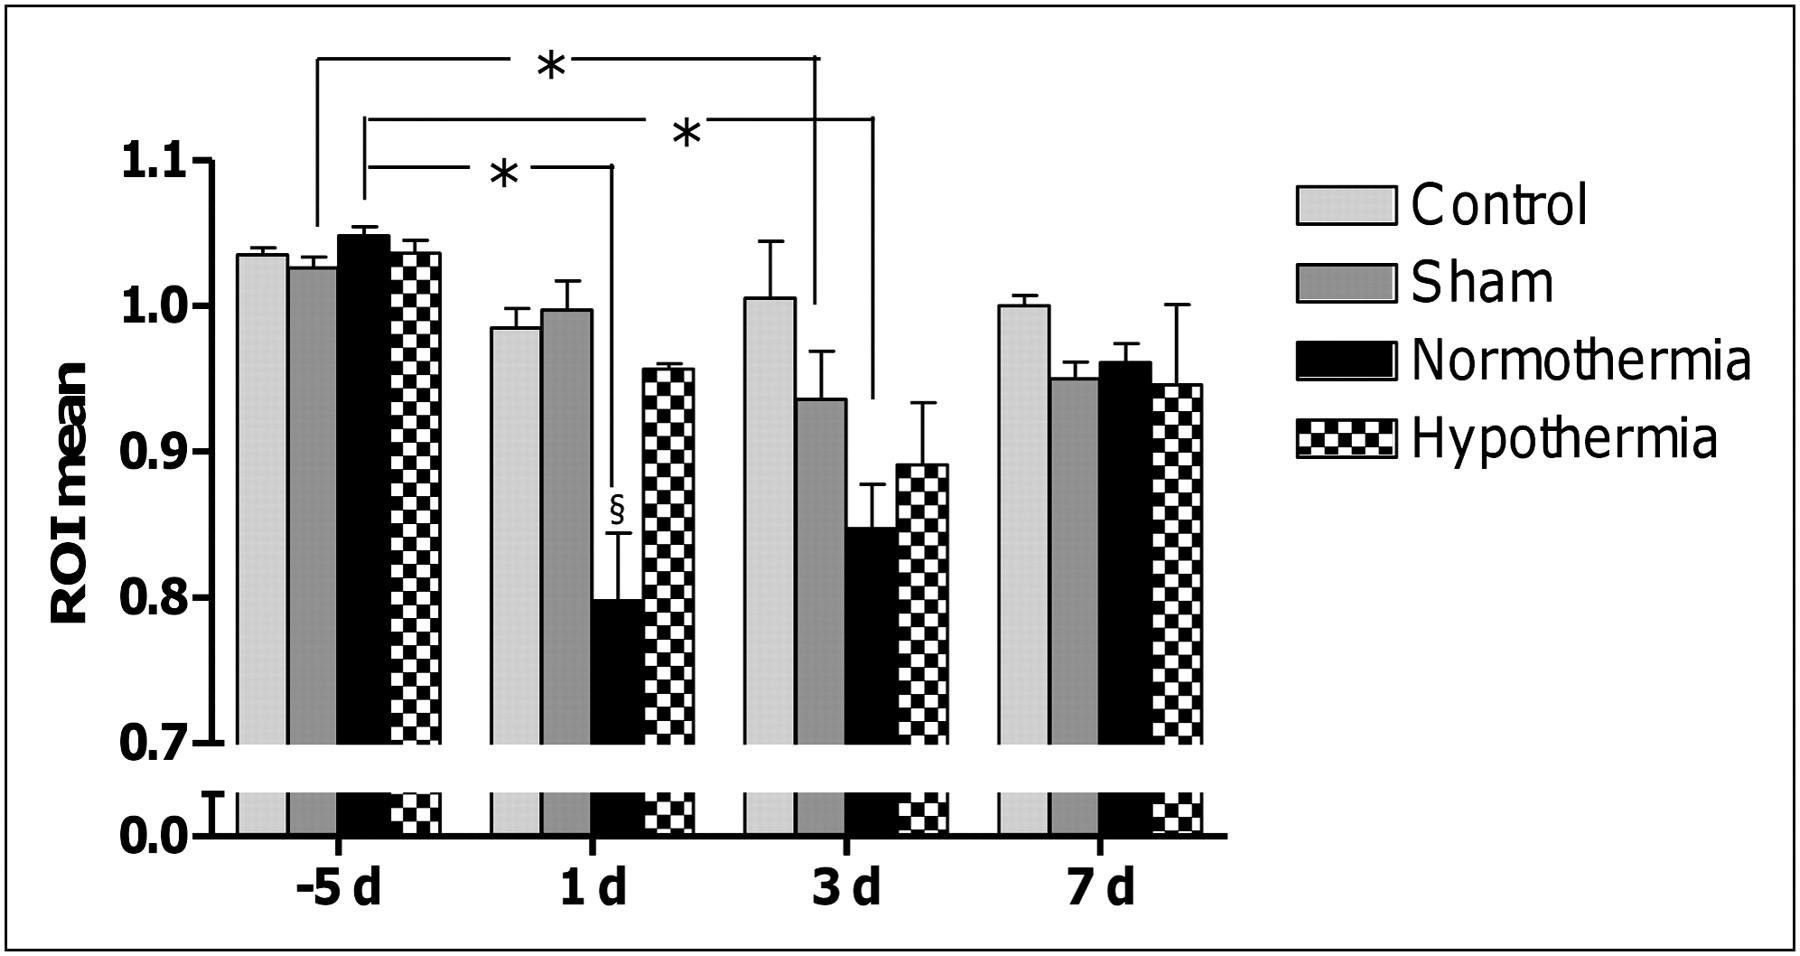
The serial semiquantification of brain damage in the cortex for the different experimental groups is shown in Figure 4. At baseline, the ratio between ipsi- and contralateral cortex was approximately 1 (1.037 ± 0.020, n = 25) in all experimental groups, indicating that there was no difference in 99mTc-HMPAO uptake between the 2 sides. In control rats, the baseline ratio of approximately 1 remained constant over time. Sham-operated animals showed a significantly (P = 0.03) reduced ratio only at 3 d (0.936 ± 0.087, n = 7) after the administration of the Et-1 vehicle, compared with baseline (1.026 ± 0.019, n = 7). Normothermic animals showed a reduced ratio of 99mTc-HMPAO uptake at 1 and 3 d (0.797 ± 0.123 and 0.847 ± 0.081 [n = 7], respectively) after the Et-1–induced insult, compared with baseline values: 1.048 ± 0.016, n = 7. However, at 1 wk after the Et-1 infusion, radioactivity uptake in the ipsilateral hemisphere normalized as in all the other groups (0.961 ± 0.035, n = 7). At 1 d after the induction of the insult, the ratio between the ipsi- and contralateral sides in hypothermic rats was significantly larger than that in normothermic animals: 0.960 ± 0.009 (n = 7) versus 0.797 ± 0.123 (n = 7), respectively. In fact, at this time point, uptake of 99mTc-HMPAO in hypothermic animals was not significantly different from that in control or sham rats. Only at 3 d could a trend to some reduction in radioactivity be observed (0.891 ± 0.113, n = 7, P = 0.06), but at 1 wk after the insult, levels returned to basal values (0.946 ± 0.145, n = 7).

Graphic presentation of results obtained using micro-SPECT and micro-CT showing effect of mild hypothermic treatment after transient focal cerebral ischemia up to 1 wk after insult for control (n = 4), sham (n = 7), normothermic (n = 7), and hypothermic groups (n = 7). Graph represents mean data of 2 independent observers that quantified mean radioactive signal of ROIs of micro-SPECT and micro-CT images. Data show significantly less radioactivity at ipsilateral side in normothermic group at 1 and 3 d after administration of Et-1. Results confirm that hypothermia can reduce brain damage at 1 d after insult. *Repeated-measures ANOVA with Dunnett post hoc test compared with baseline (−5 d). §One-way ANOVA with Dunnett post hoc test when comparing control, sham, and hypothermic groups with normothermic group.
Semiquantification was limited to the cortex, as the smaller degree of perfusion in the striatum hampered accurate assessment of brain damage in this brain structure. Indeed, when the ROI mean of the striatum under control conditions (−5 d) and 24 h after the administration of Et-1 under normothermic conditions was calculated, no significant difference in radioactivity uptake was observed between these 2 acquisitions (paired t test, P = 0.114). The graph is included as supplemental material (supplemental materials are available online only at http://jnm.snmjournals.org).
Hypothermia Reduces Brain Damage by Half, 1 Day After Infusion of Et-1, as Observed by Histology
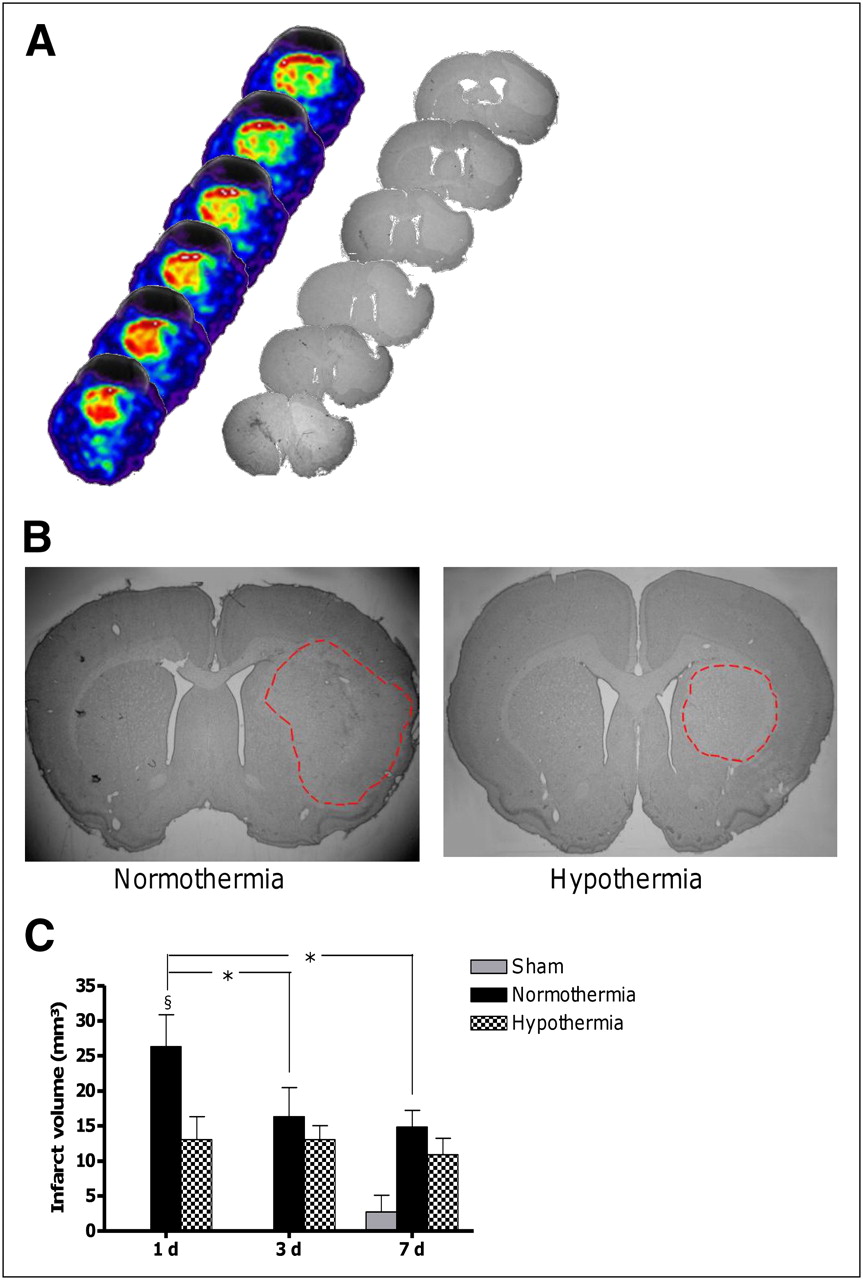
The infarct volume in the cortex was quantified after the thermoprobe was implanted. No insult was observed before the probe was implanted. Calculating the infarct volume at different times after the infusion of Et-1 with histology requires sacrificing rats at each indicated time. Control rats showed no infarct volume. Sham rats had no visible dead tissue staining up to 1 wk after the administration of the Et-1 vehicle. Infusing Et-1 induced a reproducible infarct volume that peaked after a day, stretching from the striatum to the larger part of the cortex (Fig. 5A). However, significantly smaller infarct volumes in the cortex were observed at 3 and 7 d after the insult (P < 0.0001). Hypothermia salvaged a great deal of the infarcted tissue a day after the administration of Et-1. The results show that the infarct volume is approximately half that in normothermic rats (normothermic animals: 26.32 ± 4.55 mm3, n = 10; hypothermic rats: 13.06 ± 3.28 mm3, n = 8; unpaired t test, P < 0.0001). Furthermore, hypothermia was able to stabilize the infarct volume at these lower levels at 3 and 7 d after the insult (Fig. 5B).

(A) Serial progression of brain damage visualized by micro-SPECT and micro-CT and histology in normothermic rat. (B) Infarct area in normothermic and hypothermic rat 1 d after administration of Et-1. In normothermic animal, infarct area spreads from striatum to cortex, whereas in hypothermic rat, larger part of cortex (penumbra) could be salvaged. (C) Graph of infarct volume in cortex calculated using histology at 1, 3, and 7 d after administration of Et-1 for sham (n = 4, 4, and 7 at 1, 3, and 7 d, respectively), normothermic (n = 10, 5, and 7 at 1, 3, and 7 d, respectively), and hypothermic (n = 8, 7, and 7 at 1, 3, and 7 d, respectively) treatment. Infarct volume peaks in normothermic animals 1 d after induction of insult. Hypothermia reduces infarct volume by half 1 d after insult. *One-way ANOVA with Dunnett post hoc test compared with 3 and 7 d. §One-way ANOVA with Dunnett post hoc test compared with hypothermia.
DISCUSSION
This study aimed to optimize an in vivo imaging alternative to the well-known histologic assessment of infarct volume in the Et-1 rat model. Semiquantification of brain damage with micro-SPECT and micro-CT met the necessary practical requirements. For instance, there was no problem with metal incompatibility due to the metal probes used to elicit the insult with Et-1. 99mTc-HMPAO was used as a radioactive tracer and was trapped enzymatically in the brain by a glutathione-dependent mechanism (20). The infarcted area cannot trap 99mTc-HMPAO and thus was observed as an area with a lower radioactive signal (21). Calculating the ratio between the ipsi- and contralateral hemispheres is possible because no brain damage, and thus no difference in 99mTc-HMPAO uptake, is induced in the contralateral hemisphere (22,23). The mean difference in interobserver variability and the maximal variation of 8.3% fault on baseline values shows that the method is able to reproduce data with small differences by independent observers.
In this study, it was not possible to correlate the results of the 2 methods, for several reasons. First, only the data at 7 d could be used to show a correlation because only these were obtained by both micro-SPECT and micro-CT and histology. However, these data did not show a large variation, hampering correlation of the data. Second, the data of the micro-SPECT and micro-CT analysis are semiquantitative. Also, the Nissl staining and micro-SPECT and micro-CT images may be less reliable at this time point. Indeed, the damage in the cortex peaked at 1 d after the infusion of Et-1, but gradually, the infarcted area decreased for up to 1 wk after the induction of the insult. The same observations have been made for several experimental ischemic models (24,25). A possible reason for this decrease in measured infarct size might be the infiltration of microglial cells and blood-born macrophages into the damaged tissue. This infiltration may enhance Nissl staining and 99mTc-HMPAO trapping in the infarcted tissue (24,26). Recently, we have observed microglial activation at this late time point in our model.
Hypothermia is a robust neuroprotective strategy known to reduce brain injury after transient focal cerebral ischemia (4,8,27). Both techniques in this study confirmed that hypothermia is able to attenuate brain damage after stroke, at 1 d after the administration of Et-1 (4,27). Further research has shown that the greatest part of the protection is situated in the penumbral region (4). Therefore, calculating the ratio in 99mTc-HMPAO uptake between the ipsi- and contralateral cortices with micro-SPECT and micro-CT in this study could monitor the larger part of the recovery. The longitudinal study showed no significant reduction in infarcted tissue in the cortex with hypothermic treatment at 3 and 7 d after the administration of Et-1, as is consistent with literature findings in other models of middle cerebral artery occlusion (10). However, hypothermia reduced brain damage even further at later time points, confirming mild hypothermia as an interesting neuroprotective strategy to improve outcome after stroke in a clinical setting (28).
Although the same conclusions could be drawn from histology and micro-SPECT and micro-CT, it is important to mention that only half the number of rats was used for the latter technique. Also, variability in data is reduced, because the same animal serves as its own control and can be followed over time (5). Thus, more consideration can be given to the 3 alternatives reduction, refinement, and replacement. This micro-SPECT and micro-CT method allows quick and easy semiquantification as a function of time of damaged tissue after stroke, even if the spatial resolution of the micro-SPECT reaches only 1 mm. With newer models, such as ultra-high-resolution SPECT as proposed by van der Have et al. with a spatial resolution of approximately 0.35–0.45 mm, quantification would be even more sensitive and smaller differences in infarcted area could be monitored and identified (29,30). Furthermore, the systems are continuously improved, and higher spatial resolution is an important target in these optimizations. A more sensitive analysis combined with other tracers could possibly allow the monitoring of brain damage in the striatum or other less perfused brain regions, too. In addition, quantification of damaged tissue in small animals after micro-SPECT and micro-CT offers further possibilities. The effectiveness of diverse neuroprotective strategies could be serially monitored within the same animal, and progression of brain damage semiquantified. Micro-SPECT and micro-CT could even allow the screening of diagnostic drug delivery or molecular processes simultaneously with cerebral blood flow if both tracers can be labeled with a radionuclide that emits photons distinguishable from each other (5,17).
CONCLUSION
This study showed an easy and reproducible manner of quantification of damaged brain tissue after stroke with micro-SPECT and micro-CT, which gave the same observations as did histology. Furthermore, this quantification method was applied in a longitudinal study to investigate the effect of a mild hypothermic treatment as a function of time after an Et-1–induced transient focal cerebral ischemia.
DISCLOSURE STATEMENT
The costs of publication of this article were defrayed in part by the payment of page charges. Therefore, and solely to indicate this fact, this article is hereby marked “advertisement” in accordance with 18 USC section 1734.
Acknowledgments
We thank Cindy Peleman, Gino De Smet, and Ria Berckmans for their technical assistance. Research at ICMI is funded by the InterUniversitaire AttractiePool (IUAP) 6/38. The work at FASC was funded by the Research Fund of the Vrije Universiteit Brussel (OZR-VUB) and by the Instituut voor de Aanmoediging van Innovatie door Wetenschap en Technologie in Vlaanderen (IWT-TBM). Tony Lahoutte is a senior clinical investigator and An-Gaëlle Ceulemans a research fellow of the FWO-Vlaanderen. No other potential conflict of interest relevant to this article was reported.
Footnotes
Published online Nov. 2, 2011.
- © 2011 by Society of Nuclear Medicine
REFERENCES
- Received for publication November 26, 2010.
- Accepted for publication May 24, 2011.


Jump to section
Related Articles
Cited By...
- No citing articles found.