


Abstract
The presence of 124I in tissue near the trachea can cause a phenomenon that might be called shine-through. The effect is due to high-energy positrons that cross the air-filled trachea and annihilate at the opposite tracheal wall, incorrectly suggesting uptake at that location. Methods: We investigated shine-through using 124I, 68Ga, and 18F PET/CT scans of a neck phantom. Additionally, we evaluated 124I studies of 29 patients with differentiated thyroid cancer who underwent imaging for postsurgical staging. Results: In the phantom studies with a 0.1-mL 124I source, the relative intensity of shine-through decreased from 7% to nearly zero when the thickness of the positron-stopping layer was increased from 0.3 to 3.85 mm. In patients, shine-through was observed in 5 of the 29 studies, with intensities between 0.7% and 14%. Conclusion: Shine-through appears rather common in differentiated thyroid cancer. Recognition is important for identification of real lesions, calculation of uptake, and dosimetry.
In the management of patients with differentiated thyroid cancer, 124I PET/CT is becoming an indispensable tool because of its excellent diagnostic sensitivity (1,2) and its use in PET-based dosimetry for planning 131I therapy (3).
Especially with the postsurgical and preablative use of 124I, the high energy and the long range of the positrons can be a pitfall in image evaluation. The thyroid gland shares a common fascia with the trachea. Therefore, postsurgical remnants are usually fixed to the tracheal wall and rather close to the tracheal lumen. In this situation, a portion of the positrons may escape from the source area, cross the air-filled trachea, and annihilate at the opposite side of the trachea, thereby falsely suggesting activity at that location. Recognizing this shine-through is a prerequisite for correctly identifying lesions, quantifying 124I uptake, and performing dosimetry. To assess this phenomenon quantitatively, we performed phantom experiments and analyzed the 124I patient data already available.
MATERIALS AND METHODS
PET/CT Scans
This study used a PET/CT scanner with a 64-slice CT component (Gemini TF; Philips). In all cases, low-dose CT (30 mAs) was performed. Using the standard Philips time-of-flight ordered-subsets expectation maximization reconstruction (33 subsets, 3 iterations), images corrected for random events, scattered radiation, and attenuation were obtained, as well as uncorrected images. In all patient studies, the matrix size was 144 × 144 (4 × 4 × 4 mm voxels), whereas the phantom studies were also reconstructed in a 288 × 288 matrix (2 × 2 × 2 mm voxels).
Phantom Experiments
In a neck phantom (acrylic, 140-mm diameter, 60-mm thickness), syringes of 1, 2, and 5 mL could be fitted in paratracheal holes near a 20-mm-diameter trachea. The volumes of liquid were 0.1, 0.5, and 1 mL, respectively, containing between 0.3 and 1 MBq of 124I. The minimum total thickness of plastic (stopping-layer thickness) between the source and the tracheal cavity was 0.3, 1.35, 1.85, 2.85, 3.85, and 4.85 mm for the 1-mL syringe and 0.3, 1.55, and 2.55 mm for the 2- and 5-mL syringes (Fig. 1). The phantom was scanned with one source at a time. Similar experiments were performed with 18F and 68Ga using the 1-mL syringe.
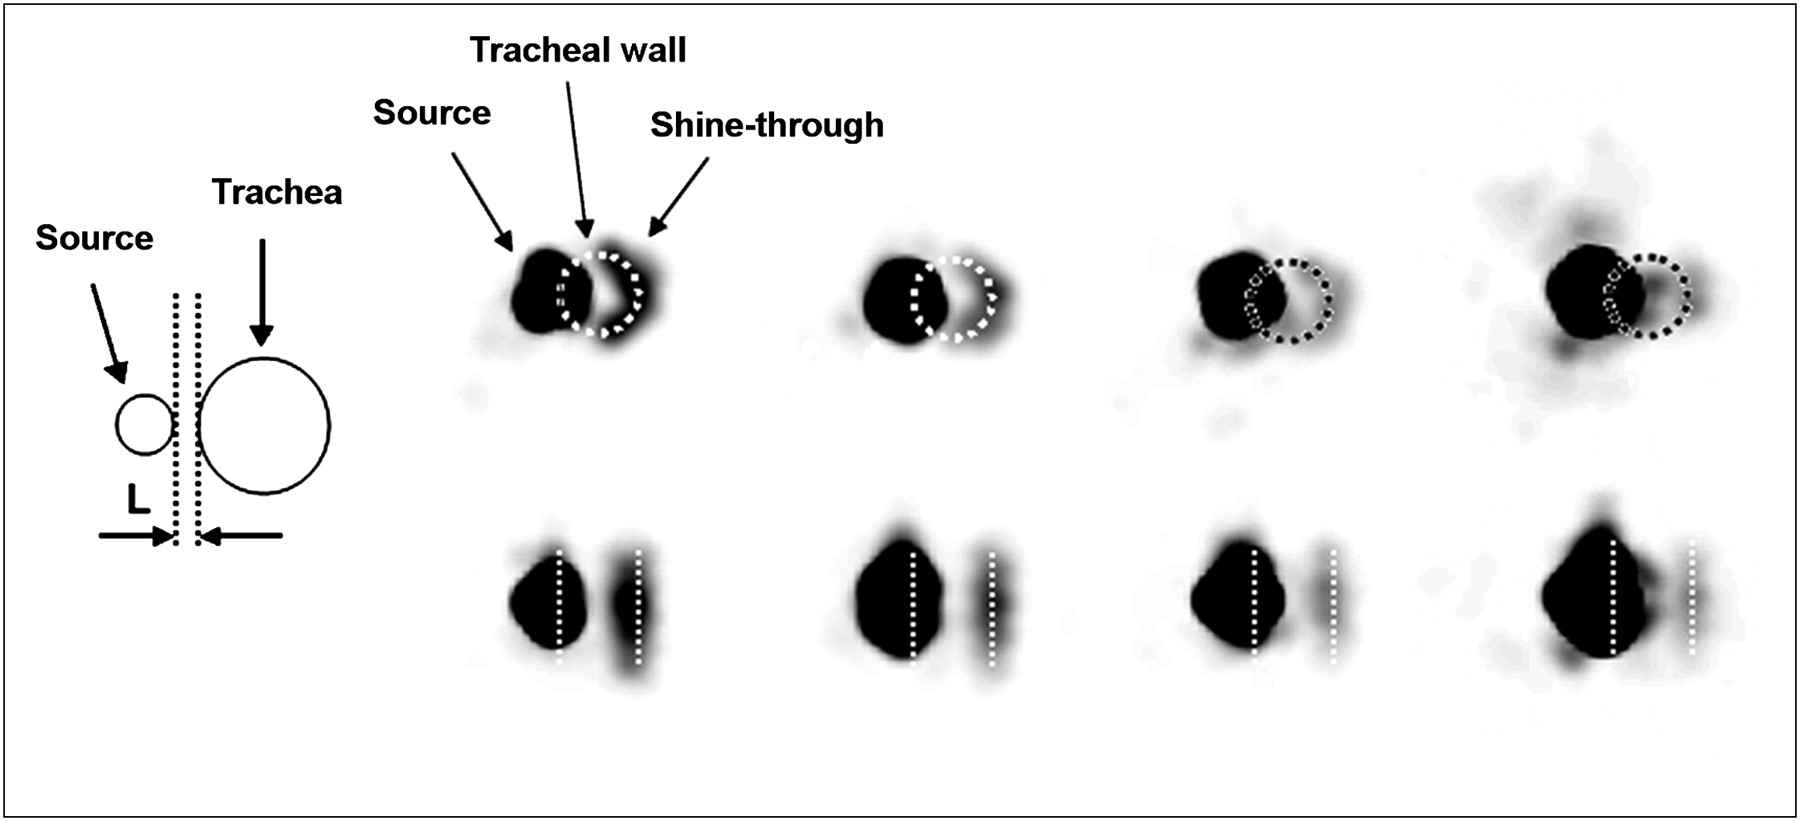
Schematic drawing of phantom source–trachea configuration in transverse plane and illustration of shine-through as function of stopping-layer thickness for 1-mL syringe. Images from left to right are of stopping-layer thickness of 0.3, 1.85, 2.85, and 3.85 mm. Top row shows transverse slices; bottom row, coronal slices. Position of trachea, indicated by circle and straight lines, was taken from CT images. Upper-level window settings for images were, from left to right, 1.2%, 0.54%, 0.39%, and 0.36% of image maximum.
To simulate a thin remnant on the surface of the trachea, we impregnated with a solution of 124I a disk of filter paper that was 12 mm in diameter and had a thickness of 8.8 mg/cm2. After the paper had dried, we glued it against the inner wall of the trachea.
On the images, we manually drew 2 volumes of interest, one encompassing all annihilations in the source area (VOI1) and another encompassing all annihilations in the shine-through area (VOI2). The shine-through percentage was calculated as 100% × (annihilations in VOI2)/(combined annihilations in VOI1 and VOI2).
Analysis of Patient Data
PET/CT had been performed on 29 patients with differentiated thyroid cancer at about 3 wk after thyroidectomy and 1 wk before radioiodine ablation. The scans were obtained at 24 and 96 h after oral administration of 20–25 MBq of 124I.
Lesions that showed 124I uptake and were near the trachea were identified. Subsequently, the opposite tracheal regions were investigated for areas with annihilations. When such an area was found in both transverse and coronal cross sections, it was considered as due to shine-through only if its shape followed the tracheal wall, its centerline coincided approximately with the border of the trachea, and its intensity was above spurious background and noise.
Shine-through was computed as in the phantom study.
RESULTS
Phantom Experiments
Figure 1 shows the PET images obtained for the 1-mL syringe when the stopping-layer thickness was varied between 0.3 and 3.85 mm. Figure 2 graphically presents the magnitude of the shine-through for all 3 syringes and for the various thicknesses of the stopping layer. The shine-through for the filter paper source on the surface of the trachea was approximately 38%.

Relative magnitude of shine-through in phantom study for different source volumes as function of stopping-layer thickness.
Experiments with 68Ga yielded results that were nearly identical to those for 124I (e.g., for the 0.1-mL source and 0.3-mm layer, shine-through was 7.8% vs. 7.4%), whereas for 18F the shine-through (0.9%) was visible only for a stopping-layer thickness of 0.3 mm.
The relative shine-through was quantitatively similar in corrected and uncorrected images.
Patient Data
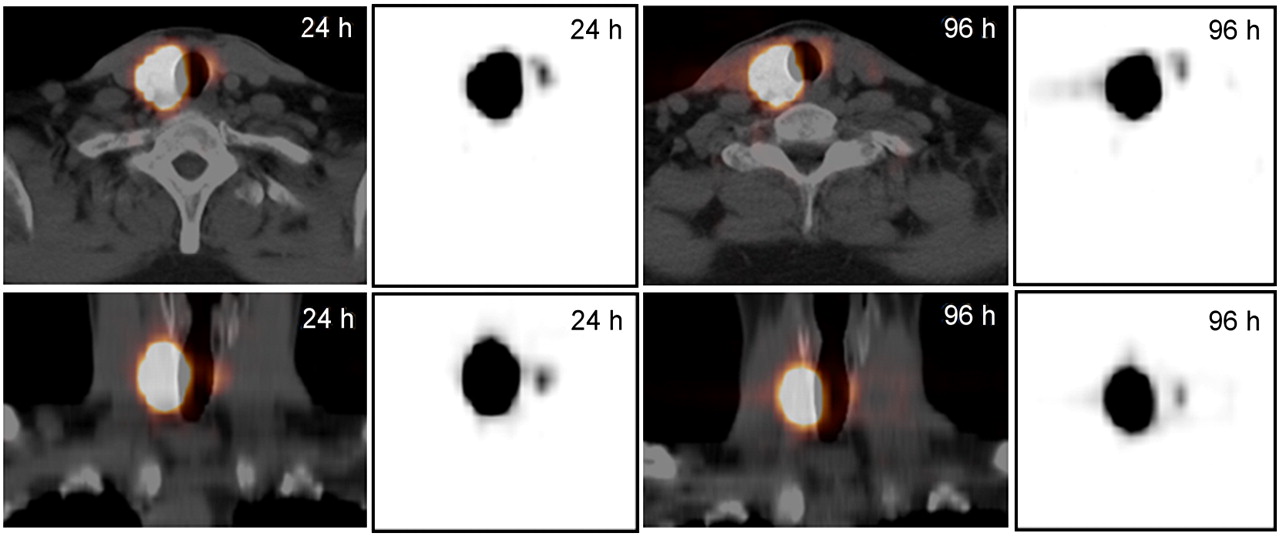
The shine-through phenomenon was seen in 5 of the 29 patients (17%), both at 24 h and at 96 h. Figure 3 shows the shine-through in 4 patients at 96 h in transaxial and coronal cross-sections. Figure 4 shows similar data for the fifth patient, but at 24 and 96 h. Table 1 presents the uptake in the 124I parent lesions as a percentage of the administered activity, as well as the relative magnitude of shine-through at 24 and 96 h.
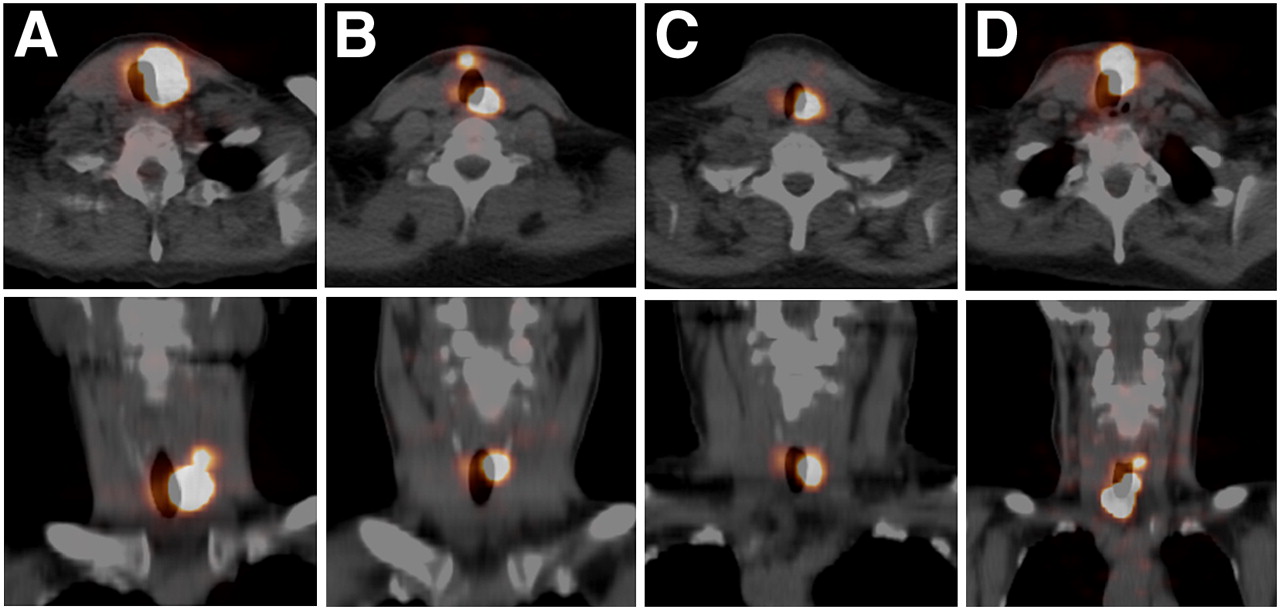
Shine-through in 4 patient studies at 96 h after oral intake of 20–25 MBq of 124I. Top row shows transaxial PET/CT images; bottom row, coronal images. A–D correspond to patient codes in Table 1. Top level of viewing window was 29%, 4%, 24%, and 2% of image maximum.

Shine-through in fifth patient (patient E) at 24 and 96 h after oral intake of 124I. Top row shows transaxial PET/CT images; bottom row, coronal images. Gray-scale PET-only images are shown for comparison with those of phantom in Figure 1.
Relative Magnitude of Lesion Uptake and Shine-Through in 124I PET Patient Studies
DISCUSSION
Our results show that the occurrence of shine-through depends on the positron range and the distance of the decaying nucleus from the trachea. The β-range is approximately 0.5·Eβ,max/ρ cm, with Eβ,max being the maximum β-energy in MeV, and ρ the tissue density in g/cm3. Therefore, in the case of 124I, where 2 β-branches with Eβ,max values of 2.138 and 1.535 MeV are dominant, the soft-tissue range is about 1 cm. The intensity, however, drops steeply with distance (4), as can also be seen in Figure 2.
In this study, we calculated the shine-through from the ratio of the annihilations in the artifact to all annihilations associated with the parent source. This causes a dependence of shine-through on the form and the size of the activity distribution, with shine-through increasing in general with decreasing source volume (Fig. 2, effect of syringe size for fixed stopping-layer thickness). For a thin remnant in the tracheal wall, the ratio of shine-through might even be quite high, as was illustrated by the thin source we placed on the surface of the phantom trachea, yielding about 38% shine-through.
When the shine-through intensity falls below 1%, it becomes difficult to distinguish it from spurious background. Some background is always present in PET, but the additional γ-radiation of the nonideal PET nuclide 124I (5) might cause an increase.
The 68Ga and 18F experiments aimed at excluding other potential explanations for the shine-through phenomenon. 68Ga has an Eβ,max of 1.885 MeV, comparable to that of 124I, and the similarity between the results for 68Ga and 124I rules out the possibility that the γ-emissions in the decay of 124I are a major cause of shine-through. Furthermore, the virtual absence of shine-through in 18F data excludes the possibility that scanner imperfections (e.g., in reconstruction) are causing the artifact. At the same time, the 18F results corroborate the conclusion that positron range effects are responsible, as 18F has a small Eβ,max of 0.634 MeV. The similarity of shine-through in corrected and noncorrected images demonstrates, furthermore, that the effect is not caused by imperfections in the corrections, such as those due to misregistration between PET and CT.
Finally, it should be realized that shine-through can occur with any positron emitter that accumulates close enough to an air-filled cavity. Theoretically, this effect might happen at all air-containing spaces, for example, within the respiratory system and the gastrointestinal tract. Another manifestation of positron escape is the “illumination” of surfaces surrounding thin-walled sources suspended in air.
CONCLUSION
Activity of 124I near the trachea can result in annihilations in the opposite wall of the trachea, incorrectly suggesting activity at that location. Phantom experiments showed that the effect decreases sharply with the thickness of the material between the activity and air cavity.
In 17% of the 29 patients who underwent 124I PET/CT after thyroidectomy, shine-through was observed, with a relative intensity between 0.7% and 14%. The apparent activity in shine-through should be included in the activity of the source lesion to obtain the correct activity distribution.
Acknowledgments
We thank Christian Urbach and Shahriar Tahmasebi for their help with preliminary experiments.
Footnotes
-
COPYRIGHT © 2009 by the Society of Nuclear Medicine, Inc.
References
- Received for publication November 20, 2008.
- Accepted for publication March 9, 2009.


