


Abstract
The purpose of this study was to delineate the differences in intratumoral uptake and tracer distribution of 62Cu-diacetyl-bis(N4-methylthiosemicarbazone) (62Cu-ATSM), a well-known hypoxic imaging tracer, and 18F-FDG in patients with lung cancer of pathohistologically different types. Methods: Eight patients with squamous cell carcinoma (SCC) and 5 with adenocarcinoma underwent 62Cu-ATSM and 18F-FDG PET within a 1-wk interval. For 62Cu-ATSM PET, 10-min static data acquisition was started at 10 min after a 370- to 740-MBq tracer injection. After image reconstruction, 62Cu-ATSM and 18F-FDG images were coregistered, and multiple small regions of interest were drawn on tumor lesions of the 2 images to obtain standardized uptake values (SUVs). The regression lines were determined between SUVs for 62Cu-ATSM and 18F-FDG in each tumor. The slope values were compared between SCC and adenocarcinoma to observe pathohistologic differences in intratumoral distribution of the tracers. Results: SUVs for 62Cu-ATSM were lower than those for 18F-FDG in both SCC and adenocarcinoma. SCC tumors showed high 62Cu-ATSM and low 18F-FDG uptakes in the peripheral region of tumors but low 62Cu-ATSM and high 18F-FDG uptakes toward the center (spatial mismatching). The relationship of SUVs for the 2 tracers was negatively correlated with a mean regression slope of −0.07 ± 0.05. On the other hand, adenocarcinoma tumors had a spatially similar distribution of 62Cu-ATSM and 18F-FDG, with positive regression slopes averaging 0.24 ± 0.13. The regression slopes for 62Cu-ATSM and 18F-FDG differed significantly between SCC and adenocarcinoma (P < 0.001). Conclusion: The intratumoral distribution patterns of 62Cu-ATSM and 18F-FDG were different between SCC and adenocarcinoma in lung cancers, indicating that intratumoral regions of high glucose metabolism and hypoxia could differ with the pathohistologic type of lung cancer. The identification of regional biologic characteristics in tumors such as hypoxia, energy metabolism, and proliferation could play a significant role in the clinical diagnosis and therapy planning for non–small cell lung cancer patients.
The occurrence of tumor hypoxia is considered an important hallmark of many solid tumors because it promotes resistance to radiotherapy and chemotherapy and increases tumor aggressiveness, angiogenesis, and metastatic potential, ultimately resulting in poor prognosis (1–5). Recently, tumor hypoxia has been found to induce multiple metabolic and biologic changes mediated by hypoxia-inducible factors, particularly hypoxia-inducible factor−1α, which trigger the activation of multiple genes in tumor cells involved in glycolysis, cell proliferation, cell survival, angiogenesis, invasion, and metastasis (6,7). In this context, the dynamic characterization of hypoxia and associated metabolic changes in tumor tissues using molecular imaging approaches that are essentially noninvasive, such as PET, will be of great importance (8).
A copper complex of diacetyl-bis(N4-methylthiosemicarbazone) (copper-ATSM) was developed as a tracer of hypoxia-selective uptake in the ischemic myocardium (9–11). Further investigations revealed that copper-ATSM can rapidly (<1 h) delineate hypoxic tumor tissue hypoxia at high contrast in vitro or in vivo (12,13). The availability of different copper radioisotopes provide radiolabeling options for copper-ATSM that are appropriate for imaging or radiotherapy.
Copper-ATSM accumulation has been evaluated and compared with 18F-FDG uptake as measures to predict treatment response in patients with solid tumors, including non–small cell lung cancer (NSCLC) (14–16). Takahashi et al. studied 6 patients with lung cancer who underwent both 62Cu-ATSM and 18F-FDG PET and reported that 62Cu-ATSM accumulated rapidly in all tumor regions but that the intratumoral distribution pattern differed from that of 18F-FDG (14). Dehdashti et al. studied 19 patients with NSCLC using 60Cu-ATSM and 18F-FDG PET and demonstrated that pretreatment tumor uptake of 60Cu-ATSM could predict tumor responsiveness to therapy (16). However, there are no reports of intratumoral distribution patterns of copper-ATSM and 18F-FDG correlating with the pathohistologic type of NSCLC. The differences in pathohistologic types of solid tumors could affect tumor growth, metabolic pattern, response to radiation or chemotherapy, and subsequent prognosis (17–19).
In the present study, the intratumoral uptakes and distribution of 62Cu-ATSM and 18F-FDG were analyzed in patients with 2 pathologically distinct lung tumors: squamous cell carcinoma (SCC) and adenocarcinoma. This study was conducted to determine whether the pathohistologic tumor type affects the characterization of the differential uptake pattern of the 2 tracers using coregistered PET images of 62Cu-ATSM and 18F-FDG.
MATERIALS AND METHODS
Patients
Thirteen patients with biopsy-proven lung cancer awaiting surgical resection or chemoradiation were enrolled prospectively in this study (Table 1). Eight patients had SCC and 5 had adenocarcinoma (mean age, 69 ± 10 y; age range, 53–80 y). In addition to clinical examinations, the patients underwent routine tumor staging procedures that included CT or MRI, laryngoscopy, and biopsy to determine the tumor type. Patients of all tumor grades were included in the study. All patients underwent whole-body 18F-FDG and chest 62Cu-ATSM PET on 2 separate days within a 1-wk interval. They did not receive chemotherapy or radiotherapy targeted at lung cancer before or during 18F-FDG and 62Cu-ATSM PET scans. The study protocol was approved by the Ethics Committee of the University of Fukui, Faculty of Medical Sciences, and written informed consent was obtained from all the subjects before PET studies.
Patient Characteristics and Lung Cancer Information
Preparation of 62Cu-ATSM
The 62Cu-glycine (no-carrier-added 62Cu) solution was obtained from a 62Zn/62Cu generator system every hour (20). 62Cu-ATSM was prepared with a simple mixture of 62Cu solution (5 mL) and 0.2 mL of ATSM solution (0.5 mM in dimethyl sulfoxide) in a sterilized vial (9,14). The radiochemical purity of 62Cu-ATSM was confirmed with high-performance liquid chromatography using authentic unlabeled copper-ATSM before the first patient injection. The radiochemical purity of 62Cu-ATSM was more than 96%.
PET Procedure
For the 62Cu-ATSM PET study, a whole-body PET scanner (Advance; GE Healthcare) was used for data acquisition. A 20-min dynamic PET scan at the location including lung tumors was started after an intravenous injection of 370–740 MBq of tracer over 30 s, with 1-min frames for 10 min and a 10-min frame. A 10-min transmission scan was acquired before the emission scan with a 68Ge/68Ga rod source for attenuation correction. 18F-FDG PET images were also acquired with a whole-body PET/CT scanner (Discovery LS; GE Healthcare) after 18F-FDG administration of approximately 185 MBq. All patients fasted for at least 4 h before the 18F-FDG PET study. Fifty minutes later, the patient was positioned supine in the scanner, and a whole-body emission scan was obtained for 16 min with 3-min scans at the thoracic region (2 bed positions) and 2-min scans in each remaining region (5 bed positions), to completely cover the head to inguinal areas. Before the emission scan in PET/CT, a CT scan was acquired for attenuation correction and for fusion images.
These scanners permit simultaneous PET data acquisition of 35 slices in a 2-dimensional acquisition mode with interslice spacing of 4.25 mm. Performance tests and reproducibility of semiquantitative parameters of these scanners have been reported previously (21,22). The PET images of both 62Cu-ATSM and 18F-FDG were reconstructed by the iterative method, with sections of 14 subsets and 2 iterations. The reconstructed images were converted to semiquantitative images with a unit of standardized uptake value (SUV). The SUV is the ratio of the decay-corrected activity per unit volume of tissue to the administered activity per unit of body weight.
Image Analysis and Statistics
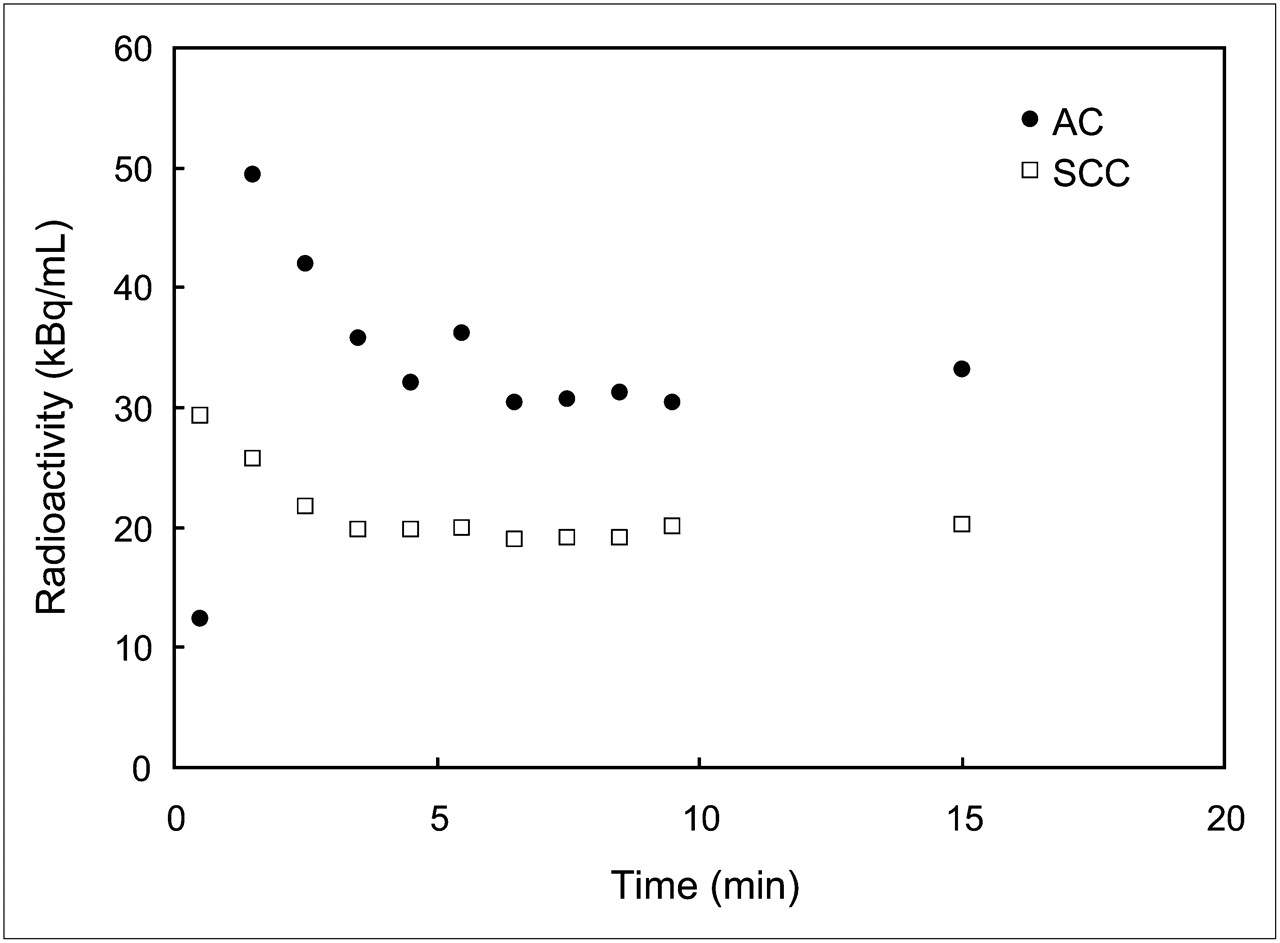
To determine appropriate scan timing for the evaluation of hypoxic images with 62Cu-ATSM, a region of interest (ROI) was drawn at the slice level of the center of the tumor, and a time–activity curve for changes in the radioactivity concentration of the tracer was plotted. The last 10-min frame was used to evaluate the hypoxic region after confirmation of tracer retention from the time–activity curves.
The 18F-FDG and 62Cu-ATSM PET images were manually coregistered to individual CT images using image-analyzing software (Dr. View; AJS Inc.), and it was confirmed that the 2 PET images were in the same location. Multiple small, circular ROIs (10 mm in diameter) were drawn on each tumor lesion of fused images, using at least 3 transaxial slices to obtain regional SUVs. The CT images were used to draw the ROIs on the soft-tissue-density regions inside the tumor. For each patient, mean SUVs of each ROI (average value of all pixels within each ROI [SUVroi]) and of the whole tumor lesion (average value of all pixels within the tumor [SUVmean]) were obtained and compared to determine intratumoral tracer distribution and uptake, respectively.
The SUVroi for both 18F-FDG and 62Cu-ATSM PET images was plotted, and the slope values of linear regression lines were obtained for each tumor. Differences in the slopes for the intratumoral tracer accumulation were compared between SCC and adenocarcinoma by Student t test. An F test was performed before the t test to check the sample variances. Comparison of SUVmean of 18F-FDG and 62Cu-ATSM between SCC and adenocarcinoma was performed using ANOVA, with a post hoc Scheffé test. A probability value of less than 0.05 was considered to indicate a significant difference.
RESULTS
Intratumoral SUV and Tracer Distribution
Figure 1 shows representative time–activity curves of 62Cu-ATSM in SCC and adenocarcinoma tumors. Because all tumors showed stable retention of 62Cu-ATSM at frames of 6–8 min and later in the time–activity curves of 20-min dynamic data, the image of the last 10-min frame was used to evaluate hypoxic tissues. SUVmean for 62Cu-ATSM and 18F-FDG is given in Table 1. SUVmean from all tumors was 1.79 ± 0.88 for 62Cu-ATSM and 4.69 ± 1.90 for 18F-FDG (P < 0.001). The SUVmean of 62Cu-ATSM for SCC was 1.95 ± 0.88, which was significantly lower than the SUVmean of 18F-FDG (5.61 ± 1.09, P < 0.0001). The adenocarcinoma tumors also showed a lower SUVmean for 62Cu-ATSM than for 18F-FDG, but the difference was not significant (1.54 ± 0.92 vs. 3.20 ± 2.07, respectively). The mean sizes of the tumors were 31.4 ± 8.4 mm in SCC and 23.6 ± 12.7 mm in adenocarcinoma, which was not significantly different.

Representative time–activity curves of 62Cu-ATSM for SCC and adenocarcinoma tumors. Stable retention of 62Cu-ATSM at frames of 6–8 min and later in time–activity curves was observed in all patients.
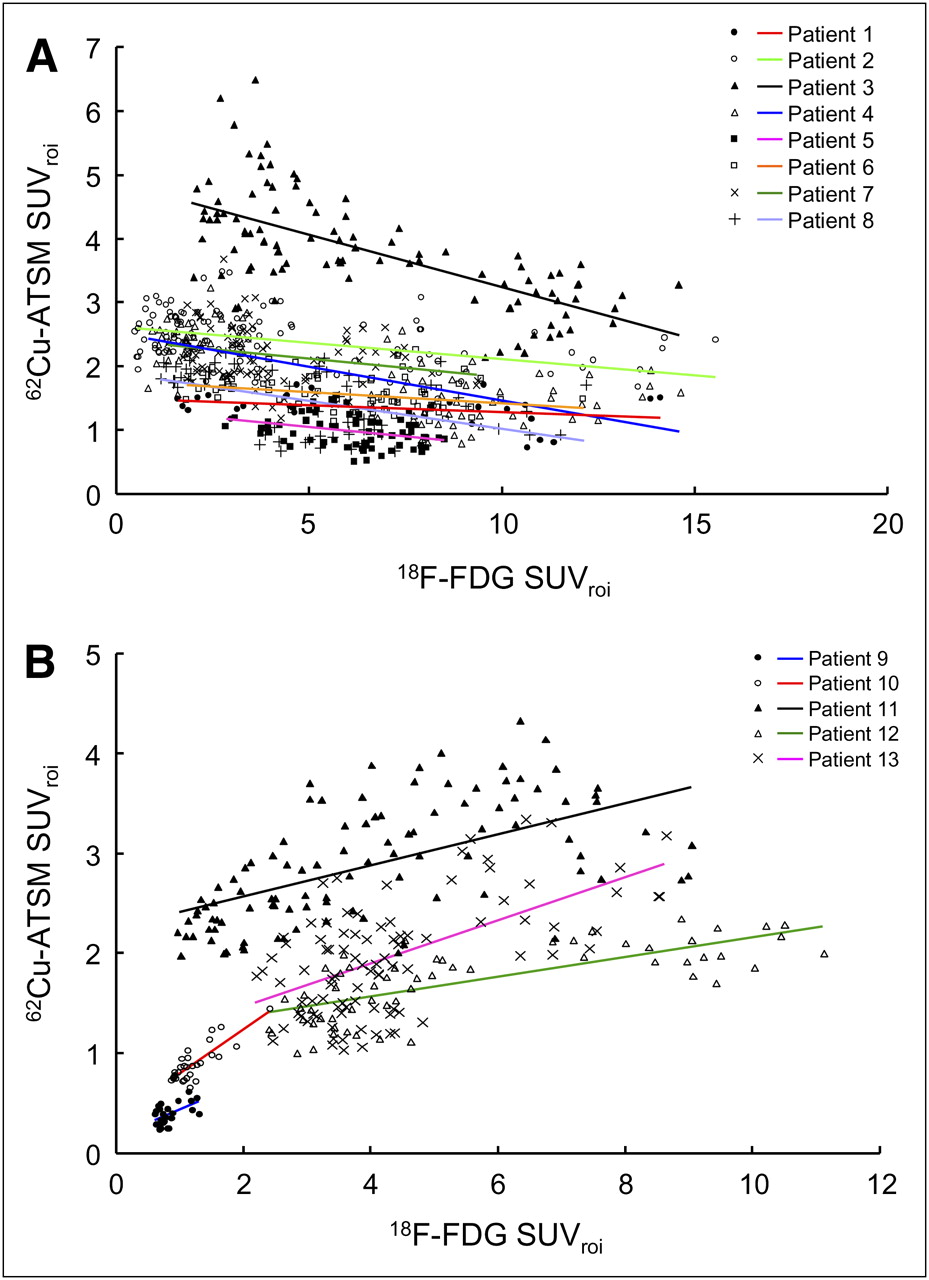
The intratumoral spatial distributions of 62Cu-ATSM and 18F-FDG were analyzed for each tumor lesion after image coregistration by scatter plot and linear regression for SUVroi. The SCC lesions showed a negative correlation, with mean slopes of −0.07 ± 0.05 (n = 8), indicating that the spatial distributions of 62Cu-ATSM and 18F-FDG were significantly different within the tumor (i.e., high 62Cu-ATSM and low 18F-FDG uptakes in the periphery but low 62Cu-ATSM and high 18F-FDG uptakes toward the center) (Fig. 2A; Table 2). The regression slopes of adenocarcinoma lesions showed a positive tendency averaging 0.24 ± 0.13 (n = 5), indicating that the spatial distributions of 62Cu-ATSM and 18F-FDG were similar within the tumor (Fig. 2B; Table 2). The slopes for the 62Cu-ATSM and 18F-FDG correlation were significantly different between SCC and adenocarcinoma (P < 0.001).

Relationship between 18F-FDG SUVroi and 62Cu-ATSM SUVroi obtained from multiple small ROIs on each tumor lesion of SCC (A) and adenocarcinoma (B). Lines are regression lines for each lesion.
Results of Linear Regression for SUVroi
Case Presentation
Figure 3 shows images of 62Cu-ATSM and 18F-FDG PET in a patient with SCC (patient 4: T2N0M0, stage IIB). The 18F-FDG image shows intense uptake in the right lung. A 62Cu-ATSM image at the corresponding slice level shows high uptake in a region different from the 18F-FDG image. A CT image at the same level demonstrates soft-tissue density with irregular borders of 53 × 36 mm adjacent to the right mediastinum. Plots for 18F-FDG and 62Cu-ATSM uptake showed a negative correlation for this patient (Fig. 2A).

Transaxial PET images of 62Cu-ATSM (A), 18F-FDG (B), and their fusion (C) and corresponding CT image (D) of 59-y-old man with SCC at right hilus. Fusion image is depicted for 62Cu-ATSM PET in color and for 18F-FDG PET in gray scale.
Figure 4 shows PET and CT images for a patient with adenocarcinoma (patient 13: T2N3M1, stage IV). An 18F-FDG image shows intense uptake in the lower lobe of the left lung. A 62Cu-ATSM image at the corresponding slice level also shows intense uptake corresponding to the high-uptake region in the 18F-FDG image. A CT image at the same level demonstrates soft-tissue density with irregular borders of 36 × 31 mm adjacent to the descending aorta and vertebra. The original tumor showed a positive correlation between 18F-FDG and 62Cu-ATSM uptake (Fig. 2B).

Transaxial PET images of 62Cu-ATSM (A), 18F-FDG (B), and their fusion (C) and corresponding CT image (D) of 76-y-old man with adenocarcinoma in left lower lung. Fusion image is depicted for 62Cu-ATSM PET in color and for 18F-FDG PET in gray scale. Both original tumor and lymph node metastasis showed similar uptake patterns between 18F-FDG and 62Cu-ATSM.
DISCUSSION
The present study revealed that the intratumoral distribution patterns of 62Cu-ATSM and 18F-FDG are different in lung cancers according to the correlation of tracer uptake and tumor pathohistology. 62Cu-ATSM uptake was intense in all NSCLC cases but was significantly lower than the 18F-FDG uptake, and this tendency was greater in SCC than in adenocarcinoma. 62Cu-ATSM uptake in SCC tumors was significantly lower than 18F-FDG uptake, whereas the difference was not significant in adenocarcinoma tumors. Interestingly, SCC tumors showed high 62Cu-ATSM uptake at reduced 18F-FDG uptake areas in the periphery and vice versa in the center of the lesion, resulting in negatively inclined regression slopes in all cases. This result showed a spatially mismatched distribution of the 2 tracers. In contrast, a matching increase in 62Cu-ATSM and 18F-FDG uptakes with positive regression lines was observed in adenocarcinoma tumors, indicating homogeneous intratumoral distribution of the 2 tracers. The different uptake and distribution patterns of 18F-FDG and 62Cu-ATSM suggested that the regions of increase in glucose metabolism and the hypoxic overreduction microenvironment within the tumor could vary depending on the pathohistology of the tumor. Although it is difficult to fully explain the pathophysiologic details for the differential intratumoral uptake or distribution pattern of 62Cu-ATSM and 18F-FDG, dual-tracer studies targeting different biochemical information would be useful in diagnosis or treatment planning.
Hypoxic regions are known to exist in solid tumors including NSCLC. The visualization of tumor hypoxia is important because the hypoxic environment causes activation of multiple genes in tumor cells involved in glycolysis, cell proliferation, cell survival, angiogenesis, invasion, and metastasis, which affects glucose metabolism and other associated cellular processes (7,23). Furthermore, the diagnosis of these hypoxic tumors before treatment would give useful information for cancer therapy because hypoxic tumors show resistance to radiation and chemotherapy (1–5). In several previous reports, morphologic colocalization PET images of glucose metabolism with 18F-FDG and hypoxia assessed by 18F-fluoromisonidazole, the most widely used PET agent for regional hypoxia mapping, showed little correlation in NSCLC irrespective of pathohistologic types (23), although different types of solid tumors showed some specific tendency of tracer accumulation (24). One reason for this little correlation is presumed to be the low tracer-to-background ratio and slow clearance of 18F-fluoromisonidazole (12). In this study, 62Cu-ATSM was used as a hypoxia-selective tracer and could visualize the different intratumoral distribution patterns of tracers in SCC, suggesting that the spatial mismatch observed between 62Cu-ATSM and 18F-FDG may indicate tumor tissues resistant to various treatments. Another advantage of 62Cu-ATSM, compared with 18F-fluoromisonidazole, is a faster distribution and retention mechanism of the tracer in the overreduction environment. The tracer accumulation was almost stable about 6–8 min after administration, as observed in our result in Figure 1 and the previous report by Takahashi et al. (14).
Copper-ATSM is a stable copper(II) complex developed as a hypoxia-selective imaging agent with a high membrane permeability, but it is retained in cells and tissues with reduced microenvironments such as hypoxia (9–13). Previous studies reported that in the hypoxic myocardium, a high nicotinamide adenine dinucleotide (NADH) concentration resulted in copper-ATSM accumulation through a retention mechanism of copper(II) reduction into copper(I) by a mitochondrial electron transport chain enzyme (NADH dehydrogenase) in an NADH-dependent manner (9,25). However in tumor cells, copper-ATSM reduction is reported to be mediated by NADH-cytochrome b5 reductase or nicotinamide adenine dinucleotide phosphate (NADPH)-cytochrome P450 reductase located in the microsome or cytosol fraction rather than in the mitochondria in an NADH–NADPH-dependent manner (26). The reduced copper(I) dissociates from the ATSM complex and eventually is trapped irreversibly in tissue in an overreduced environment. Recent studies based on advanced spectroelectrochemical techniques and computational work indicate that the hypoxia selectivity of copper-ATSM arises because of a delicate equilibrium in which the rates of reduction (most likely enzyme-mediated), reoxidation, and protonation are fast relative to the rate of pH-mediated ligand dissociation (27,28). Thus, the accumulation of copper-ATSM may not directly depict oxygen tension but rather a high NADH–NADPH concentration with dynamic changes in intracellular pH that result from the overreduction of hypoxic tissues still having a viable mitochondrial or microsomal enzyme system.
The different tracer distribution patterns between SCC and adenocarcinoma may reflect the characteristics of tumor pathology. The tumor sizes tended to be smaller in adenocarcinoma than in SCC, but they were not significantly different. Even the large adenocarcinoma tumors showed a similar distribution pattern (patients 11–13). Differences in pathologic features that characterize the expansive growth pattern of SCC and clustering of microgrowth at each alveolar structure in adenocarcinoma may have resulted in the different accumulation patterns of PET tracers. The intratumoral distribution of 62Cu-ATSM and 18F-FDG was assessed previously in several animal studies with a wide variety of solid tumors implanted in mice and rabbits (29–32). Heterogeneity of tumor hypoxia and glucose metabolism was found in most of these tumor models with outer accumulation of 62Cu-ATSM, compared with inner accumulation of 18F-FDG in the tumor, irrespective of their sizes. However, the mass of this microenvironment may yield a homogeneous accumulation pattern in a whole-mass lesion as observed in adenocarcinoma. The evaluation of tumor heterogeneity in living subjects as in this study will provide useful information because it allows the monitoring of the pathophysiologic changes in an intact tumor microenvironment.
In this study, the regional distribution of 2 tracers was determined by drawing multiple ROIs on the coregistered 62Cu-ATSM and 18F-FDG PET images of each patient. Small-sized ROIs on 3 or more transaxial image slices almost covering the tumor area were drawn, and the same ROIs were applied to individual 62Cu-ATSM and 18F-FDG images to obtain SUVroi and SUVmean. Dehdashti et al. used the tumor-to-muscle ratio in their study because SUVs for copper-ATSM and 18F-FDG were not well correlated (15,16). However, as they discussed in their report, they did not coregister 2 PET images, and the maximum value of SUV in the tumor was used for comparison. Furthermore, the reconstruction method for 18F-FDG PET and copper-ATSM PET was different; that is, a filtered backprojection method was used for copper-ATSM PET. Because the pixels of maximum values in the 2 PET images are usually different for each tumor as observed in the different distribution patterns in the present study, comparison of the maximum SUV between different tracers cannot be correlated. In this study, 2 images were coregistered, and the same regional values were compared between the 2 tracers. This method showed good correlation for each lesion as observed in our previous preliminary report (14), although the correlation could not be observed when all SUVroi data were compared for all lesions together. The use of small ROIs, especially when applied to multiple areas of a tumor lesion and correlated by SUVroi as in this study, would be a useful method for characterizing the intratumoral distribution pattern.
CONCLUSION
In the present study with NSCLC patients, we demonstrated that 62Cu-ATSM uptake was lower than 18F-FDG uptake and that the intratumoral distribution pattern of these 2 tracers differs with the pathohistologic type of lung cancer. SCC exhibited spatial mismatching, with high–62Cu-ATSM regions localizing toward the periphery and high–18F-FDG regions localizing toward the center of the tumor; adenocarcinoma cases had homogeneous distribution of the 2 tracers. The identification of regions with distinct biologic characteristics such as hypoxia and energy metabolism could play a significant role in the clinical diagnosis and therapy planning for NSCLC patients.
Acknowledgments
We thank Dr. Tsuneo Saga, Dr. Toshimitsu Fukumura, and other staff at the Molecular Imaging Center, National Institute of Radiological Sciences, Chiba, Japan. We also thank the staff of the Department of Respiratory Medicine, Third Department of Internal Medicine, and Biomedical Imaging Research Center, University of Fukui, Fukui, Japan, for clinical and technical support. This study was partly funded by a Grant-in-Aid for Scientific Research from the Japan Society for the Promotion of Science (17209041, 21390342) and the 21st Century COE Program (Medical Science).
Footnotes
-
COPYRIGHT © 2009 by the Society of Nuclear Medicine, Inc.
References
- Received for publication August 3, 2009.
- Accepted for publication August 27, 2009.


Jump to section
Related Articles
Cited By...
- Increased oxidative stress is related to disease severity in the ALS motor cortex: A PET study
- In Vivo Quantification of Hypoxic and Metabolic Status of NSCLC Tumors Using [18F]HX4 and [18F]FDG-PET/CT Imaging
- 62Cu-Diacetyl-Bis (N4-Methylthiosemicarbazone) PET in Human Gliomas: Comparative Study with [18F]Fluorodeoxyglucose and L-Methyl-[11C]Methionine PET
- Heterogeneity in Intratumor Correlations of 18F-FDG, 18F-FLT, and 61Cu-ATSM PET in Canine Sinonasal Tumors
- Application of 62Cu-Diacetyl-Bis (N4-Methylthiosemicarbazone) PET Imaging to Predict Highly Malignant Tumor Grades and Hypoxia-Inducible Factor-1{alpha} Expression in Patients with Glioma