


Abstract
Cell-mediated therapy (immunotherapy) for the treatment of cancer is an active area of investigation in animal models and clinical trials. Despite many advances, objective responses to immunotherapy are observed in a small number of cases, for certain tumor types. To better understand differences in outcomes, it is critical to develop assays for tracking effector cell localization and function in situ. The fairly recent use of molecular imaging techniques to track cell populations has presented researchers and clinicians with a powerful diagnostic tool for determining the efficacy of cell-mediated therapy for the treatment of cancer. This review highlights the application of whole-body noninvasive radioisotopic, magnetic, and optical imaging methods for monitoring effector cells in vivo. Issues that affect sensitivity of detection, such as methods of cell marking, efficiency of cell labeling, toxicity, and limits of detection of imaging modalities, are discussed.
Cancer is a leading cause of death in the United States and will affect 1 in 3 people during their lifetimes (1). The mammalian immune system can recognize and usually eliminate infected cells with exquisite sensitivity, often leading to long-term memory of pathogen-associated antigens. It is thought that the immune system regularly detects and destroys transformed cells, a process termed immunosurveillance (2). Immunotherapy seeks to modulate immune function to target the cancerous cells that have evaded immune surveillance. Therefore, harnessing the power of the adaptive cellular immune system to eradicate tumors, while sparing normal tissues, is an attractive potential therapy for the treatment of cancer, particularly metastatic disease.
CELLULAR IMMUNE SYSTEM AND IMMUNOTHERAPY
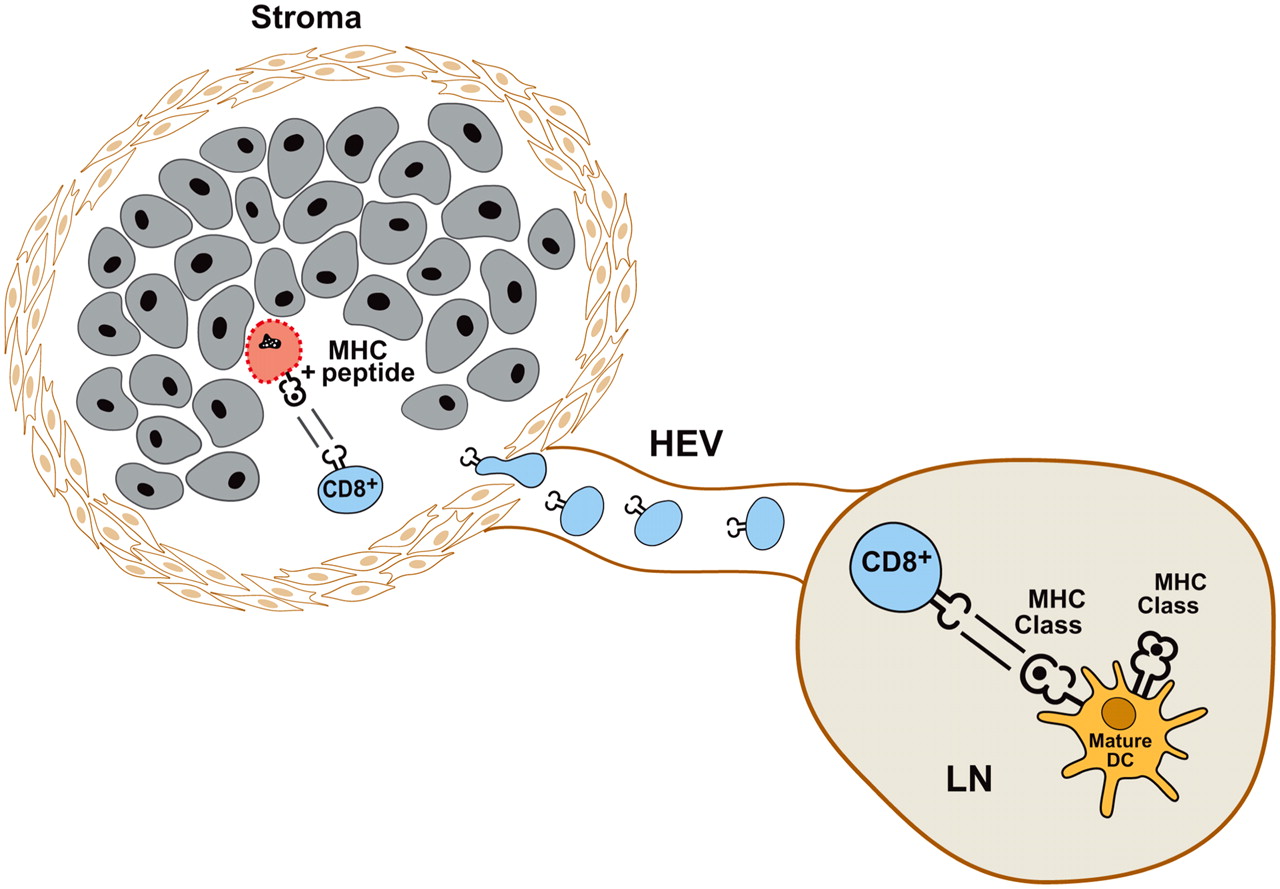
Effector cells used in cancer therapy include CD8+ cytotoxic T cells, CD4+ helper T cells, CD4+ CD25+ regulatory T cells, and natural killer cells (Table 1) (3). Peptide fragments of antigens expressed by tumor cells are presented to the immune system by professional antigen-presenting cells (APCs), such as dendritic cells (DCs). As a result, cytolytic (CD8+) and helper (CD4+) T cells proliferate and release effector cell cytokines. When tumoricidal activity can be detected, cytolytic T cells (CTLs) are the primary effector cells, whereas CD4+ T helper cells provide help in the form of secreted cytokines. The generation of an effective antitumor immune response requires the concerted activity of all of these components of the immune system (Fig. 1).

“Best-case” scenario. CD8+ T cells are activated in draining lymph node (LN) by DCs expressing tumor antigen peptides on class I MHC (HLA-A, HLA-B, and HLA-C). Once activated, CD8+ T cells home to site of tumor, invading stroma to gain access to tumor cells. Antigen-expressing tumor cells are recognized and lysed by CD8+ T cells. HEV = high endothelial venule.
Major Effector Cells in Antitumor Immunity
Immunotherapy of human cancers can have dramatic results in some cases (4–7). Both active and passive treatment approaches have been used in preclinical and clinical models of cancer therapy (8). Active immunotherapy seeks to generate an antitumor immune response within the host by immunization with DNA or RNA encoding tumor antigens, tumor cell lysates, or antigen-loaded DCs (9–11). The goal is to elicit a long-lasting host T-cell response to the antigen(s) that will eliminate the primary tumor, minimal residual disease, and perhaps metastatic variants that may arise later. On the other hand, in passive immunotherapy, peripheral T lymphocytes isolated from an animal or a patient are modified and amplified in vitro. The amplified cell populations are then transfused back into the host to eliminate the tumor burden (Fig. 2).

Passive immunotherapy strategies for treatment of cancer. Subsets of effector or regulatory cells are isolated from spleen or peripheral blood (PBL) of animals or patients, respectively (top left). Cells are amplified in cultures by stimulation with antibodies or tumor antigens. During in vitro culturing, effector cells can be modified by viral introduction of cloned T-cell receptor genes, cytokines, and other factors. Amplified cell population is transferred back into animal or patient. Alternatively, graft-vs.-leukemia strategies use hematopoietic cells from murine or human bone marrow. To prevent potentially lethal graft-vs.-host (GvH) effect, bone marrow cells may be depleted of effector CD8+ T cells or may be mixed with regulatory T cells to inhibit GvH while accentuating graft-vs.-leukemia effect. These approaches could be monitored by optical imaging, MRI, and radioisotopic imaging modalities.
IMMUNE EVASION
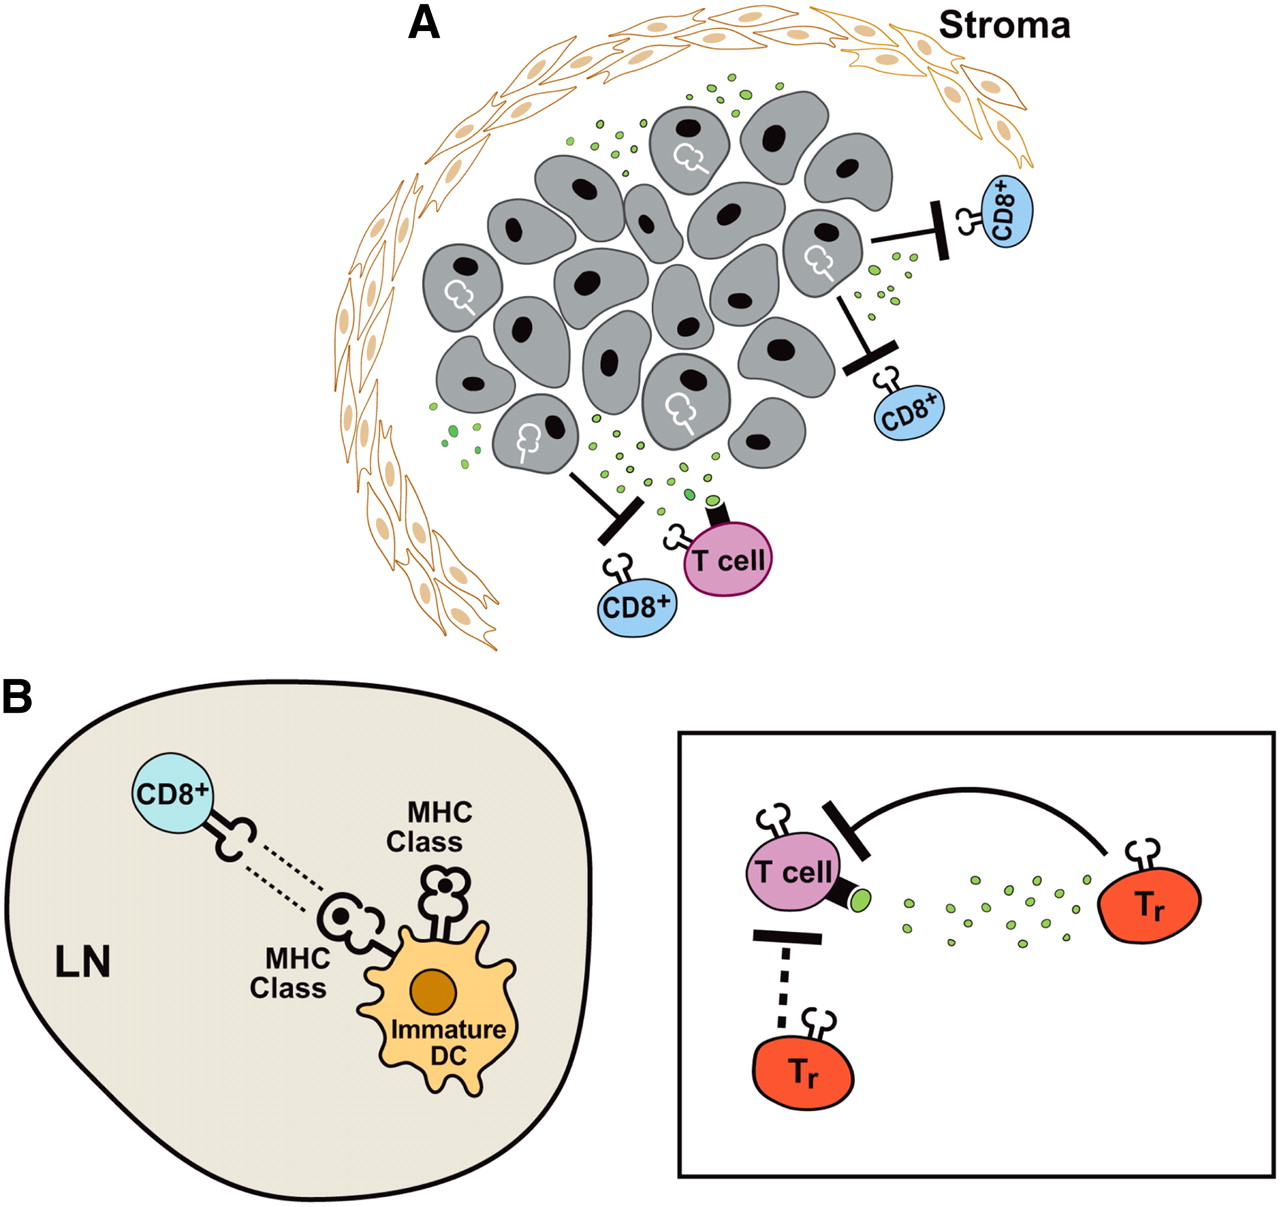
T cells often encounter inhibitory signals in tumor-bearing individuals (Fig. 3). The effector T-cell response can be attenuated by the inhibitory signals present at the tumor or at distant sites. Locally, this process may include the activity of regulatory T lymphocytes as well as active immunosuppression by the tumor cells themselves and physical barriers preventing tumor infiltration. Once entry is gained, regulatory T lymphocytes can inhibit productive immune responses through both contact-dependent and contact-independent mechanisms (12). The growing tumor can evade the immune system by downregulating the expression of antigen-presenting (major histocompatibility complex [MHC] and human leukocyte antigen [HLA]) molecules, mutating the antigen presentation machinery, and secreting cytokines that can inhibit the migration and action of T lymphocytes (13). Systemically, CTLs can be tolerant of antigens expressed by the tumor if they are normal self-proteins (14). In addition, tolerance-inducing signals may be received from APCs in the lymph nodes, where the activation of tumor-reactive lymphocytes is thought to take place (15). Both of these situations necessitate breaking immune tolerance to generate an effector cell response. Immunomodulatory agents can help to potentiate antitumor responses (16). These agents can include cytokines, blocking inhibitory signals, or activating stimulatory molecules expressed by T cells. Therefore, it is the delicate balance between the generation of antitumor responses and systemic and tumor-initiated inhibitory mechanisms that determines whether the outcome will be tumor rejection or persistence and continued growth.

Immune evasion strategies. (A) Local inhibitory mechanisms initiated by tumors can prevent effector cell function. Tumor cells may downregulate MHC (shown in white line) or antigen expression and therefore be unrecognizable to CD8+ T cells. Tumor cells can also secrete cytokines, such as transforming growth factor-β (TGF-β) (green dots), and inhibit effector cell function. (B) (Left) T cells may not be properly activated in lymph node (LN). Immature DCs (e.g., improperly process antigen or fail to upregulate costimulatory molecules) transmit tolerance-inducing (inactivating) signals to T cells. (Right) Regulatory T cells (Tr) can inhibit CD8+ and CD4+ effector cell responses. Regulatory T-cell inhibition may be mediated by direct contact with effector cells or by secretion of inhibitory cytokines, such as TGF-β, that prevent T-cell function.
UTILITY OF IMAGING IN MONITORING IMMUNOTHERAPY
In the majority of adoptive transfer studies, objective clinical responses to such types of treatments are often weak, and the fate of the effector cells is unclear. The localization and function of immune cells at the tumor site are determined by biopsy and ex vivo analysis of cell function, respectively (17). Such assays, although valuable, are “snap shots” in time and space and do not adequately reflect the plasticity of the immune response. Furthermore, they demonstrate that T cells that appear functional in in vitro assays are nonetheless prevented from launching an effective antitumor response in vivo. This contradiction makes it critical to develop methods for assessing the localization and function of T cells and other immune cell types in situ. In recent years, it has become increasingly apparent that molecular imaging is superbly suited to this task.
Molecular imaging is a method of detecting cells or cellular processes noninvasively within whole, living animals (18). Cell growth, death, and movement can be monitored by radioisotopic, magnetic, and optical imaging methods. Molecular imaging has been used extensively to characterize tumor growth, regression, and metastasis both clinically and in the laboratory. More recently, it has been adapted to study the interaction of cells of the immune system with tumors.
Approaches such as intravital microscopy and 2-photon imaging have been used to study the trafficking and interaction of single cells in vivo and are reviewed extensively elsewhere (19). Here, we discuss recent advances in the whole-body imaging of immune cell populations in preclinical and clinical models of cancer immunotherapy. We review both nonradioisotopic and isotopic methods for tracking the localization and function of immune cell subsets in vivo.
CLINICAL IMAGING OF IMMUNOTHERAPY
To effectively track the movement and function of tumor-reactive immune cell populations, an imaging agent should be detectable noninvasively in living subjects, be specific for the population of interest, mark at least a representative proportion of the population of interest, have minimal toxicity or effect on the function or characteristics of therapeutic cells, allow serial imaging over days to months and even years, and provide quantitative, 3-dimensional, organ-specific localization of cells of interest. Radioisotopic, MRI, fluorescent imaging, and bioluminescent imaging agents have been developed for the labeling of specific cell populations and can be used for noninvasive studies with various abilities and minimal toxicity. In passive immunotherapeutic strategies, the effector cell population can be marked quite specifically. However, as discussed later, indirect labeling may be more useful for the imaging of specific cell types involved in antitumor immune responses, especially when a cell type of interest is highly proliferative and must be monitored for a long time. PET and SPECT, as single imaging modalities, provide 3-dimensional images with sensitive spatial resolution but little anatomic information, whereas optical techniques remain largely 2-dimensional and are currently not applicable to human patients. As discussed later, some of these limitations can be overcome by the use of dual-modality imaging methods. MRI provides spatial and anatomic information, but the contrast agent is diluted by cell division. Although indirect labeling strategies have been reported for MRI, they are not widely used (20). The most commonly used clinical imaging agent, 18F-FDG, does not mark a specific cell population because of its mode of activity, although it satisfies all of the other criteria. Therefore, currently no single clinical imaging agent meets all of the aforementioned criteria.
METHODS FOR LABELING CELLS OF INTEREST
The choice of labeling method depends, to a great extent, on whether the intended goal is to track terminally differentiated cell populations, such as DCs, or cells with proliferative potential, such as T lymphocytes or bone marrow stem or progenitor cells generated in vitro or in vivo. The ability to mark a representative proportion of a specific cell population was first investigated in the late 1980s (21). In the early 1990s, lymphokine-activated killer cells generated in vitro were labeled with 111In before reinfusion into patients with malignant melanomas (22). The distribution of the transferred cell population and tumor homing of the lymphokine-activated killer cells were detected by serial scanning with a high-resolution γ-camera.
Direct Labeling
In direct cell labeling, a marker with no capacity for regeneration is introduced into the cell, usually by coincubation in vitro. The label is diluted on cell division. The SPECT agents 99mTc-labeled hexamethylpropyleneamine oxime (99mTc-HMPAO) and 111In-oxine are radioisotopes that are used to label cells by passive diffusion (23). These agents were first used to label lymphocytes in the mid-1980s. Recently, the PET tracer 64Cu-pyruvaldehyde-bis(N4-methylthiosemicarbazone) (64Cu-PTSM), which is also retained in the cytoplasm, was used to label lymphocytes in vitro; small-animal PET imaging detected the adoptively transferred murine lymphocytes in the spleen (24). These agents can be imaged by sensitive γ-cameras or PET cameras that provide spatial resolution in the millimeter range. Likewise, the clinical PET tracer 18F-FDG can also detect metabolic areas of inflammation when injected into an animal or human subject. The half-life (t1/2) of these tracers allows the tracking of labeled cells from several hours to several days.
MRI agents, such as perfluoropolyether (25) and superparamagnetic iron oxide particles (SPIOs) (26–28), have been used to label DCs. Likewise, SPIOs (29,30) and highly derivatized cross-linked iron oxide nanoparticles (CLIOs) have been used to label T lymphocytes (31). These particles are diluted on cell division. Therefore, the time frame for imaging can be several days to several weeks, depending on the rate of proliferation of the labeled cells. Another proposed limitation of MRI contrast agents such as SPIOs is the nonspecific uptake of the agents by macrophages that engulf dead labeled cells (32,33). MRI provides exquisite spatial localization of labeled cells with resolution in the range of 100 μm. The mass of a contrast agent necessary to acquire a specific image must be chosen to minimize toxicity and avoid compromising the function of the labeled cells. Unfortunately, immune cell types generally incorporate much less contrast agent than other cell types, and their function may be affected by perturbations such as label incorporation, although many published studies have not reported this finding (30,31,34).
Fluorescent dyes, such as Cy5.5 and Alexa Fluor (Invitrogen), can also be used to nonspecifically label cells. Unlike fluorescent imaging, near-infrared (NIR) imaging provides high signal strength with relatively low autofluorescence (35). NIR whole-body imaging with these labels provides a sensitive readout for animal studies of tumor growth and immune cell localization (36).
Indirect Labeling
Immunotherapy seeks to generate lymphocyte populations with long-lasting memory of the immunizing antigen, in the hope that these cells will be effective in combating metastatic disease that may arise months to years after the primary tumor has been treated. To monitor the trafficking and function of these cells in vivo, a label that will be retained after many cell divisions must be incorporated by the cells.
Indirect cell labeling marks a cell with a reporter gene that is retained in subsequent generations. Reporter gene–based imaging methods permit the stable marking of individual cell populations with excellent sensitivity of detection. Naturally occurring proteins, such as green fluorescent protein (GFP), are introduced into a cell by transfection or infection with viral vectors. These proteins fluoresce on excitation with specific wavelengths of light. Labeled cells can be detected at the single-cell level by microscopy and flow cytometry and noninvasively within the intact animal by a variety of sensitive charge-coupled device camera detection systems. The limitation of this method is that fluorescent signals are attenuated by body mass, skin, hair, and other factors. Additionally, the high autofluorescence in animal tissues reduces the signal-to-noise ratio (37). Nevertheless, this method can be used to track relative changes over time within and between animals. The use of NIR reporters such as DsRed provides higher signal strength with reduced autofluorescence and lower tissue signal attenuation, resulting in a much higher signal-to-noise ratio and more sensitive image detection (35).
Indirect labeling with enzymes is a powerful alternative approach to labeling with fluorescent proteins. The enzyme–substrate scheme has been used for both radioisotopic and luminescent marking of cell populations (38). For small-animal imaging, the most commonly used enzyme is firefly luciferase, derived from the firefly Phontinus pyralis (39). To detect marked cells, the substrate, luciferin, is injected into an animal. In the presence of oxygen, magnesium, and adenosine triphosphate, the enzyme–substrate reaction results in light emission that is captured by a sensitive charge-coupled device camera. Unlike imaging with fluorescent molecules, the luciferase reaction cannot be detected at the single-cell level (40). Although luciferase activity can be detected in vitro in whole cells and cell lysates, these assays provide only population-level information. The advantage of this bioluminescent reporter is the virtually complete absence of background bioluminescence, resulting in a very high signal-to-noise ratio. The strong light emission is less attenuated than weaker fluorescent signals, resulting in greater depth penetration of the signal and a more sensitive 2-dimensional image. Renilla luciferase from the sea pansy Renilla reniformis as well as synthetic modified variants are also used as reporters (39). The emission spectra of Renilla and firefly luciferases overlap, but their kinetics of light emission are very different. Therefore, 2 cell populations, each marked with a different luciferase, can be monitored nearly simultaneously.
Viral enzyme herpes simplex virus type 1 (HSV1) thymidine kinase (TK) (HSV1-TK) is the most widely used reporter for radioisotopic imaging. Several highly specific substrates have been developed for both the wild-type enzyme (HSV1-TK) and the mutant enzyme (HSV1-sr39TK). The substrates 2′-deoxy-2′-18F-fluoro-5-iodo-1-β-d-arabinofuranosyluracil (18F-FIAU), 9-[4-18F-fluoro-3-(hydroxymethyl)butyl]guanine (18F-FHBG), 9-[(3-18F-fluoro-1-hydroxy-2-propoxy)methyl]guanine, 2′-18F-fluoro-5-ethyl-1-β-d-arabinofuranosyluracil (18F-FEAU), and 2′-deoxy-2′-18F-fluoro-5-methyl-1-β-d-arabinofuranosyluracil (41), labeled with either 124I (t1/2 = 4 d) or 18F (t1/2 = 110 min), diffuse into the cell, where they are phosphorylated and sequestered if the enzyme is present. Unbound tracer is excreted primarily through the urinary route, with hepatobiliary clearance for some tracers. Therefore, tracer clearance can result in high background in the abdominal area. These positron-emitting substrates are detected by a sensitive PET camera.
Another, less widely used PET reporter is the truncated dopamine (II) receptor, which binds to a ligand but does not transmit a signal inside the cell. Several 18F-labeled ligands, such as 3-(2-18F-fluoroethyl)spiperone (42), 18F-fluoroclebopride (43), and 18F-4-fluorobenzyltrozamicol (44), can detect the dopamine (II) receptor intracellularly and on the cell surface. Therefore, marked cell populations can be monitored by daily injections of 18F-labeled tracers and injections every 4 d with 124I-labeled tracers. The Na+/I− symporter is an integral plasma membrane glycoprotein that mediates the active transport of I−. Although the Na+/I− symporter gene has been used as a molecular imaging reporter for tumor cell lines (45), it has not been used for cell trafficking.
Radioisotopic emissions are not as attenuated by body mass and other factors as fluorescent signals and therefore have less depth limitation for signal detection. The background reactivity of labeled substrates with endogenous proteins is minimal, providing a high signal-to-noise ratio. Consequently, quantitative assessments of the numbers of cells present at a particular site can be made. The disadvantages of this approach are the high cost of tracer production and the need for an on-site cyclotron for the production of radiotracers with a short t1/2. Similar reporter gene strategies have been developed for MRI (20) but so far have not been used to track immune cell types.
INTRODUCTION OF REPORTER GENES
The indirect labeling of cell populations with reporter genes is accomplished by introducing DNA sequences encoding reporters into cells primarily by transfection or viral infection. Immune cells are largely recalcitrant to transfection with calcium phosphate buffers or lipid-based methods. Fortunately, infection of immune cells with retroviral vectors is reasonably efficient and is the current method of choice for the transduction of DCs and lymphocytes with foreign DNA encoding reporters.
Two types of retroviral vectors, Moloney murine leukemia virus–based retroviruses (46) and HIV-derived lentiviruses (47), are generally used for transduction, and each has its advantages and disadvantages. The use of murine retroviral vectors for gene delivery affords several advantages: DNA is incorporated into the genome of the infected cell by viral long terminal repeats (LTRs) and therefore is stable through successive cell divisions; gene expression directed by viral LTRs is strong; cells of hematopoietic origin can be infected fairly well, with reported marking levels ranging from 25% to 50% (48) of target cells; and expression from LTRs is constitutive and ubiquitous in all infected cells. However, transcription from LTRs can be shut off in vivo in cells of hematopoietic origin (49), limiting the length of time for which cells can be monitored.
The fairly recent use of self-inactivating lentiviral vectors (50) for gene delivery overcomes this disadvantage of retroviral vectors, because gene expression is driven from an internal nonviral promoter. The use of eukaryotic regulatory elements also allows control of the cell types in which the construct is expressed, permitting selective tracking of subsets within the cellular milieu. The expression of fluorescent, bioluminescent, radioisotopic, and double- and triple-fusion reporters in lentiviral vectors driven by ubiquitous and subset-restricted promoters has been shown. Lentiviral vectors also have a stronger tropism for human cells and therefore are ideal for transducing human cells for gene therapy and imaging. Rodent cell lines and primary cells can also be infected with lentiviruses, albeit with lower efficiency (51).
In preclinical models, homogeneous labeling of all target cells can be accomplished through the generation of transgenic mice where expression of the label is driven by either ubiquitous or cell type–specific promoters (52). Although this approach cannot be used in humans, cell sorting can yield a population of uniformly marked cells for clinical studies.
A potentially detrimental effect of retroviral or lentiviral infection of primary cells is the possibility of insertion mutagenesis resulting in aberrant gene expression and cell transformation. A small number of such adverse effects have been reported in the literature (53). The use of the HSV1-TK gene as an imaging reporter gene is a safeguard because it is also a suicide gene. Pharmacologic doses of ganciclovir are cytotoxic, and the targeted delivery of TK to cancer cells is a proven method of inducing cell death (54). Therefore, ganciclovir treatment is a safeguard against the unwanted proliferation of TK-marked cells.
VISUALIZING KINETICS OF ANTIGEN PRESENTATION
DCs are the professional APCs of the immune system and the cell type that initiates adaptive immune responses in vivo. Therefore, DCs are an attractive cell type for therapeutic manipulations, and antigen-loaded DCs are currently being tested for the treatment of cancer (55). A major requirement for DC function is migration from the site of the antigen to the draining lymph node, where interaction with T cells and initiation of a primary T-cell response take place. The ability to monitor DC migration into and out of tumors and lymph nodes is imperative for assessing the efficacy of therapeutic manipulations that attempt to augment DC function. Furthermore, the route of DC administration (intravenous, intraperitoneal, or intradermal) significantly affects localization and function (26).
DC migration has been demonstrated in animal models by bioluminescent imaging and MRI. In one study, DCs were expanded ex vivo and retrovirally transduced with luciferase and GFP. After adoptive transfer, the labeled DCs were detected in various lymphoid organs, indicating that DCs expanded ex vivo can migrate efficiently and persist for extended periods in vivo (56). Similarly, bone marrow–derived DCs labeled with SPIOs were detected in draining lymph nodes by MRI at 24 h after transfer (26). In another study, DCs labeled with perfluoropolyether were selectively tracked by 19F MRI at 8 h after transfer (25). An anatomic context was provided by overlay of a conventional T2-weighted 1H image. All of these studies also showed that DC viability and phenotype, at least in vitro, were unaffected by the labeling techniques.
MRI provides high resolution and anatomic detail. DCs can be labeled with SPIOs or CLIOs either by receptor-mediated endocytosis of particles coupled to specific antibodies, such as anti-CD11c (a DC cell surface marker), or by nonspecific phagocytosis of particles. There is very little loss of function or viability as a result of label uptake, making this method a viable option for clinical use. It was recently shown that SPIO-labeled DCs injected intranodally into patients with stage III melanoma could be detected by MRI (27). That study demonstrated that although the injections were done under ultrasound guidance, in more than one half of the patients, the cells were deposited into the fatty tissue surrounding the lymph node instead of within the node itself (Fig. 4). In that situation, the use of imaging provided a possible explanation for the variability of the T-cell responses observed in these patients. Because SPIOs are lost on cell division, imaging is limited to the length of time for which the label is retained, usually days to weeks. However, because adoptively transferred DCs are not a highly proliferative population in vivo, the half-life of the direct label is not a prohibitive limitation to the use of this method in patients.
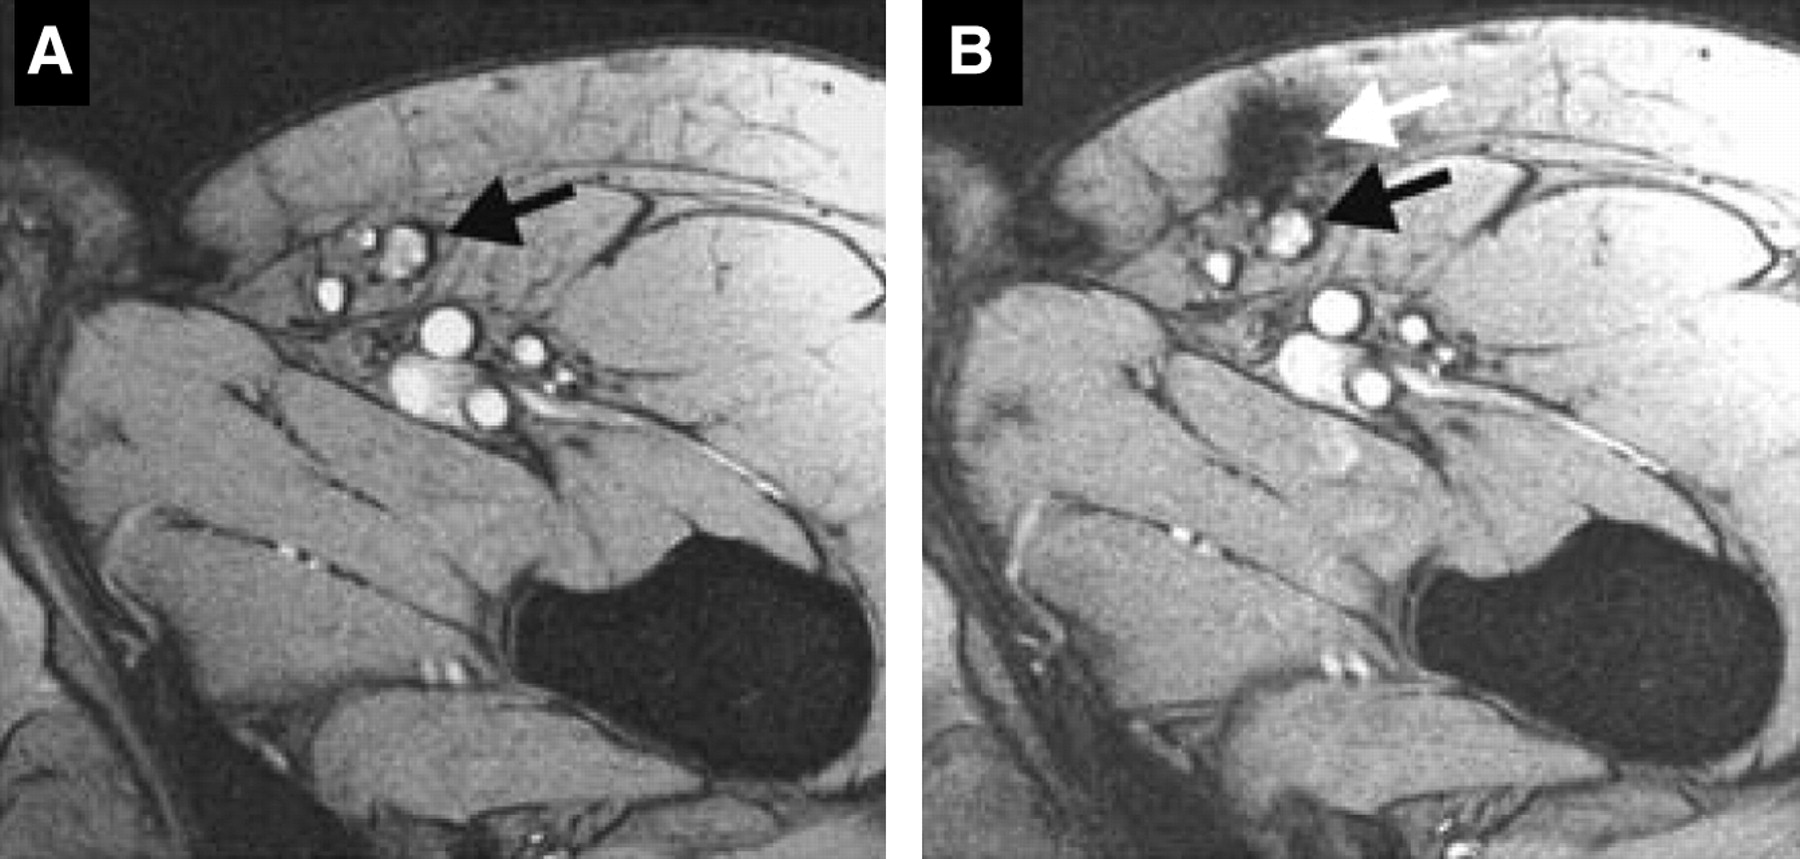
MRI for determination of accurate delivery of therapeutic injections of DCs. Ultrasound-guided injections of SPIO-labeled DCs intended to be intranodal were detected in surrounding fatty tissue by MRI. This study is example of clinical use of molecular imaging to assess therapeutic efficacy. Black arrows denote lymph node (A). White arrow indicates location of injected DCs in surrounding fatty tissue (B). (Reprinted with permission of (27).)
To date, PET imaging of DCs has been done with N-succinimidyl-4-18F-fluorobenzoate (57) and 64Cu-PTSM (58), both of which are nonspecifically taken up and retained in the cytoplasm and allow imaging for a few hours to a few days. Transduction of DCs with the HSV1-TK reporter gene would allow permanent marking of the cells; however, this process has not yet been demonstrated. For a detailed review of recent advances in the noninvasive imaging of DCs, please see Baumjohann et al. (26).
TRAFFICKING AND LOCALIZATION OF EFFECTOR CELLS
Immunotherapy for the treatment of cancer faces many hurdles (59), including identification and targeting of tumor antigens capable of eliciting a strong response with long-lasting memory; activation and amplification of adequate numbers of effector cells that can migrate to the tumor site; and counteraction of the inhibitory mechanisms that are initiated by the tumor and the immune system and that prevent tumor regression. For both passive immunotherapy and active immunotherapy, if an objective clinical response is observed, then the results of the treatment are clear. In the majority of cases, at best, only a partial response is achieved, and it is unclear whether the effector cells reached the tumor site, how long they were present there, and whether they had functional activity at the tumor site.
Both direct and indirect labeling methods have been used to track the migration of T lymphocytes in vivo. Since the 1980s, 99Tc-HMPAO (21), 111In-oxine (60), and 18F-FDG (34) have been used to monitor the trafficking of immune cell subsets. More recently, the trafficking of murine lymphocytes labeled ex vivo with 64Cu-PTSM was also reported (24). The length of time for which cells can be monitored is limited to the half-life of the label and is on the order of several hours to several days.
Longer-term tracking of lymphocyte movement has been reported with both SPIOs and highly derivatized CLIOs and MRI (30,31). The spontaneous uptake of MRI contrast agents such as SPIOs by lymphocytes is a generally inefficient process. Therefore, the sensitivity of MRI for lymphocytes is limited by the efficiency of cell labeling. Uptake is improved 100-fold by modifications such as the addition of HIV type 1 Tat peptide sequences, which target the particles to lymphocytes, and 200-fold by the use of highly derivatized CLIOs (31). The adoptive transfer of murine CD8+ T cells labeled with highly derivatized CLIOs demonstrated the 3-dimensional and heterogeneous distribution of lymphocytes within tumors (31). In other experiments with animal models, anionic maghemite nanoparticles were used to track the localization of antigen-specific T cells to tumors (30). The high-resolution and anatomic information obtained makes MRI an ideal imaging modality for tracking antitumor immune responses. However, the hallmark of an effective immune response is the proliferation and amplification of antigen-specific cells. Consequently, the contrast agent is diluted by cell division, limiting the window for imaging to several days at best. The future development of better MRI reporter gene strategies may overcome this limitation.
Indirect labeling methods that introduce a reporter gene into lymphocytes permit the permanent marking and tracking of T lymphocytes during the progress of an immune response. To date, this approach has been used only in preclinical models of T-cell localization to tumors.
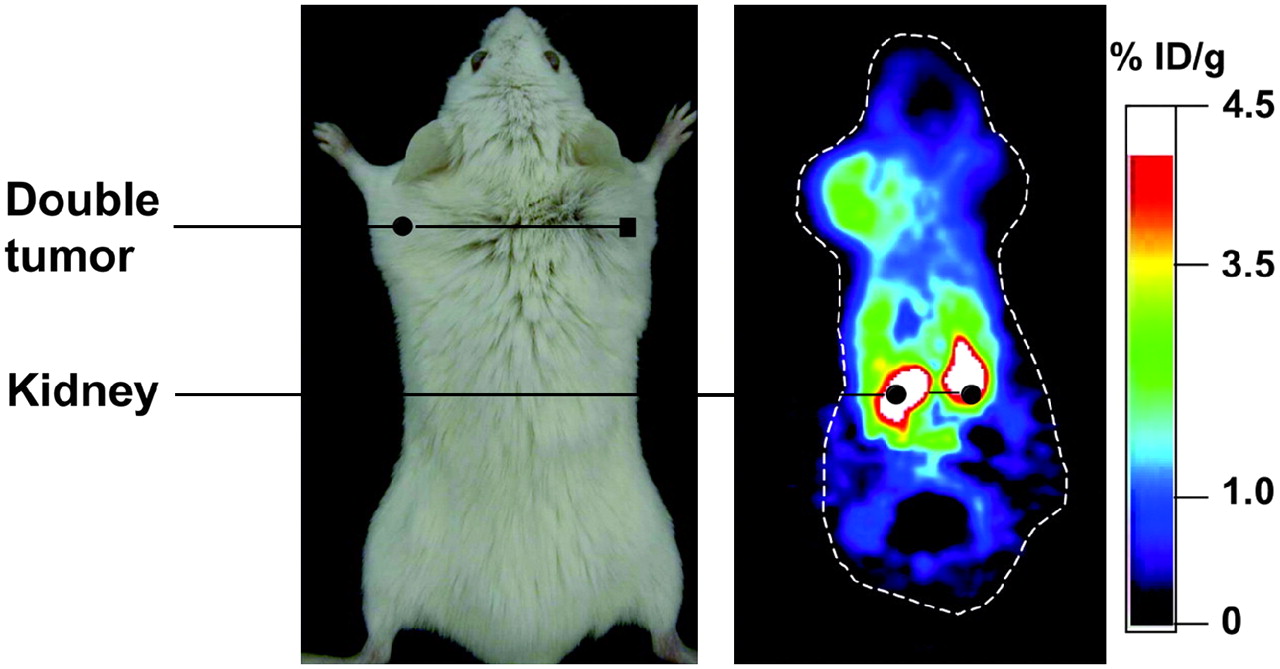
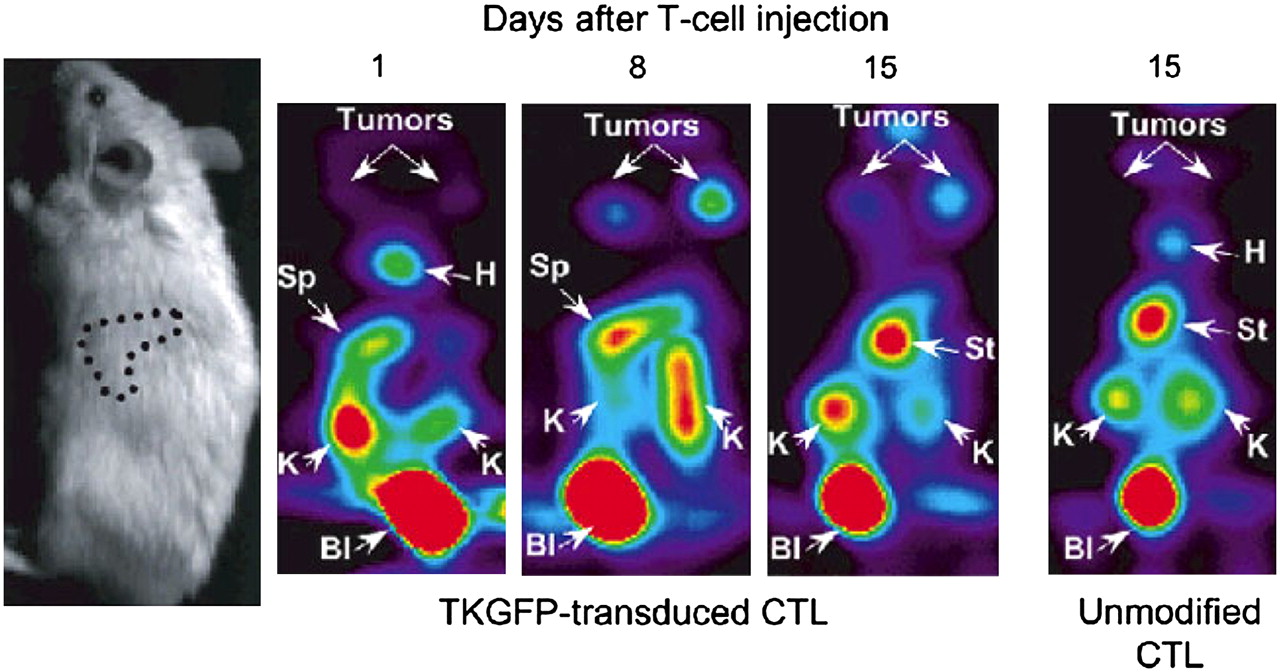
In the first studies that demonstrated the utility of reporter gene strategies for monitoring T-cell antitumor responses, adoptive transfer models were used. In one study, the HSV1-sr39TK reporter gene was transduced into primary splenic T cells by retroviral infection. Labeled cells were adoptively transferred into tumor-bearing mice, and the antigen-specific localization of marked cells to the tumor site was visualized with the tracer 18F-FHBG and imaging with a small-animal PET camera (Fig. 5) (61). In this system, T cells could be monitored for more than 2 wk, until the animals succumbed to the tumor burden. In another study, human Epstein-Barr virus (EBV)–specific T lymphocytes were labeled with the TK reporter gene and adoptively transferred into SCID mice bearing EBV-positive tumors (62). With small-animal PET imaging and scintigraphy, the selective localization of labeled cells to antigen-specific tumors was visualized with the PET tracers 124I-FIAU and 131I-FIAU, respectively (Fig. 6). In another study, transgenic murine T cells specific for ovalbumin were labeled with the HSV1-sr39TK gene (63). Faster kinetics of memory T-cell localization and tumor elimination were demonstrated by small-animal PET imaging. In a slightly different approach, the trafficking of adoptively transferred T cells to tumors was monitored by injection of mice with anti-Thy1.2 antibody conjugated to 1,4,7,10-tetraazacyclododecane-N,N′,N″,N″′-tetraacetic acid and radiolabeled with 64Cu (64). Small-animal PET imaging demonstrated T-cell localization to tumors and major secondary lymphoid organs. Together, these studies demonstrated that PET is a highly sensitive imaging modality that is useful for monitoring cellular immune responses longitudinally within the same animal.

Localization of antigen-specific T cells visualized by small-animal PET. T cells from immunized mice were labeled with HSV1-sr39TK and adoptively transferred into animal bearing antigen-positive tumor (left) and antigen-negative tumor (right). Trafficking of T cells to antigen-positive tumor was detected by injection of 18F-FHBG and small-animal PET. % ID/g = percentage injected dose per gram. (Reprinted with permission of (61).)

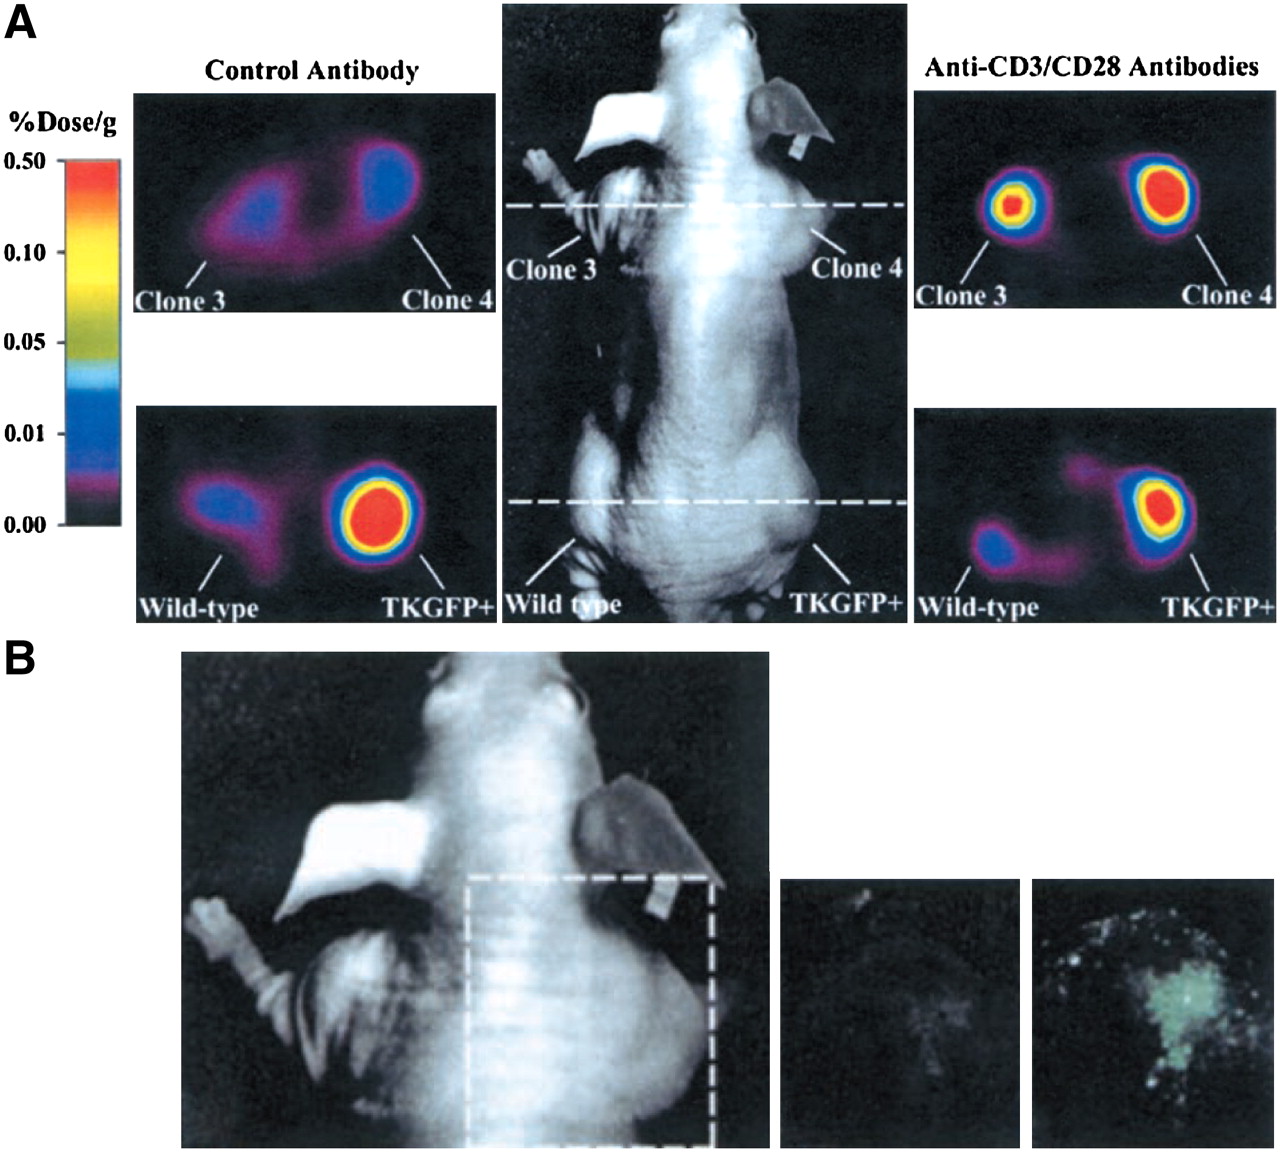
Trafficking of EBV-specific T lymphocytes marked with TK–GFP. Human T lymphocytes transduced with HSV1-TK–GFP fusion protein were adoptively transferred into animals bearing EBV-positive tumors. T-cell localization was detected with tracer 124I-FIAU and small-animal PET imaging. B = bladder; H = heart; K = kidney; S = spleen; St = stomach. (Reprinted with permission of (62).)
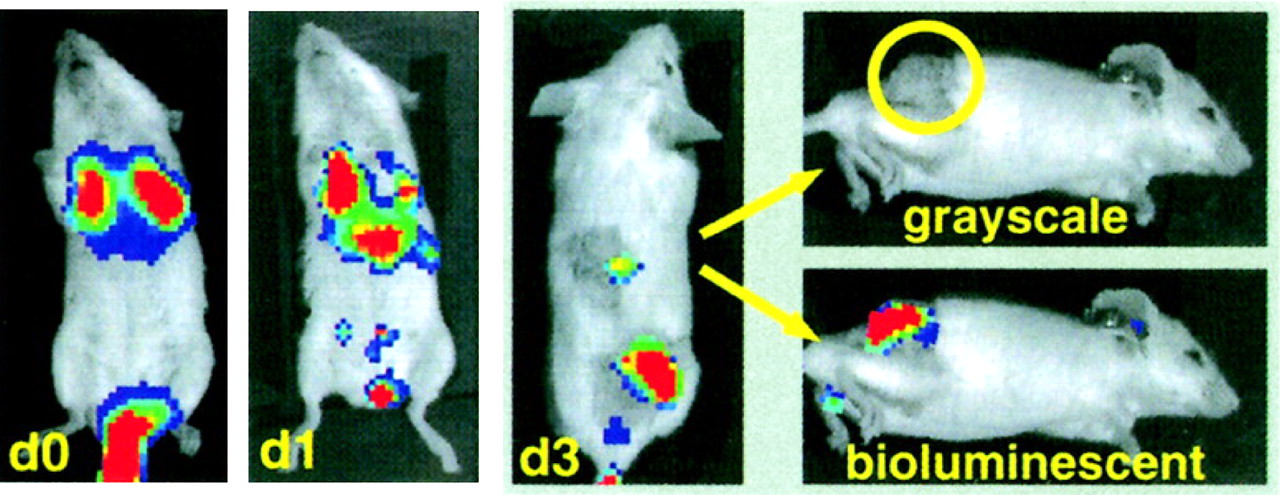
Effector cell localization has also been demonstrated by bioluminescent imaging. One study reported the homing of adoptively transferred, retrovirally transduced, cytokine-induced killer cells, in which the preferential localization of cytokine-induced killer cells to tumors preceded rapid tumor regression (Fig. 7) (65). Bioluminescent imaging has also been used to monitor the localization of T cells specific for the human papillomavirus E7 protein. E7-specific T cells were infected with a retrovirus expressing firefly luciferase. Increased localization of T cells to E7-positive tumors was detected after vaccination with E7-expressing vaccinia virus (66). Fluorescent imaging has not been widely used to study lymphocyte movement noninvasively in vivo, perhaps because of the low tissue penetration of the signal. In a recent study, a transgenic mouse model in which GFP was expressed in all T cells was used, and GFP-expressing lymphoid organs were detected in 3 dimensions with a noncontact fluorescent tomography system; these results suggested that noninvasive fluorescent imaging of lymphocytes is possible with sufficient levels of marked cells (67).

Trafficking of cytokine-induced killer cells to tumor site, as revealed by bioluminescent imaging. Luciferase-expressing cytokine-induced killer cells were isolated and transferred into mice bearing palpable subcutaneous A20 tumors. Marked cells were detected primarily at tumor site as early as 3 d (d3) after adoptive transfer. (Reprinted with permission of (65).)
The researchers in the aforementioned studies used immune splenocytes or antigen-specific T-cell lines that mounted a secondary immune response on adoptive transfer into the tumor-bearing host. This method can be applied to track the fate of human T cells that are expanded in vitro with tumor antigens and adoptively transferred back into the patient, the so-called passive immunotherapy approach. The reporter gene can be transduced into lymphocytes during the in vitro expansion period.
In contrast, the active immunotherapy approach attempts to immunize the tumor-bearing host with antigens that generate effector cells with long-lasting immunologic memory to the immunizing antigens. In this approach, a naive lymphocyte, or its progenitor, must be marked with an imaging reporter gene to allow monitoring of the progression of a primary immune response to a secondary immune response. The earliest study examined the kinetics of engraftment of human CD34+ lymphoid progenitor cells adoptively transferred into NOD/SCID/β2m null mice with the firefly luciferase gene as a reporter gene (68). In subsequent studies, syngeneic murine bone marrow stem or progenitor cells were marked with either PET (69) or optical (70) imaging reporter genes. The kinetics and sites of engraftment of the transplanted bone marrow were visualized during immune reconstitution of the recipient mice. In another study, both bioluminescent imaging and PET imaging were used to monitor transferred cells. Importantly, the reconstituted immune system in these mice was equivalent to that in nonmanipulated animals, and marked mice mounted a normal primary antitumor immune response (71). Theoretically, in these animals, the kinetics of localization of reactivated memory cells to sites of late-arising metastatic disease could be visualized, although this process has not yet been demonstrated.
Allogeneic bone marrow transplants are currently the only treatment for life-threatening hematologic malignancies (72). Years of optimization of this process have yielded protocols that avoid graft-versus-host responses but allow efficacious graft-versus-leukemia effects in clinical settings (73). Preclinical studies have shown that changing the composition of the donor cell population can often make the treatment more effective. The inclusion of regulatory T cells in the bone marrow bolus resulted in decreased graft-versus-host responses while maintaining graft-versus-tumor effects (74). The trafficking and expansion of regulatory T cells were observed in a murine model system with bioluminescent imaging (75). Regulatory T cells were isolated from the spleen and lymph nodes of luciferase-expressing transgenic mice. The adoptive transfer of labeled regulatory T lymphocytes along with conventional CD8+ and CD4+ T cells resulted in reduced incidence and severity of graft-versus-host disease. The localization and expansion of the regulatory T-lymphocyte population in secondary lymphoid organs were monitored with bioluminescent imaging. The ability to mark bone marrow cells with imaging reporter genes would provide a means for physicians to detect the accumulation of transplanted cells within normal organs. The prevention of a potentially lethal graft-versus-host response is critical for achieving a graft-versus-tumor effect.
COMPENSATING FOR LIMITATIONS OF INDIVIDUAL IMAGING TECHNIQUES WITH MULTIMODALITY IMAGING
Each of the imaging modalities described so far has inherent limitations that prevent any of them from meeting all of the aforementioned criteria for a clinical imaging agent. A means of compensating for individual limitations is the concurrent use of more than one imaging modality to investigate the biologic question. Such multimodality imaging has been elegantly demonstrated in mouse models of immunotherapy.
The development of fusion reporter genes that incorporate optical and PET imaging reporter genes on the same piece of DNA is a recent advance in molecular imaging. Dual- and triple-fusion reporter genes permit the marking of cells with fluorescent proteins, such as GFP and red fluorescent protein, for the analysis of cells by flow cytometry; firefly or Renilla luciferase for the tracking of cells with bioluminescent imaging; and PET reporters, such as HSV1-TK variants, for monitoring cells by small-animal PET imaging (76–80). The inclusion of fluorescent reporters permits determination of the proportion of cells that are labeled and allows for the sorting of a homogeneous population of cells. Bioluminescent imaging detects signals close to the surface of the skin with high sensitivity, whereas small-animal PET imaging permits the detection of small areas of signals within deep tissues and provides tomographic information on the locations of cells of interest. A study in which murine bone marrow was labeled with a triple-fusion reporter gene demonstrated excellent correlation between the signals captured by bioluminescent imaging and by small-animal PET imaging (81); these results suggested that nearly simultaneous imaging of the same animals with luminescent and radioisotopic tracers has the potential to provide more comprehensive information than imaging with a single modality alone.
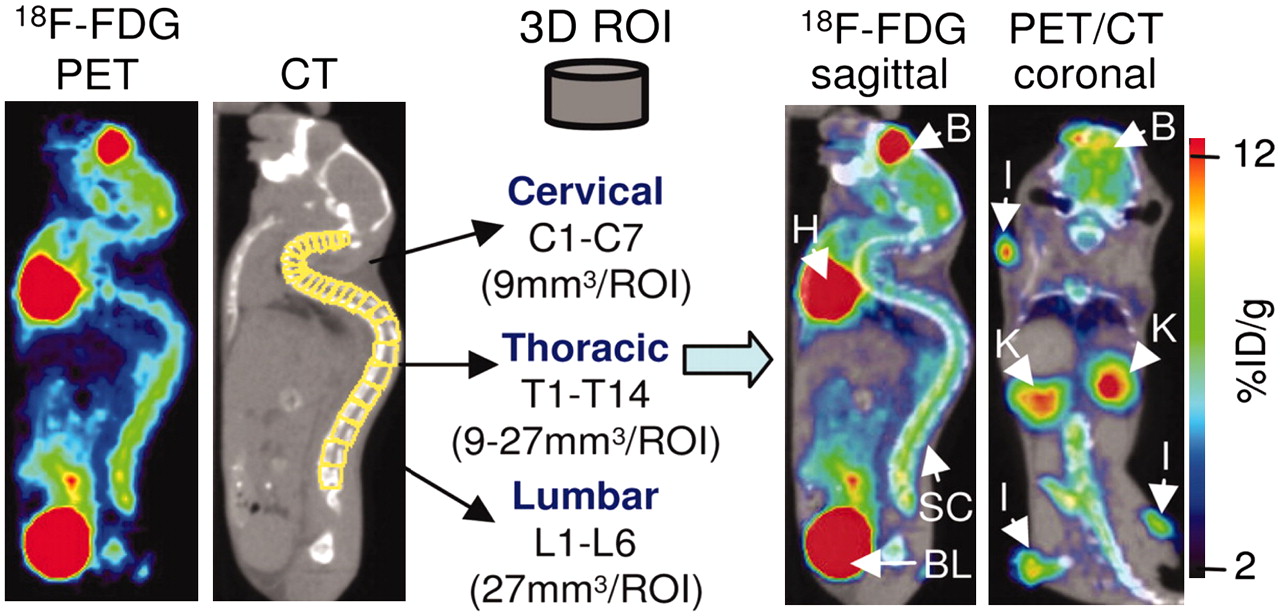
A limitation of optical and radioisotopic tracking of cell populations is the lack of anatomic information. Recent studies have incorporated modalities, such as MRI and CT, that provide structural information, allowing organ-specific detection of the cell signal. In a recent study of an experimental model of autoimmune encephalomyelitis, small-animal PET imaging of mice with 18F-FDG followed by small-animal CT imaging of the same animals localized areas of inflammation to specific segments of the spinal column (Fig. 8) (82). Therefore, the relatively low spatial resolution of the small-animal PET scanner was compensated for by the high-resolution morphologic CT scanner, providing coregistered images that localized the PET signals to specific anatomic structures. In another recent study, SPECT/CT was used to assess the efficacy of 111In-oxine–labeled CTLs in controlling tumor growth in vivo (83). The CTLs were imaged with high sensitivity; CT provided 3-dimensional information on tissue density and distribution. Similarly, the kinetics of bone marrow engraftment were visualized by bioluminescent imaging and PET imaging, with registration of the sites of engraftment to the skeleton being provided by CT (71). Such dual- and triple-modality experiments can be performed with 2 different scanners provided that the animal is maintained in the same position for each scan. However, in recognition of the power of multimodality imaging, second-generation hybrid scanners, such as PET/CT and SPECT/CT scanners, are now commercially available; these scanners allow both anatomic and radioisotopic images to be obtained in quick succession (84–86). Therefore, coregistration of the images is very precise. Hybrid instruments that combine optical and radioisotopic methods are also under development (87).

Dual-modality imaging provides anatomic localization of PET signals. In murine model of experimental autoimmune encephalomyelitis, investigators used PET/CT to localize areas of inflammation to specific regions of vertebrae. Visualization of vertebrae by small-animal CT allowed quantification of inflammation detected by 18F-FDG PET in cervical, thoracic, and lumbar regions. B = brain; BL = bladder; H = heart; K = kidney; l = lymph node; %ID/g = percentage injected dose per gram; ROI = region of interest; SC = spinal column; 3D = 3-dimensional. (Reprinted with permission of (82).)
QUANTIFICATION OF CELL NUMBERS AT SITE OF INTEREST AND LIMIT OF DETECTION
A critical question regarding cell trafficking is the limit of detection. An important application of imaging in cancer immunology is the ability to use marked T cells as probes for the detection of minimal residual disease and small areas of metastases sooner than they can be detected by more conventional methods. Therefore, the ability to visualize small numbers of cells becomes critical, and sufficient numbers of target cells must be marked with a reporter gene that has a high level of expression in individual cells. Another important consideration is the heterogeneity of the population to be imaged. Several preclinical studies monitored the trafficking and localization of transgenic T cells to areas of a tumor. Transgenic T cells were used because all of the cells were specific for the tumor antigen and should have been capable of homing to the tumor, thereby attempting to eliminate the tumor through the sheer number of effector cells. In this situation, marking a small proportion of cells may be sufficient because the images obtained from these few cells should be representative of the whole population.
When a heterogeneous population, such as normal peripheral blood lymphocytes or splenocytes or bone marrow cells, is used for therapy, the number of cells specific for the antigen, no matter how strong the specificity, may be as few as 1 in 200,000 cells in the population (88). Therefore, marking of a larger proportion of the population becomes critical.
Quantification of the number of cells at a site of interest has been done for imaging modalities that provide tomographic information and requires knowledge of the number of cells marked with the reporter gene. It has been estimated with MRI that as few as 500–1,000 cells per cubic millimeter of DCs labeled with 25 pg of Fe per cell can be detected (28). With PET, the threshold of detection of T cells with 18F-FHBG as the tracer has been estimated to be 106 cells per 0.3 mL (89). Several factors can affect the accuracy of this calculation; these include the strength of the promoter used to drive the reporter gene, the number of copies of the vector per cell, the site of integration, and the background reactivity of the probe with the mammalian counterpart of the reporter gene.
For optical imaging modalities, the number of cells that express the reporter gene can be determined in several ways. First, for fluorescent imaging with molecules such as GFP, expression can be detected by flow cytometry of isolated cell populations or microscopy of tissue sections. Although bioluminescent signals are not easily detected at the single-cell level, many imaging constructs contain both luciferase and fluorescent molecules. The 2 genes can be fused, but the activities of the separate genes are attenuated in the fusion protein, resulting in a weaker signal in each modality. To circumvent this problem, genes can be separated by including internal ribosome entry sites, ribosome slippage sites, and flexible linkers or by creating a bicistronic message (90). When the proportion of cells marked is known, the photons emitted by a known number of cells in vivo can be determined and used to estimate the number of cells present in a region of interest.
BALANCING CELL MARKING WITH POTENTIAL TOXICITY AND IMMUNOGENICITY
A caveat of marking cells, either directly or indirectly, with imaging agents is the potential toxicity of the labeling method. It is important to consider the effect of radiation dose on cells of hematopoietic origin, which are relatively radiation sensitive. To address this question, biodistribution and dosimetry studies of radiotracers for PET of cells marked with HSV1-TK were conducted. Studies of lymphocytes labeled in vitro with 131I-FIAU demonstrated no apparent loss of function with a median nuclear absorbed dose of 830 cGy (91). Dosimetry studies of 18F-FIAU in dogs (92) and 18F-FHBG in humans (93) suggested that the amount of radioactivity required for imaging does not significantly compromise organ function. Likewise, studies in mice showed that PET of adoptively transferred bone marrow does not impair the function of the resulting reconstituted lymphocytes, because the mice rejected a tumor challenge with kinetics similar to those of wild-type mice (71). In these studies, the dose of radiation delivered over multiple scans did not significantly impair immune function.
Another issue to consider is the immunogenicity of reporter genes. Gene products such as GFP, luciferase, and HSV1-TK are foreign proteins and have the potential to be recognized by the immune system, leading to the destruction of the labeled cells. Immune responses to optical (94–96) and PET (97,98) imaging reporter genes were reported in immunocompetent animals. The expression of GFP in tumor cell lines slowed tumor growth, and GFP- and luciferase-expressing skin grafts were rejected by immunocompetent rats.
The immunogenicity of reporter genes has also been reported in human patients. Potent immune responses were observed in HIV-positive patients infused repeatedly with CD8+ T cells expressing a hygromycin–TK fusion gene (97). Memory was generated, and the survival of the cells was decreased to less than 1 d by the fourth exposure. In addition, patients who received hematopoietic stem cell transplantation developed anti–HSV1-TK–specific CTLs. However, these CTLs were only observed in immunocompetent patients, suggesting that in immunocompromised individuals, such as cancer patients, HSV1-TK–positive cells may persist for a longer period. Therefore, HSV1-TK reporter gene imaging remains a promising option (98).
An approach to preventing detrimental immune responses in humans is the use of humanized variants of reporter genes, such as the TK gene. This approach reduces immunogenicity, minimizing the likelihood of rejection of marked cells. PET of tumor xenografts with a human-derived mitochondrial TK type 2 reporter gene and the tracers 124I-FIAU and 18F-FEAU was recently described (99). Several cell surface receptors and transporters derived from humans have been used for nuclear imaging but may have lower sensitivity than TK-based imaging strategies (100–105).
IMAGING THE ACTIVATION STATUS OF IMMUNE CELLS
The combined activities of different subsets of immune cells determine whether a tumor will be rejected. Therefore, it is also important to monitor the ebb and flow of individual lymphocyte subsets from the tumor site. The imaging studies described so far detected the presence of cells at the tumor site. Functional activity was implied if there was a reduction in tumor burden or tumor rejection. However, these studies could not determine the proportion and subset of cells in the population that contributed to this outcome. To devise more effective treatments, it is extremely important to monitor cell function in situations in which a tumor does not regress. To accomplish this goal, reporter gene constructs whose expression is modulated in response to the activation status of the cells of interest are needed.
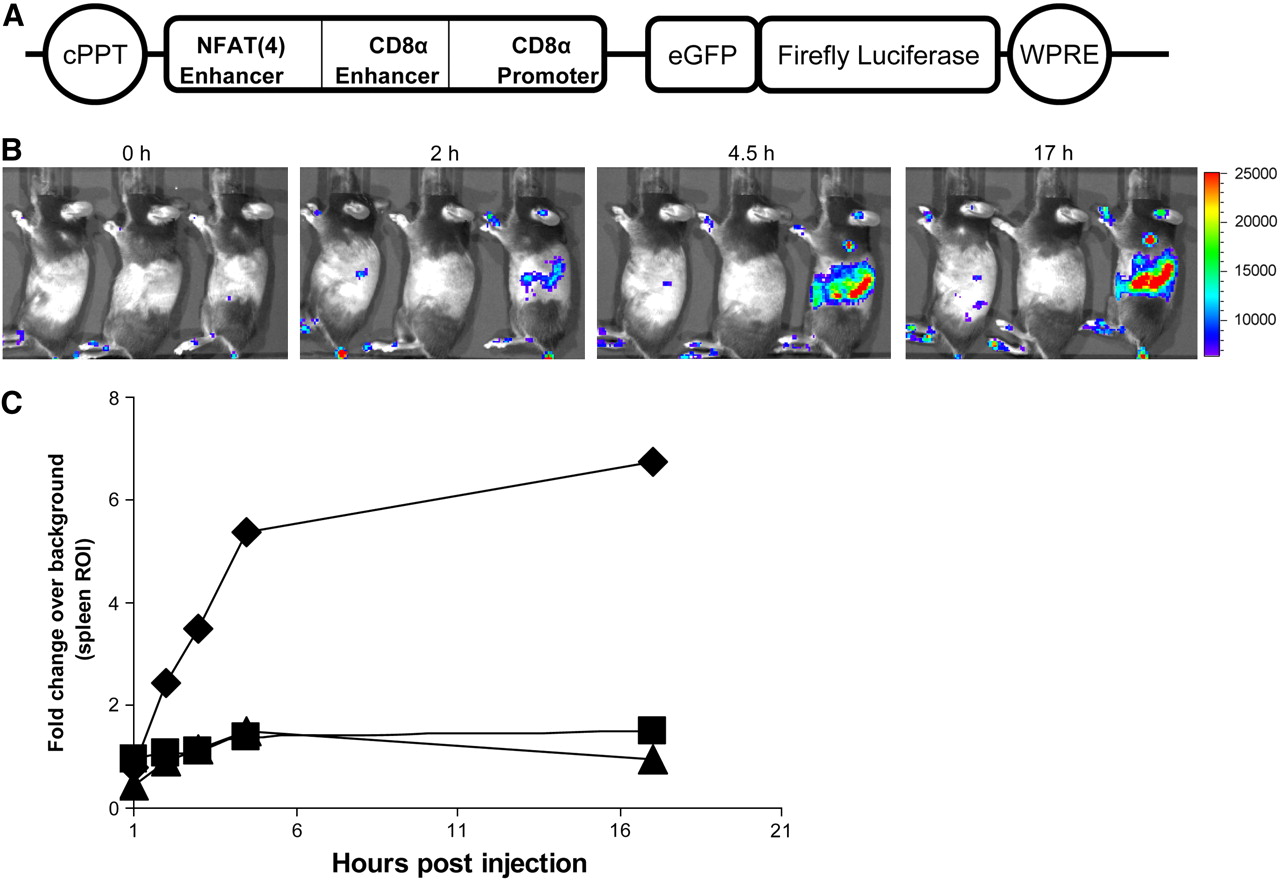
A key question regarding immunotherapy is whether the cells detected at the tumor site are functional. One study addressed this question by placing GFP and HSV1-TK under the control of the NF-AT (nuclear factor of activated T cells) enhancer element (106). The transcription factor NF-AT is expressed early after T-cell activation and binds to the upstream regions of several genes, which in turn are expressed in activated T cells (107). TK expression was detected only after antibody triggering of a T-cell tumor that was transduced with this construct (Fig. 9) (106). When we constructed and used a similar construct for bioluminescent imaging, firefly luciferase expression was detected after the injection of marked animals with anti-CD3 antibody (Fig. 10). This approach is useful for studying T-cell signaling effects that occur early, when a specific population of T cells can be marked with a reporter gene.
Monitoring of T-cell activation in vivo. Human T-cell tumor (Jurkat) transduced with NF-AT–inducible construct shows strong upregulation of HSV1-TK and GFP after stimulation with anti-CD3 and anti-CD28 antibodies. (A) Small-animal PET imaging with 124I-FIAU after injection of anti-CD3/anti-CD28 antibodies. (B) Fluorescent imaging for detection of GFP after injection of anti-CD3/anti-CD28 antibodies. (Adapted from (106) and reprinted with permission of (106).)

Activation-dependent expression of firefly luciferase in primary murine splenocytes. (A) Bone marrow from C57BL/6 mice was infected with lentivirus driving expression of GFP–Luc fusion reporter under control of NF-AT enhancer element. Bone marrow cells were then transferred to lethally irradiated syngeneic mice. (B) After reconstitution, mice were injected with activating anti-CD3 or control antibody. All animals were injected intraperitoneally with d-luciferin at 150 mg/kg and, after 15 min of uptake, were imaged with IVIS100 system (Xenogen) (left mouse, no antibody; middle mouse, control hamster antibody; right mouse, anti-CD3 antibody). In mice injected with activating anti-CD3 antibody, strong signal from area corresponding to spleen was detected beginning 2 h after antibody treatment. (C) Regions of interest (ROI) encompassing spleen area were quantified with Living Image software (Xenogen). Fold change over background was calculated by dividing ROI at each time point by background ROI at time zero (triangle, animal on left; square, animal in the middle; diamond, animal on the right) (Elizabeth J. Akins, M. Moore, and P. Dubey, unpublished data, January 2007). CD8α = α-chain of CD8 molecule; cPPT = central polypurine tract; eGFP = enhanced GFP; NFAT(4) = nuclear factor of activated T-cells; WPRE = woodchuck hepatitis posttranscriptional regulatory element.
Activated T cells secrete cytokines, such as interleukin 2 (IL-2) and interleukin 12 (IL-12), that cause cell proliferation and that are markers of cell function. One of the earliest adoptive transfer immunotherapeutic strategies for the treatment of cancer was the systemic delivery of IL-2 (108). 123I- and 99Tc-labeled IL-2 was used in patients in the 1980s to diagnose chronic inflammation and evaluate the extent of autoimmune diseases (109,110). The synthesis of 99Tc-labeled IL-12 and biodistribution in a mouse model of colitis were recently described (111). This reagent can be used for detecting T cells and natural killer cells that have upregulated the expression of the IL-12 receptor in an immune response.
TARGETING REPORTER GENE EXPRESSION TO SPECIFIC CELL SUBSETS
The design of tissue-specific reporter gene constructs is a challenging task. One reason for this is that cells from the same or closely related lineages often express many of the same proteins. For example, a major population of DCs express the cell surface marker CD11c constitutively (112). The expression of imaging reporter genes driven by the CD11c promoter would permit tracking of this population of cells. However, this marker is also expressed by CD8+ intraepithelial lymphocytes and activated T cells within lymph nodes (113). Likewise, T-cell subsets are distinguished by the surface expression of CD8 on cytotoxic cells and CD4 on helper cells. The regulatory elements that control the expression of CD8 and CD4 have been extensively characterized in transgenic mice (114). In fact, CD4 regulatory elements have been used in a lentivirus vector to express GFP in human peripheral blood cells (51). The expression of GFP was found largely in CD4+ cells, with some leakiness in B cells and other cell types. Regulatory T cells express the intracellular protein FoxP3 (115). The expression of reporter genes under the control of the FoxP3 regulatory elements will permit subsequent imaging studies to modulate the function of regulatory T cells for the treatment of autoimmunity and cancer. Recently, the control regions for the human FoxP3 gene were described (116).
Regulatory elements for other intracellular proteins specific for lymphocyte subsets have been identified and used in transgenic mouse systems for the tissue-specific expression of Cre recombinase and imaging reporter genes (117). Theoretically, the use of these regulatory elements to couple the expression of optical or PET imaging reporter genes to that of subset-specific transcription factors (118), signaling molecules such as lck (119), cytolytic granule contents such as perforin (120) and granzymes (121), or effector cell cytokines (122) such as interferon-γ and interleukins (123,124) to monitor various stages of T-cell activation is possible (Fig. 11). The development of luciferase–antibody fusions makes it possible to image cell populations on the basis of cell surface marker expression (125). Another recent article reported the dual labeling of an antibody with a PET radioisotope and a fluorescent probe (126). Although these approaches have not yet been applied to markers of T-cell activation and degranulation, such as CD69 or LAMP1 and LAMP2, they present an interesting prospect.

Challenge of making cell subset–specific reporter constructs for imaging of T cells. T cells express genes at various specificities. Although some genes are predominantly expressed on specific subsets of cells, others are expressed more widely. Indirect imaging labels can be targeted to cells via regulatory elements of tissue-specific genes, such as cytokines (blue), intracellular signaling molecules (yellow), cell surface proteins, or effector cell proteins (pink). DNA response elements for transcription factors (green) can drive transcription of reporter genes. Cells can also be labeled directly with labeled antibodies or receptor ligands. Cell localization can be monitored by labeling constitutively expressed factors, and activation status can be monitored by marking inducible factors. IFN-γ = interferon-γ; LCK = lck (signaling molecule); TCR = T-cell receptor.
To restrict reporter gene expression to a particular subset or activation state, the cis regulatory elements that control the expression of the marker must be well defined. A limited amount of DNA can be placed between the LTRs and packaged in the viral vector. In addition, the viral titer and subsequent infectivity of target cells decrease with increasing genome size. Therefore, the control elements and reporter genes together should not be larger than 5–6 kilobases. Recent reports demonstrated that the expression of some markers of T-cell function, such as perforin and γ-interferon, is regulated by large locus control regions that can span more than 100 kilobases (127). The removal of promoters and enhancers from this genomic context may eliminate the specificity of expression. Therefore, designing imaging reporter genes that are expressed in specific subsets to monitor cell function is a challenging task that requires creative solutions.
CONCLUSION
With advances in the understanding of gene regulation, tracer chemistry, and imaging hardware, many exciting possibilities are becoming available for the imaging of immune cell localization and function. Work over the last decade has resulted in efficient methods for labeling cells of interest and highly specific probes for detecting the cells. In recognition of the need for the anatomic localization of signals, equipment with multimodality imaging capabilities is in use and under further development. The challenge now facing imaging scientists, immunologists, and physicians is to translate the advances made in preclinical studies to clinical settings. Immunotherapy approaches are likely to be most effective as adjuvant therapy for residual disease and for the treatment of late-arising metastases. In such cases, labeled immune cells may serve as probes for the detection of small areas of cancer. To visualize very small numbers of labeled cells, the ideal clinical imaging strategy will mark a specific subset of immune cells whose activation status can be monitored over time, with precise 3-dimensional anatomic localization of signals. To this end, some recent studies in human patients have incorporated nuclear imaging as part of the clinical trial design (128,129). It remains to be demonstrated whether human effector cells with tumoricidal properties in vivo can be efficiently marked with imaging reporter genes. Molecular imaging techniques will have the potential to regularly contribute to patient care only when it is possible to monitor the waxing and waning of cell numbers and functions in human patients over days, months, or years.
Acknowledgments
We thank Dr. Mark Willingham for critical review of the article. This work was supported by NIH grant R21 CA124457 and by NIH training grant T32GM063485.
Footnotes
-
COPYRIGHT © 2008 by the Society of Nuclear Medicine, Inc.
References
- 1.↵
- 2.↵
- 3.↵
- 4.↵
- 5.
- 6.
- 7.↵
- 8.↵
- 9.↵
- 10.
- 11.↵
- 12.↵
- 13.↵
- 14.↵
- 15.↵
- 16.↵
- 17.↵
- 18.↵
- 19.↵
- 20.↵
- 21.↵
- 22.↵
- 23.↵
- 24.↵
- 25.↵
- 26.↵
- 27.↵
- 28.↵
- 29.↵
- 30.↵
- 31.↵
- 32.↵
- 33.↵
- 34.↵
- 35.↵
- 36.↵
- 37.↵
- 38.↵
- 39.↵
- 40.↵
- 41.↵
- 42.↵
- 43.↵
- 44.↵
- 45.↵
- 46.↵
- 47.↵
- 48.↵
- 49.↵
- 50.↵
- 51.↵
- 52.↵
- 53.↵
- 54.↵
- 55.↵
- 56.↵
- 57.↵
- 58.↵
- 59.↵
- 60.↵
- 61.↵
- 62.↵
- 63.↵
- 64.↵
- 65.↵
- 66.↵
- 67.↵
- 68.↵
- 69.↵
- 70.↵
- 71.↵
- 72.↵
- 73.↵
- 74.↵
- 75.↵
- 76.↵
- 77.
- 78.
- 79.
- 80.↵
- 81.↵
- 82.↵
- 83.↵
- 84.↵
- 85.
- 86.↵
- 87.↵
- 88.↵
- 89.↵
- 90.↵
- 91.↵
- 92.↵
- 93.↵
- 94.↵
- 95.
- 96.↵
- 97.↵
- 98.↵
- 99.↵
- 100.↵
- 101.
- 102.
- 103.
- 104.
- 105.↵
- 106.↵
- 107.↵
- 108.↵
- 109.↵
- 110.↵
- 111.↵
- 112.↵
- 113.↵
- 114.↵
- 115.↵
- 116.↵
- 117.↵
- 118.↵
- 119.↵
- 120.↵
- 121.↵
- 122.↵
- 123.↵
- 124.↵
- 125.↵
- 126.↵
- 127.↵
- 128.↵
- 129.↵
- Received for publication September 18, 2007.
- Accepted for publication January 2, 2008.


Jump to section
- Article
- Abstract
- CELLULAR IMMUNE SYSTEM AND IMMUNOTHERAPY
- IMMUNE EVASION
- UTILITY OF IMAGING IN MONITORING IMMUNOTHERAPY
- CLINICAL IMAGING OF IMMUNOTHERAPY
- METHODS FOR LABELING CELLS OF INTEREST
- INTRODUCTION OF REPORTER GENES
- VISUALIZING KINETICS OF ANTIGEN PRESENTATION
- TRAFFICKING AND LOCALIZATION OF EFFECTOR CELLS
- COMPENSATING FOR LIMITATIONS OF INDIVIDUAL IMAGING TECHNIQUES WITH MULTIMODALITY IMAGING
- QUANTIFICATION OF CELL NUMBERS AT SITE OF INTEREST AND LIMIT OF DETECTION
- BALANCING CELL MARKING WITH POTENTIAL TOXICITY AND IMMUNOGENICITY
- IMAGING THE ACTIVATION STATUS OF IMMUNE CELLS
- TARGETING REPORTER GENE EXPRESSION TO SPECIFIC CELL SUBSETS
- CONCLUSION
- Acknowledgments
- Footnotes
- References
- Figures & Data
- Info & Metrics
Related Articles
Cited By...
- No citing articles found.