


Abstract
Clinical molecular imaging of apoptosis is a highly desirable yet unmet challenge. Here we provide the first report on 18F-labeled 5-fluoropentyl-2-methyl-malonic acid (18F-ML-10), a small-molecule, 18F-labeled PET tracer for the imaging of apoptosis in vivo; this report includes descriptions of the synthesis, radiolabeling, and biodistribution of this novel apoptosis marker. We also describe the use of 18F-ML-10 for small-animal PET of neurovascular cell death in experimental cerebral stroke in mice. Methods: 18F-ML-10 was synthesized by nucleophilic substitution from the respective mesylate precursor, and its biodistribution was assessed in healthy rats. Permanent occlusion of the middle cerebral artery (MCA) was induced in mice, and small-animal PET was performed 24 h later. Results: Efficient radiolabeling of ML-10 with 18F was achieved. Biodistribution studies with 18F-ML-10 revealed rapid clearance from blood (half-life of 23 min), a lack of binding to healthy tissues, and rapid elimination through the kidneys. No significant tracer metabolism in vivo was observed. Clear images of distinct regions of increased uptake, selectively in the ischemic MCA territory, were obtained in the in vivo small-animal PET studies. Uptake measurements ex vivo revealed 2-fold-higher uptake in the affected hemisphere and 6- to 10-fold-higher uptake in the region of interest of the infarct. The cerebral uptake of 18F-ML-10 was well correlated with histologic evidence of cell death. The tracer was retained in the stroke area but was cleared from blood and from intact brain areas. Conclusion: 18F-ML-10 is useful for noninvasive PET of neurovascular histopathology in ischemic cerebral stroke in vivo. Such an assessment may assist in characterization of the extent of stroke-related cerebral damage and in the monitoring of disease course and effect of treatment.
Apoptosis is a controlled program of cell death that is inherent in every cell and that plays important roles in normal tissue homeostasis and in the etiology or pathogenesis of numerous medical disorders. Molecular imaging of this process in clinical practice may therefore enhance diagnosis, monitoring of disease course, and monitoring of the efficacy of treatment for a wide array of diseases, including myocardial infarction, cerebral stroke, and cancer (1–3). Albeit highly desirable, this challenge has not yet been met. Among others, annexin-V, synaptotagmin, and caspase substrates have all been explored as potential candidates (4–6); each has limitations, such as biodistribution or immunogenicity. An additional unmet challenge is an apoptosis imaging agent for PET, which has emerged as the leading modality for molecular imaging; PET has advantages in terms of sensitivity, resolution, and signal quantification but also has challenges with regard to efficient and rapid radiolabeling.
Here we present the first report on 18F-labeled 5-fluoropentyl-2-methyl-malonic acid (18F-ML-10), an 18F-labeled, small-molecule tracer of apoptosis. 18F-ML-10 belongs to a family of low-molecular-weight compounds used for the imaging of cell death in vivo. These compounds respond to alterations in plasma membrane potential and phospholipid scrambling, which are hallmarks of apoptotic cells. After systemic administration, these compounds can detect apoptotic cells from the early stages of the death process, cross the intact plasma membrane, and accumulate in the cytoplasm (7–9). The performance of the fluorescent analogous compounds didansyl-l-cystine (DDC) and NST-732 in the detection of cell death after systemic administration in vivo was previously reported in various animal models (7–9) including, among others, monitoring of the tumor response to treatment, acute renal failure, and acute cerebral ischemia. In all of these models, the accumulation of the compounds in apoptotic cells in vivo was well correlated with the in vitro standard assessment of the death process. 18F-ML-10 (Fig. 1) was specifically designed to meet the challenge of clinical imaging of apoptosis by PET. For this purpose, it has a compact structure (molecular weight, 206) and a minimal number of functional groups, and it harbors an 18F radioisotope.
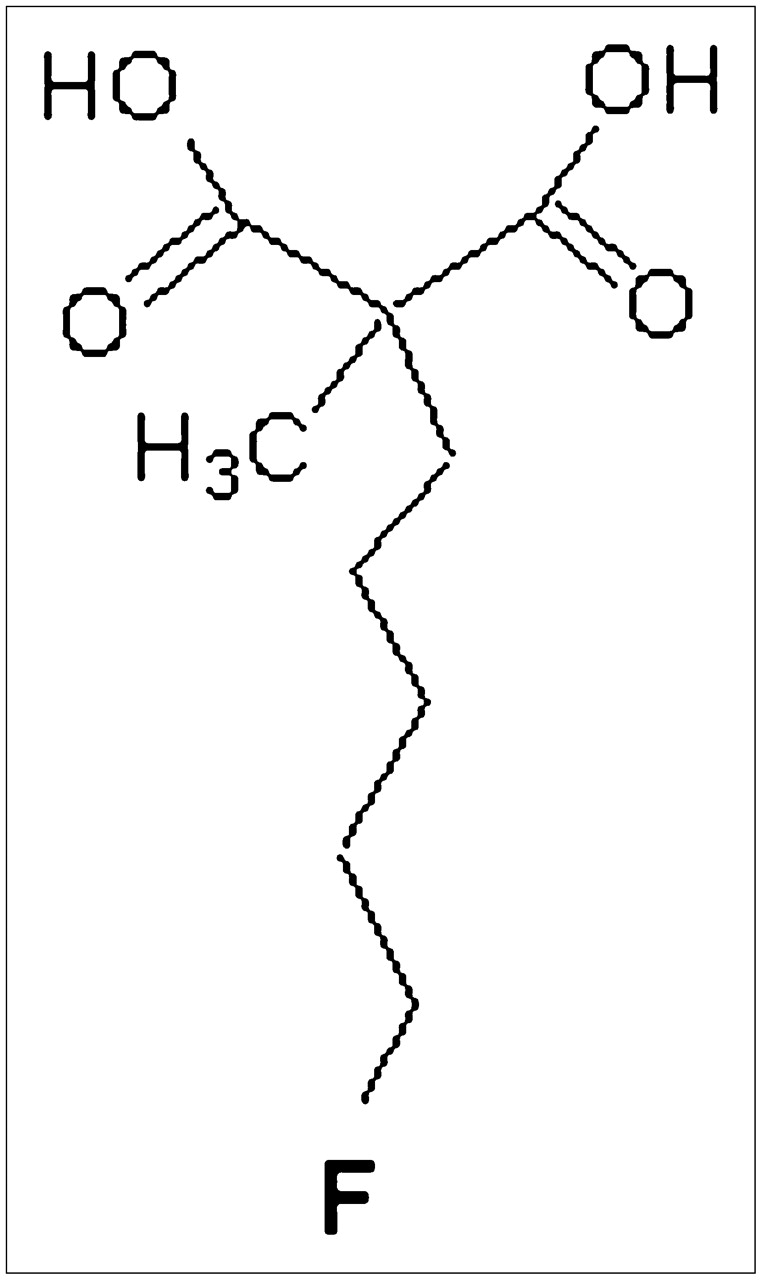
Structure of ML-10 (molecular weight, 206).
Cerebral stroke is the most prevalent neurologic disorder. Recent advances in the understanding of stroke pathophysiology have defined the neurovascular unit (NVU), comprising the closely related neuronal, endothelial, and glial cells, as the basic cerebral structural unit undergoing cell death in stroke (10). Although necrosis predominates as the mode of NVU cell death during the hyperacute stage of stroke, apoptosis plays an important role in ensuing stages of active disease, triggered by numerous factors (11). An imaging agent enabling noninvasive, real-time detection of cell death in cerebral stroke would be useful in the clinical management of stroke by improving the assessment of the extent of tissue damage and the monitoring of treatment.
Here we describe the synthesis and radiolabeling of 18F-ML-10 and its biodistribution and metabolism in healthy rats. In addition, we describe the use of this novel probe for small-animal PET of NVU cell death in experimental acute cerebral stroke in mice.
MATERIALS AND METHODS
Animals
CD rats were used for the biodistribution study, and BALB/C mice were used for the model of experimental stroke. Animals were purchased from Taconic Laboratories and were housed at the Columbia University Animal Care Facilities, in compliance with legal and ethical guidelines for animal care. Study protocols were approved by the Institutional Animal Care and Use Committee at Columbia University. Unless otherwise specified, the synthesis of all compounds was performed at Albany Molecular Research Inc.
Chemical Synthesis
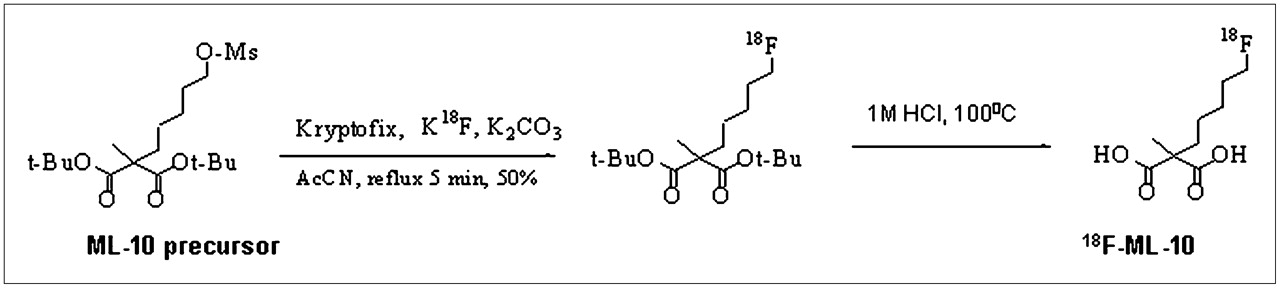
18F-ML-10 (Fig. 1) was synthesized from its respective precursor, ML-10-mesylate, by a nucleophilic substitution reaction as shown in Figure 2. For radiolabeling, 18F-fluoride delivered from a cyclotron was trapped on a quaternary ammonium cartridge, and excess 18H2O was removed. 18F− was eluted with Kryptofix222 (Sigma-Aldrich), and azeotropic drying at 90°C under argon with acetonitrile furnished dry 18F-fluoride. The precursor ML-10 mesylate in anhydrous acetronitrile was added for a 15-min reaction at 90°C. After dilution with acetonitrile, silica Sep-Pak (Waters) was used to separate t-butyl–protected 18F-ML-10. Hydrolysis of the protecting groups was accomplished by treatment with trifluoroacetic acid (TFA):H2O (9:1) at room temperature for 15 min. Dilution with deionized water followed by semipreparative reversed-phase high-performance liquid chromatography (HPLC) (mobile phase of water:acetonitrile:TFA, 80:20:1 [v/v/v]; octyldecyl silane column [Phenomenex]; flow rate of 10 mL/min) provided purified 18F-ML-10. The product eluted at a retention time of 15 min. Organic solvents were removed after dilution with deionized water, trapping on Sep-Pak C18 (Waters), and elution with absolute ethanol. The HPLC product fraction containing 18F-ML-10 was mixed with deionized water containing 1% acetic acid (100 mL), and the mixture was passed over Sep-Pak C18. Flushing with absolute ethanol (1 mL) yielded the final product. The radiochemical yield of 18F-ML-10 was 40%−55% at the end of synthesis (EOS), with a collected product yield of 30%−40% after purification steps (EOS). The radiochemical purity was greater than 99%, and the specific activity was greater than 40.7 GBq/μmol (EOS). The overall time required for radiolabeling was about 75 min.

Scheme for radiolabeling of ML-10 with 18F radioisotope. AcCN = acetonitrile; O-Ms = O-mesyl; Ot-Bu and t-BuO = -O-tert-butyl.
For the synthesis of fluorescence-labeled ML-10, 5-aminopentyl-2-methyl-malonic acid was reacted with dansyl chloride to yield dansyl-ML-10 (5-dansylamide-2-methyl-malonic acid). For the synthesis of tritium (3H)-labeled ML-10, 5-fluoro-(pent-2-enyl)-2-methyl-malonic acid was synthesized as a precursor, tritiated utilizing Pd/C as a catalyst, and purified by HPLC.
Detection of Apoptosis but Not Necrosis with 3H-ML-10
For demonstration of the performance of ML-10 as a marker of apoptosis, 3H-ML-10 was used for the detection of apoptosis induced by an anti-Fas antibody in vitro. For this purpose, human T-cell leukemia Jurkat cells were purchased from the American Type Culture Collection and grown in Dulbecco's modified Eagle's medium with 10% fetal calf serum at 37°C in 5% CO2. For the induction of apoptosis, 106 cells per milliliter were treated with an anti-Fas (CD95) antibody for 180 min. For inhibition studies, cells were preexposed to a 50 μM concentration of the caspase inhibitor Z-VAD-FMK (Enzyme System Products) 5 min before incubation with the anti-Fas antibody. For the induction of necrosis, cells were subjected to 3 freeze–thaw cycles. For assessment of the uptake of 3H-ML-10 by cells undergoing apoptosis versus necrotic or control (viable) cells, 0.22 MBq of 3H-ML-10 was added during the last 60 min of incubation to all experimental tubes, and centrifugation ended the reaction process. Cells were washed twice to remove unbound compounds and were then submitted to lysis with SOLVABLE reagent (GNE9100; Packard Bioscience) according to the manufacturer's instructions. Radioactivity in samples was determined with a β-counter (TRI-CARB 2100TR liquid scintillation analyzer; Packard Bioscience). Radioactivity values were calculated and presented as the percentage uptake per 108 cells.
Biodistribution in Healthy Rats
18F-ML-10 (0.37 MBq) was administrated to naive adult male CD rats (5 per group). At 5, 15, 30, 60, 120, and 240 min after administration, rats were sacrificed by humane euthanasia, and the radioactivity in various tissues and organs was counted. Radioactivity values were presented as the percentage injected dose per gram (%ID/g) of tissue.
Metabolism In Vivo
The metabolism of 18F-ML-10 was studied in naive CD rats. Rats were injected with 50 MBq of 18F-ML-10 and sacrificed at 5, 40, and 90 min after injection. Brain and plasma samples were centrifuged and mixed with equal volumes of 7% (w/v) perchloric acid for the precipitation of proteins. Unlabeled tracer was added, and the mixture was centrifuged. The supernatant was removed from the pellet and then filtered. Sample preparation recovery was determined from the radioactivity in the supernatant, pellet, and filters. HPLC analysis was performed with a binary pump system (Gilson). The filtered supernatant was injected with an automated solid-phase extraction controller (ASPEC Gilson) connected to a dilutor (Gilson). The separation was performed with a Genesis C18 7-μm reversed-phase column (250 × 10 mm; Jones Chromatography) at a flow rate of 6 mL/min. The mobile phase consisted of acetonitrile:10 mM phosphoric acid (40:60 [v/v]). An ultraviolet light detector (Gilson) was used to detect unlabeled substances at 220 nm. The radioactivity was measured with a well-type scintillation counter. A radioactivity detector (Radiomatic 500TR; Packard BioScience) was also coupled to the column.
Surgical Occlusion of Middle Cerebral Artery (MCA)
Anesthesia was induced with ketamine and xylazine (1.7 and 0.6 mg/kg, respectively) and maintained with halothane (1.5%). Permanent ischemia was induced as previously described (12). In brief, a subtemporal craniotomy was performed, the dura was gently removed, and the MCA was exposed and occluded by bipolar diathermy (Diathermia apparatus, MB122; Gima). Animals were monitored for 4 h after surgery for normal behavior (activity, demeanor, and food consumption) and were allowed to recover for 22 h. At 24 h after occlusion, mice were scored for neurologic deficits, on a scale of 0–18, according to a neurologic test as described by Garcia et al. (13). Animals with neurologic deficit severity scores of 10–14 were chosen for inclusion in the experimental group.
Dynamic PET
18F-ML-10 (∼13 MBq) was administered in a volume of 100 μL (containing 5% ethanol in saline) to mice with MCA occlusion (MCAO mice). Mice were studied by small-animal PET under isoflurane anesthesia while body temperature was maintained with a heated water blanket and respiration was visually monitored. The PET camera used was a Concorde R4 microPET camera (CTI Microsystems) with a center-of-field resolution of 2.2 mm. Animals were scanned from injection until 90 min after administration. At the imaging endpoint, animals were sacrificed.
Measurements of 18F-ML-10 Uptake in Blood and Brain Hemispheres of MCAO Mice
Animals were injected with 0.37 MBq of 18F-ML-10 (in 100 μL of saline) for 30 (n = 3), 60 (n = 4), and 90 (n = 4) minutes. Animals were then sacrificed by cervical dislocation, blood samples were taken for the calculation of tracer clearance, and brains were removed and split into 2 hemispheres for the assessment of radioactivity with a γ-counter. Measurements of radioactivity were obtained by analyzing the tracer concentration at the whole-hemisphere level. Values were corrected for the 18F isotope decay. For the calculation of 18F-ML-10 clearance from the damaged hemispheres and from blood, the percentage change from the uptake value at 30 min was plotted.
Phosphorimaging
MCAO mice were injected with 3.7 MBq of 18F-ML-10 (in 100 μL of saline) and sacrificed at 60 min after administration. Brains were removed and quick-frozen, and sections (20 μm) were prepared and mounted on slides. Slides were exposed for 2 h to phosphorimaging plates that were sensitive to γ-radiation. Signals were analyzed by densitometry.
Histologic Analysis
Apoptosis was confirmed by the terminal deoxynucleotidyltransferase-mediated biotin-dUTP nick-end labeling (TUNEL) assay (Intergen, Inc.). The neuronal identity of the stained apoptotic cells (data not shown) was confirmed by staining with mouse anti–neuronal nucleus (1:100) monoclonal antibody (NeuN; Chemicon, Inc.).
Uptake of ML-10 Versus Blood–Brain Barrier (BBB) Disruption
For examination of ML-10 uptake in the infarct region versus BBB disruption at the histologic level, animals were subjected to occlusion of the MCA; 24 h later, they were injected intravenously with Evans blue (EB; 2% in saline), a well-accepted marker for BBB integrity (14). EB does not cross the intact BBB and has red fluorescence. The detection of such red fluorescence in tissue sections therefore implies brain capillaries or extravasation of the compound through a disrupted BBB. Concomitantly, the animals were injected with fluorophore-labeled ML-10 (dansyl-ML-10; 140 mg/kg), which has green fluorescence. Sixty minutes later, animals were sacrificed, brains were dissected and sectioned, and the sections were examined by fluorescence microscopy (with a UM6 1002 filter; Olympus). Areas of red fluorescence, indicating EB and associated BBB disruption, were compared with areas of green fluorescence, indicating the presence of dansyl-ML-10.
Statistical Analysis
Uptake values were calculated as %ID/g of tissue. For autoradiography studies, films were scanned, and images were analyzed by drawing regions of interest encircling the infarct areas and respective areas of identical sizes in the contralateral hemisphere. Radioactive density at the regions of interest was assessed in digital light units, with subtraction of the background counts. Groups were compared by use of an unpaired or a paired Student t test as applicable. Statistical significance was defined as P < 0.05.
RESULTS
Detection of Apoptosis Versus Necrosis by 3H-ML-10 In Vitro
The ability of ML-10 to target apoptotic cells was tested in vitro with Jurkat cells, which were induced to undergo apoptosis by treatment with anti-Fas antibody and then incubated with 3H-ML-10. As shown in Table 1, the control culture manifested a low level of apoptosis. In contrast, after the induction of apoptosis, a marked 9.1-fold increase in the uptake of 3H-ML-10 was observed. Furthermore, after inhibition of the apoptotic process by concomitant treatment with a caspase inhibitor, increased uptake of 3H-ML-10 was not observed (Table 1). In another experiment, cells were induced to undergo necrotic cell death by exposure to several freeze–thaw cycles, and the uptake of 3H-ML-10 was examined as described earlier. In contrast to the increased uptake of 3H-ML-10 in apoptotic cells, necrotic cells did not manifest uptake of 3H-ML-10, and the levels of the tracer in these cells were similar to those in the control (viable) cells (Table 1). These results indicate the selectivity of the uptake of 3H-ML-10 in apoptotic but not necrotic cells and the sensitivity of tracer uptake to concomitant inhibition of the apoptotic death process by a caspase inhibitor.
3H-ML-10 Uptake in Jurkat Cells in Response to Induction and Inhibition of Apoptosis vs. Induction of Necrosis
Biodistribution in Healthy Rats
The biodistribution of 18F-ML-10 in healthy rats is shown in Table 2. After intravenous administration, the compound was distributed rapidly throughout the body and did not manifest specific uptake in any organ. Levels in blood declined rapidly, with a half-life of 23 min. The compound showed rapid clearance through the kidneys. Importantly, levels of uptake in bone were low and decreased over time, thus ruling out defluorination of the tracer in vivo. Low levels were observed in brains. Also noteworthy were the relatively low levels of uptake in the liver. Taken together, these data were in alignment with the profile expected for 18F-ML-10 on the basis of its mode of action: extracellular distribution of the compound, reflecting its exclusion from viable cells and lack of binding to healthy tissues.
Biodistribution of 18F-ML-10 in Healthy Rats
Metabolism In Vivo
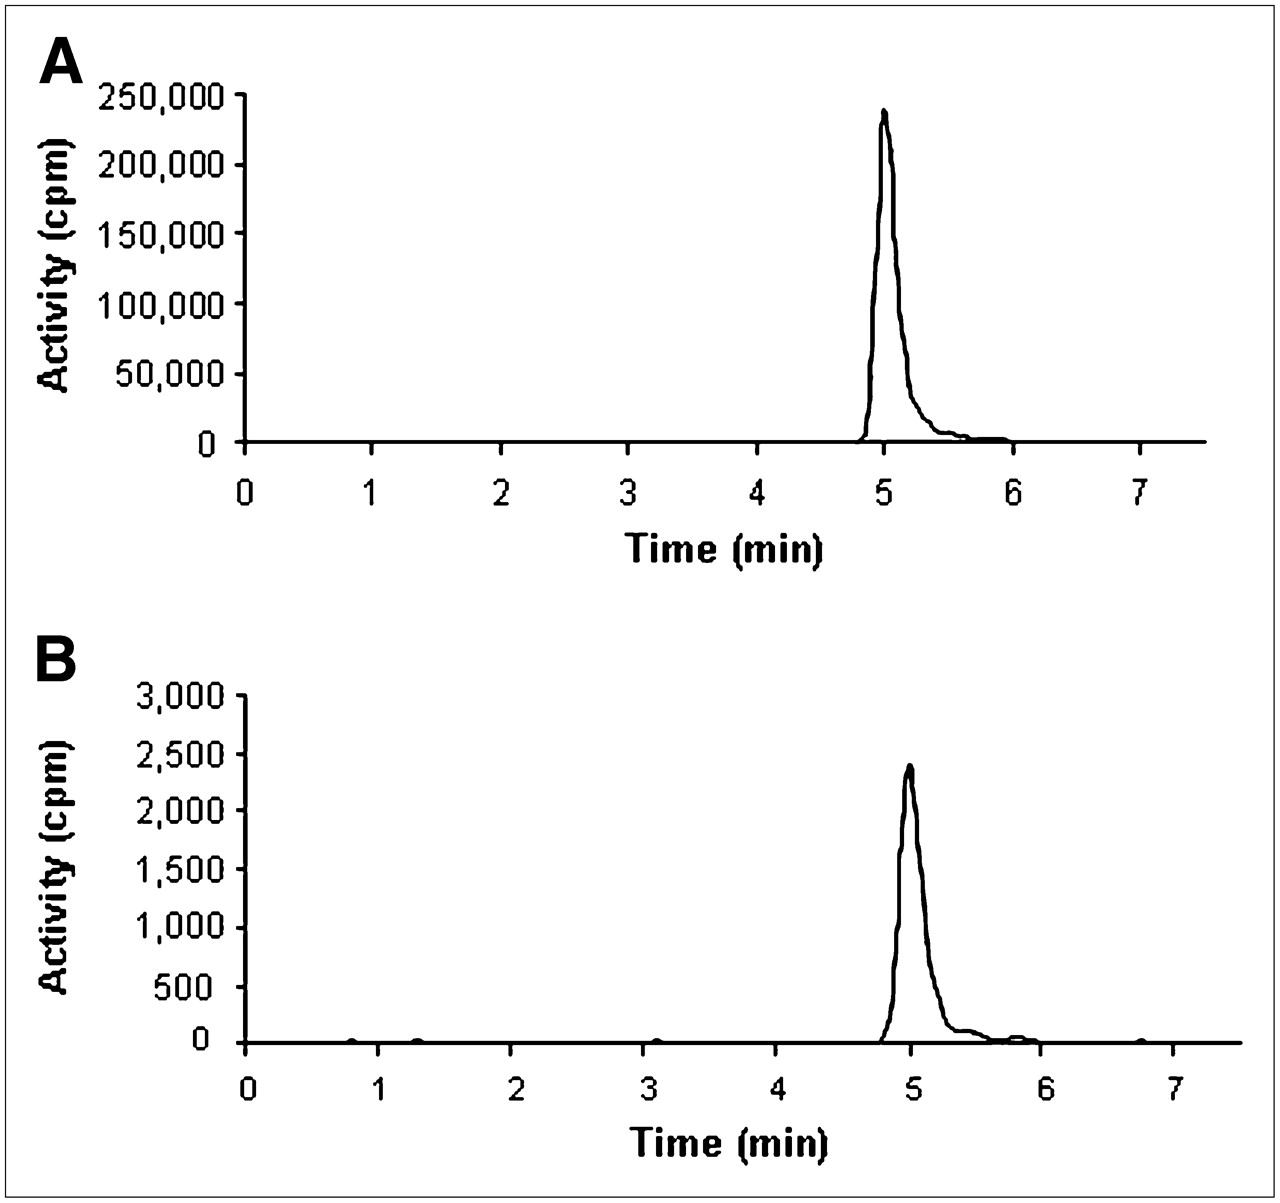
Radio-detector chromatograms of plasma and brain tissue at 90 min after administration of 18F-ML-10 to healthy rats are shown in Figures 3A and 3B, respectively. Recovery was 70.2% (n = 3; SD = 0.3%). No significant metabolism of the tracer in vivo was observed up to 90 min after its administration, indicating that more than 97% of the compound was intact.

Assessment of metabolism of 18F-ML-10 in vivo by HPLC analysis. Chromatograms of samples of plasma (A) and brain tissue homogenate (B) were obtained at 90 min after intravenous administration of 50 MBq of 18F-ML-10. Only one peak, representing intact tracer (>97% of total activity), was observed.
Dynamic PET
Dynamic small-animal PET studies were performed in mice 24 h after the induction of cerebral ischemia by permanent occlusion of the MCA. Representative images obtained 45–90 after tracer injection are shown in Figure 4. Selective uptake of the tracer was observed only in the affected left hemisphere. Uptake was parenchymal, involving both cortical and subcortical regions. Interestingly, the pattern of uptake in the damaged area was multifocal, with a gradient of intensities. In contrast, very low tracer levels were observed in the contralateral hemisphere.

Small-animal PET with 18F-ML-10 of cell death in vivo. Permanent occlusion of MCA was performed to induce cerebral ischemia in mouse, and PET was performed 24 h later. Selective uptake in region of cerebral ischemia was observed. Uptake was parenchymal and multifocal, and various intensities were observed in infarct region. (A and B) Small-animal PET image and corresponding top view of mouse, respectively (arrow indicates site of surgery). (C and D) Small-animal PET image and corresponding side view of mouse, respectively. (E) Transaxial section and quantitative color scale for PET images.
Correlation of 18F-ML-10 Uptake with Histopathology
For verification of a correlation between the uptake of 18F-ML-10 in the infarct region and concurrent apoptosis in the damaged cerebral region, phosphorimaging of tissue sections obtained from MCAO mice was performed. 18F-ML-10 was injected into MCAO mice 24 h after the induction of ischemia. Sixty minutes later, animals were sacrificed, and serial sections (n = 50) of each brain were exposed to phosphorimaging plates for 2 h. A representative section is shown in Figure 5A. Density measurements (expressed as digital light units per mm2) revealed a 6- to 10-fold-higher signal density in the infarct region than in the corresponding region on the contralateral side. Tissue histologic analysis was performed with isotope-decayed slides and TUNEL staining for detection of the characteristic apoptotic DNA fragmentation. As shown in Figures 5B and 5C, TUNEL staining of a transitional zone between the ischemic and the intact cerebral tissues indicated a correlation between areas with 18F-ML-10 uptake and areas with the characteristic DNA fragmentation of apoptotic cells.
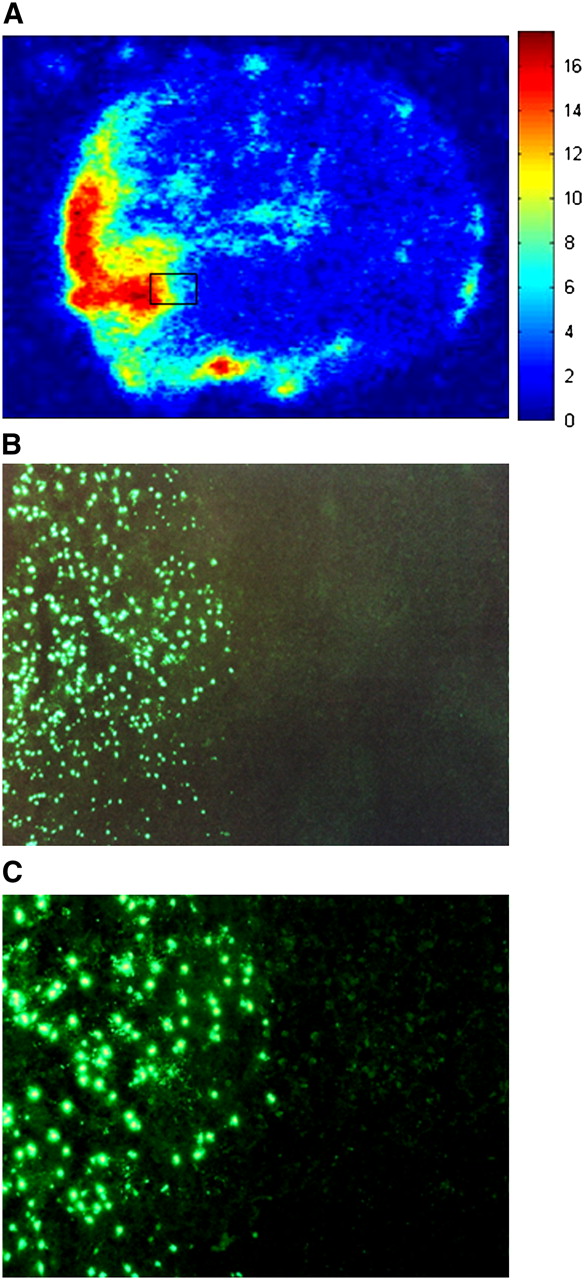
Phosphorimaging of brain sections 60 min after intravenous administration of 18F-ML-10. (A) Exposure of brain section to γ-radiation–sensitive phosphorimaging plate revealed accumulation of 18F-ML-10 signal in brain area corresponding to ischemic MCA territory. Graded intensities were observed, with highest uptake at infarct core and gradually less uptake at periphery. (B and C) TUNEL staining of transitional zone between ischemic and healthy brain tissues (enlargements of inset in A; magnifications, ×100 [B] and ×200 [C]). 18F-ML-10 uptake was found to correlate with apoptosis, as indicated by TUNEL staining in corresponding region.
Retention of 18F-ML-10 in Infarct Region
For confirmation of the retention of 18F-ML-10 in the region of the cerebral infarct but the clearance of 18F-ML-10 from nontarget regions, the uptake of 18F-ML-10 in the affected hemisphere was measured over time and compared with the uptake in the contralateral hemisphere and blood. For this purpose, 18F-ML-10 was injected into 3 groups of MCAO mice (0.37 MBq per animal), and the animals were sacrificed at 30, 60, and 90 min after injection. Table 3 shows the uptake values (%ID/g) in the damaged hemisphere and the contralateral side as well as the ratio of the values in the damaged hemisphere to those in the contralateral hemisphere (DH/CLH ratio). The tracer was retained in the damaged hemisphere but was cleared from the contralateral side over time. Accordingly, the DH/CLH ratio rose from an average of 1.26 at 30 min after injection to 1.80 at 60 min and 2.29 at 90 min. The curve representing the clearance of 18F-ML-10 from the damaged hemisphere versus blood is shown in Figure 6A. Nearly linear clearance of the tracer from blood was observed, whereas the tracer showed marked retention in the infarct region.
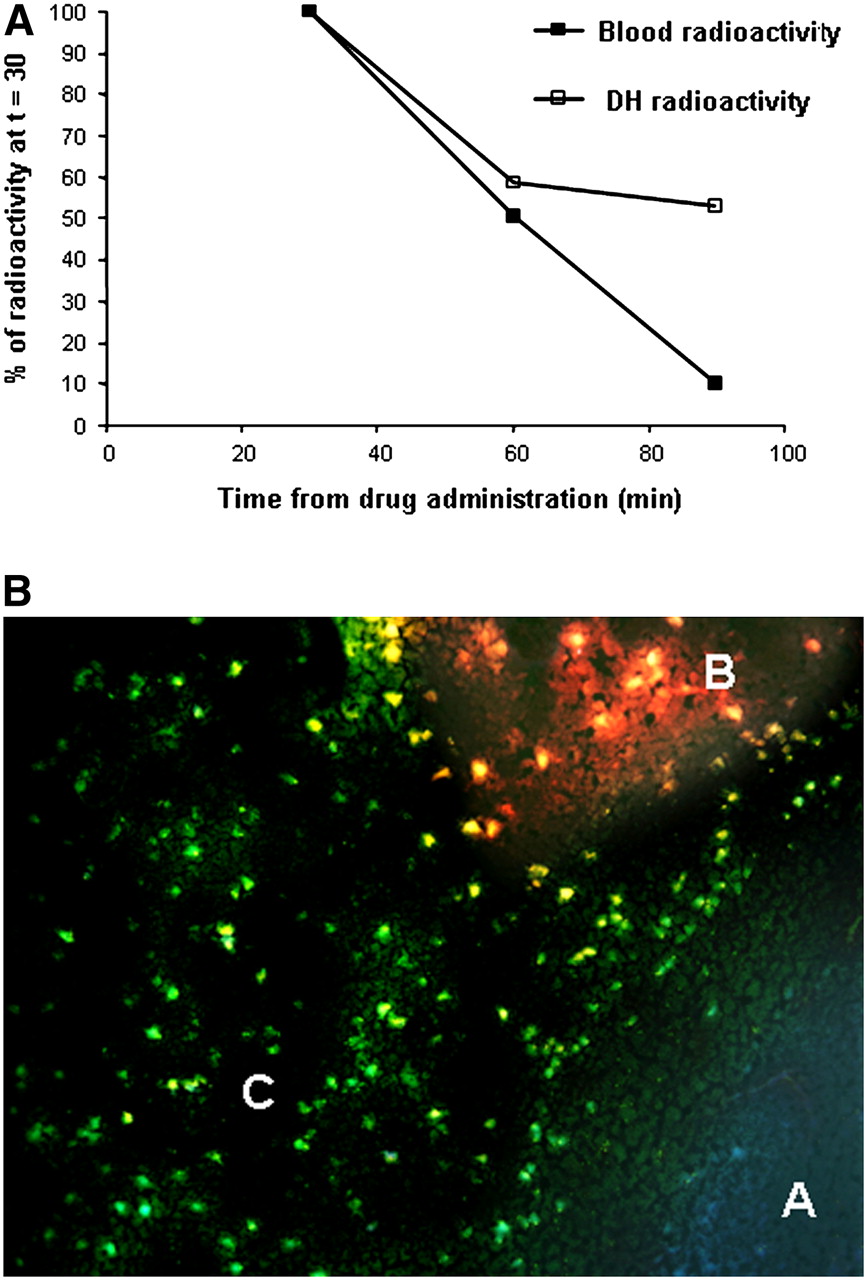
Distinction of ML-10 uptake in infarct region from blood activity (A) and BBB disruption (B). (A) Kinetic profile of clearance of tracer from damaged hemisphere (DH) vs. blood (30–90 min after administration; activity at 30 min was defined as 100%). (B) Fluorescence microscopy showing transitional zone between healthy brain tissue (area A) and infarct (areas B and C). Animal was subjected to MCA occlusion; 24 h later, concomitant administration of fluorescent probe dansyl-ML-10 and EB (marker of BBB disruption) was performed. Area A contained intact brain tissue; therefore, it lacked EB or dansyl-ML-10 binding and manifested pale bluish autofluorescence. Area B contained cells at portion of infarct with BBB disruption, as indicated by EB extravasation to extracellular space, giving rise to red haze. Area C contained EB-negative cells, manifesting green fluorescence of dansyl-ML-10 and therefore indicating tracer uptake without concomitant BBB disruption. Uptake was cellular, into individual cells, creating starry-sky appearance of slide; this pattern is characteristic of apoptosis (magnification, ×200).
Temporal Profile of Uptake of 18F-ML-10 in Damaged and Contralateral Hemispheres of MCAO Mice
Histologic Analysis of Infarct Region with Dansyl-ML-10 and Marker for BBB Integrity
For evaluation at the histologic level of ML-10 uptake in the infarct region versus BBB disruption, we used concomitant intravenous administration of EB as a marker for BBB integrity (14) and dansyl-ML-10. Brains were subjected to fluorescence microscopy as described earlier. Although there were areas of concomitant red fluorescence and green fluorescence, mainly at the core of the infarct, there were also other regions, more at the periphery and at the transitional zones between healthy and infarcted tissues, in which dansyl-ML-10 uptake was observed without concomitant BBB disruption. One such region, a transitional zone between healthy brain tissue (area A) and the infarct (areas B and C), is shown in Figure 6B. Healthy brain tissue lacked EB or dansyl-ML-10 binding and manifested pale bluish autofluorescence (area A). Area B was characterized by red fluorescence, indicating BBB disruption and respective EB extravasation to the extracellular space, giving rise to a red “haze” in that area. In contrast, selective uptake of dansyl-ML-10 into numerous cells manifesting only the respective green fluorescence was visualized in area C. Importantly, uptake in this area was cellular, into individual cells, creating a “starry-sky” appearance of the slide. These observations support the notion that the tracer can reach target sites (i.e., sites at which cells are undergoing death) in brain tissue, through an intact BBB, and accumulate therein.
DISCUSSION
To our knowledge, this is the first report on the performance of 18F-ML-10, a PET tracer of cell death. It is a member of a family of small-molecule detectors of apoptosis (7–9). Apoptosis is characterized, from its early stages, by marked membrane alterations, comprising acidification of the outer membrane leaflet and permanent membrane depolarization. The compounds are amphipathic, designed to respond to this unique set of membrane alterations by selectively binding to apoptotic cells from the early stages of the death process, crossing the cell membrane, and accumulating in the cytoplasm (7–9). On the basis of this mechanism, 18F-ML-10 was designed to meet the challenge of clinical imaging of apoptosis by PET; achieving this goal required a very compact structure comprising an 18F radioisotope. Indeed, the molecular weight of 18F-ML-10 is 206 and, importantly, this minimized structure preserved the functional aspects of the compounds of its family for the detection of apoptosis. For example, in the in vitro experiment in the present study, apoptosis was induced in cultured cells by treatment with an anti-Fas antibody. In this well-characterized model of apoptosis, 18F-ML-10 was excluded from viable cells but showed marked selective accumulation in cells undergoing apoptosis. Moreover, this uptake by apoptotic cells could be blocked by inhibition of the apoptotic process with a pan-caspase inhibitor. In contrast, no accumulation of the tracer in cells undergoing necrosis was observed.
The structure minimization enabled a simplified radiolabeling procedure, compatible with the procedures used in clinical PET centers (Fig. 2). This method comprises a standard nucleophilic substitution from the respective mesylate precursor, removal of the t-butyl protecting groups from the carboxyl groups, and purification. The 18F-labeled tracer was obtained in high yields for the biodistribution and small-animal PET studies, with an overall synthesis time of about 75 min. These parameters are expected to be improved further with additional optimization of the synthesis procedure.
After intravenous administration in vivo to healthy rats, 18F-ML-10 showed very high stability. Virtually no metabolism of the compound, either in blood or in the brain, was observed up to 90 min after tracer injection (Fig. 3). These results support the notion that the signal obtained in the imaging studies was indeed attributable to the compound itself. However, because the recovery of radioactivity was incomplete, the possibility of an underestimation of metabolism cannot be entirely ruled out. It is also noteworthy that both the data shown in Figure 3 and the lack of tracer accumulation in bone support the notion that defluorination of 18F-ML-10 in vivo does not occur.
The biodistribution studies revealed rapid distribution of 18F-ML-10 in the extracellular space. Levels in the brain and liver were low. This pattern of distribution is in accordance with the results of in vitro studies showing the exclusion of the tracer from intact viable cells and with the mechanism of action of this family of compounds (7–9). In accordance with this pattern, 18F-ML-10 was also rapidly eliminated from blood and all tissues at nearly identical rates, characterized by a half-life of about 25 min, and was excreted through the urine. This biodistribution profile is suitable as a baseline setting for the imaging of apoptosis-related foci of disease.
As a clinically relevant example of such imaging of the foci of disease, we chose the imaging of neurovascular cell death in experimental ischemic stroke. This indication was selected on the basis of the recent focus on the NVU, comprising neuronal, glial, and endothelial cells, as the basic unit in cerebral damage in ischemia. Pursuant to the initial ischemic insult, apoptosis is induced in the ischemic region by numerous factors, such as glutamate and related neuroexcitotoxic substances, mediators of inflammation, calcium, oxygen free radicals, or matrix proteases. The intensity of this NVU cell death is ultimately translated to the extent of the neurologic deficit, the risk for complications (such as hemorrhagic transformation), and the prognosis for stroke patients. NVU damage is augmented by reperfusion, either spontaneous or induced by treatment with tissue plasminogen activator (tPA) (15). These clinical implications of NVU damage emphasize the potential clinical applications of its noninvasive imaging, such as allowing better assessment of the disease course for stroke patients, improving clinical decision making on an individual basis, and assisting in the development of novel therapies.
The experimental paradigm included imaging of cerebral damage at 24 h after the onset of ischemia, a time point reported in the literature to be associated with apoptosis after the primary ischemic insult (16,17). Images were obtained at delayed times (45–90 min in the small-animal PET studies in vivo and 30–90 min for the uptake measurements ex vivo) to allow assessments of retention of the tracer at target sites and clearance from nontarget sites. In the small-animal PET studies, selective uptake of the tracer specifically in the infarct region was observed. Uptake was multifocal, parenchymal, and involved both cortical and subcortical regions. High signal-to-noise ratios were observed (6- to 10-fold in the phosphorimaging studies).
Ischemic cerebral neurovascular damage is characterized by both apoptosis and BBB disruption. Therefore, a limitation of the present study is that it could not adequately distinguish the specific uptake of 18F-ML-10 in target apoptotic cells and the contribution of a defective BBB. Further studies to clarify this issue should include models of pure BBB disruption without apoptosis (induced, e.g., by hyperosmolar mannitol infusion) or models of neurodegenerative disorders in which apoptosis takes place but BBB integrity is preserved.
Several lines of evidence are indicative, however, of binding of the tracer to target cells in the stroke region, rather than passive diffusion through a disrupted BBB. Unlike nonspecific diffusion, which is strictly dependent on a concentration gradient, the retention of 18F-ML-10 in the stroke region was manifested over time, relative to the clearance of 18F-ML-10 from either the contralateral hemisphere (Table 3) or blood (Fig. 6A). To further clarify this issue, we also used an experimental paradigm in which ML-10 labeled with a fluorophore (dansyl-ML-10) was administered intravenously in vivo, concomitantly with EB, a well-established marker for BBB disruption. Subsequently, a comparative assessment of the brain uptake of these probes at the histologic level was performed by fluorescence microscopy. The results (Fig. 6B) demonstrated that the uptake of dansyl-ML-10 took place in regions of the infract that did not manifest EB uptake. In addition, in these regions, dansyl-ML-10 showed a cellular pattern of uptake, that is, uptake by individual cells; this result further argues in favor of selective binding to specific target cells.
The present study revealed a correlation between the uptake of 18F-ML-10 and positive TUNEL staining selectively in the regions that showed the uptake of 18F-ML-10. Because TUNEL detects internucleosomal DNA fragmentation, which is one of the hallmarks of apoptosis, this correlation supports specific binding of the tracer to target apoptotic cells. However, we cannot rule out the possibility that, in addition to uptake by apoptotic cells, 18F-ML-10 also accumulated in cells manifesting features of necrotic cell death, because positive TUNEL staining has been reported in such cells as well (18–20). As shown in the present study, 3H-ML-10 accumulated in apoptotic cells but not in cells undergoing necrosis in vitro (Table 1). Substantiation of this observation in vivo as well is still warranted, especially with recent evidence indicating that, in vivo, a continuum between apoptosis and necrosis may take place (rather than the classical dichotomy between these 2 modes of cell death (21)), with cells undergoing death with features of both processes. Such transitional states may have occurred in the present study.
At present, there is no tool in medical practice for the clinical assessment of stroke-related apoptosis. Encouraging results were obtained with 99mTc-annexin-V, which enabled the imaging of cell death by SPECT in patients with acute cerebral stroke (4). However, annexin-V is a large protein, with pharmacokinetic challenges such as slow blood clearance and potential immunogenicity. In addition, PET offers advantages over SPECT, such as high sensitivity, enhanced resolution, and amenability for signal quantification. Diffusion-weighted MRI (DWI) (22,23) is now used to assess cell death in the hyperacute stage of stroke. DWI indicates cytotoxic edema associated with the hyperacute stage of the infarct and resultant restriction in the diffusion of water molecules, leading to a decreased apparent diffusion coefficient (ADC) in the stroke region (24). However, apoptotic cells in tissues are associated with the opposite phenomenon, that is, an increased ADC, because of a shift of water molecules from the intracellular space to the extracellular space. This apoptosis-related increased ADC is used, for example, in the monitoring of apoptosis induced by anticancer agents (25,26). Thus, a cerebral infarct is subjected to opposite ADC changes, leading to pseudonormalization of signals (27) and thus ruling out the use of DWI as a method for determining stroke-related apoptosis.
An obvious limitation of the present study is the use of an experimental animal model of stroke in rodents. Extrapolation from animal studies to the human clinical arena is often not an easy process, especially in the field of cerebral stroke. Using the microdosing approach (28), we have now initiated human studies for PET with 18F-ML-10. It is hoped that on the completion of its development, 18F-ML-10 will provide a noninvasive perspective on NVU histopathology in patients with stroke and other NVU disorders, allowing better assessment of the cellular processes underlying clinical deficits and thereby assisting in clinical decision making.
CONCLUSION
18F-ML-10 as a PET tracer offers integration of the detection of apoptosis with simple, clinically compatible radiolabeling, high stability in vivo, and a favorable biodistribution. We propose the use of this novel PET tracer for the noninvasive assessment of neurovascular damage in ischemic stroke. Such a tool may assist clinical neurologists in diagnosis and in monitoring the disease course and treatment for individual patients.
Acknowledgments
We thank Shengquan Duan and Phil Dent in Albany, New York, for chemical synthesis of the tested compound; Pernilla Frandberg in Uppsala, Sweden, for chemical stability studies; and Jun Zhao and Raymond Chang at Columbia University, New York, New York, for radiosynthesis and the small-animal PET study.
Footnotes
-
COPYRIGHT © 2008 by the Society of Nuclear Medicine, Inc.
References
- Received for publication May 30, 2007.
- Accepted for publication May 14, 2008.


Jump to section
Related Articles
Cited By...
- A Systematic Comparison of 18F-C-SNAT to Established Radiotracer Imaging Agents for the Detection of Tumor Response to Treatment
- Biodistribution and Radiation Dosimetry of 18F-CP-18, a Potential Apoptosis Imaging Agent, as Determined from PET/CT Scans in Healthy Volunteers
- 18F-ML-10, a PET Tracer for Apoptosis: First Human Study
- Small-Molecule Biomarkers for Clinical PET Imaging of Apoptosis