


Abstract
To clarify the spatial relationship between coronary microvascular dysfunction and myocardial fibrosis in hypertrophic cardiomyopathy (HCM), we compared the measurement of hyperemic myocardial blood flow (hMBF) by PET with the extent of delayed contrast enhancement (DCE) detected by MRI. Methods: In 34 patients with HCM, PET was performed using 13N-labeled ammonia during hyperemia induced by intravenous dipyridamole. DCE and systolic thickening were assessed by MRI. Left ventricular myocardial segments were classified as with DCE, either transmural (DCE-T) or nontransmural (DCE-NT), and without DCE, either contiguous to DCE segments (NoDCE-C) or remote from them (NoDCE-R). Results: In the group with DCE, hMBF was significantly lower than in the group without DCE (1.81 ± 0.94 vs. 2.13 ± 1.11 mL/min/g; P < 0.001). DCE-T segments had lower hMBF than did DCE-NT segments (1.43 ± 0.52 vs. 1.91 ± 1 mL/min/g, P < 0.001). Similarly, NoDCE-C segments had lower hMBF than did NoDCE-R (1.98 ± 1.10 vs. 2.29 ± 1.10 mL/min/g, P < 0.01) and had no significant difference from DCE-NT segments. Severe coronary microvascular dysfunction (hMBF in the lowest tertile of all segments) was more prevalent among NoDCE-C than NoDCE-R segments (33% vs. 24%, P < 0.05). Systolic thickening was inversely correlated with percentage transmurality of DCE (Spearman ρ = −0.37, P < 0.0001) and directly correlated with hMBF (Spearman ρ = 0.20, P < 0.0001). Conclusion: In myocardial segments exhibiting DCE, hMBF is reduced. DCE extent is inversely correlated and hMBF directly correlated with systolic thickening. In segments without DCE but contiguous to DCE areas, hMBF is significantly lower than in those remote from DCE and is similar to the value obtained in nontransmural DCE segments. These results suggest that increasing degrees of coronary microvascular dysfunction might play a causative role for myocardial fibrosis in HCM.
- coronary microvascular dysfunction
- fibrosis
- hyperthrophic cardiomyopathy
- myocardial blood flow
- positron emission tomography
Hypertrophic cardiomyopathy (HCM) is a genetically determined cardiac disease with notable heterogeneity in clinical expression, natural history, and prognosis (1,2). HCM is defined anatomically by typical histologic features: small-vessel disease, characterized by medial hypertrophy and narrowing of the intramural coronary vessels (3–5); myocite disarray; and fibrosis (6,7). Some of these histologic substrates are responsible for the distinctive microvascular dysfunction and myocardial scarring that are commonly encountered features in patients with HCM. Coronary microvascular dysfunction represents a predisposing factor for myocardial ischemia (8–12) and is a strong, independent predictor of long-term clinical progression, left ventricular (LV) remodeling, and cardiovascular death as demonstrated by the adverse prognostic meaning of a blunted hyperemic myocardial blood flow (hMBF) (13,14). Similarly, the extent of myocardial scarring is related to LV functional impairment and may identify patients at risk of disease progression and increased arrhythmic risk (15,16).
The gold standard for the evaluation of coronary microvascular dysfunction is represented by PET, which allows the quantitative assessment of MBF per unit of myocardial mass (12,17–21). Myocardial scarring can be visualized as delayed contrast enhancement (DCE) within the left ventricle by MRI (15,16,22). To date, few studies have compared baseline MBF and DCE in HCM (23,24), and to our knowledge, no data assessing the spatial relationship between hMBF and DCE exist. Therefore, the pathophysiologic relationship between coronary microvascular dysfunction and fibrosis remains elusive. We hypothesized that, at least in part, myocardial scarring in HCM could be secondary to ischemia due to coronary microvascular dysfunction. To evaluate this hypothesis, we examined the relationship of DCE to hMBF abnormalities in an HCM cohort from a tertiary referral center.
MATERIALS AND METHODS
Patients with HCM
The study cohort included 34 patients (23 men and 11 women; mean age ± SD, 37 ± 17 y, range, 15–71 y) from a large HCM population, closely followed by physicians with long-standing interest in HCM at our institution. The HCM diagnosis was made on the basis of 2-dimensional echocardiographic evidence of a hypertrophied left ventricle (maximal wall thickness ≥ 15 mm) in the absence of any other cardiac or systemic cause of LV hypertrophy (1,2). For all patients, informed consent to participate in the study was obtained, and the study protocol was approved by the local ethics committee. All patients underwent baseline echocardiography within 2 wk of the PET scans. Echocardiographic studies were performed with commercially available instruments, using standard views (2). Obstruction of the LV outflow was considered present when a peak outflow gradient of greater than or equal to 30 mm Hg was present under basal conditions (25). The characteristics of the patient population are summarized in Table 1.
Characteristics of Patient Population
PET
All PET scans were performed in the nuclear medicine laboratory (Nuclear Medicine Unit, Department of Clinical Physiopathology, Careggi University Hospital) in Florence between September 2003 and December 2006, after an appropriate period of pharmacologic washout for patients receiving pharmacologic treatment (18). Patients were positioned on the couch of a PET tomographic device (Advance PET; GE Healthcare); a 5-min transmission scan for attenuation correction was performed using a rod 68Ge source emitting monochromatic γ-radiation of 511 keV in energy. A complete 2-dimensional set of transmission data was obtained by rotating the 68Ge source around the patient. Additionally, a blank scan was taken to calibrate the transmission scan to correct eventual electronic misalignments in the frame of the postprocessing reconstruction procedure. Then, near-maximal hyperemia was induced by intravenous administration of dipyridamole (0.56 mg/kg of body weight over 4 min) (18,26). Three minutes after the end of the dipyridamole infusion, a bolus of 370 MBq of 13N ammonia (13N-labeled ammonia) diluted in 10 mL of saline solution was intravenously injected over a period of 15–20 s and followed by a 10-mL saline solution flush at a rate of 2 mL/s. A dynamic scan with 15 frames of increasing duration (12 × 10 s, 2 × 30 s, and 1 × 60 s) was acquired over 4 min, followed by a prolonged static acquisition of 15 min.
Measurement of hMBF
Data were analyzed with an operator-interactive computer program (PMOD Cardiac Modeling [PCARD]) (27). Briefly, anatomic images were reconstructed using the static acquisition and reoriented according to the heart axis. After reconstruction, the dynamic images were reoriented as well. On the short-axis slices, regions of interest (ROIs) were manually drawn including the right ventricular cavity, LV cavity, and LV wall from the apex through the base (identified by the appearance of the membranous septum). The ROIs were edited by the standard PMOD volume-of-interest (VOI) tool to derive the related VOIs. The 3 VOIs were then copied on all 13N-labeled ammonia dynamic images to extract the corresponding time–activity curves. The arterial input function was obtained from the right and LV cavity time–activity curves. The myocardial uptake was derived from the LV wall VOI (27). The LV wall was divided into 17 segments: septal (apical septal, midinferoseptal, midanteroseptal, basal inferoseptal, and basal anteroseptal), anterior (apical anterior, midanterior, and basal anterior), lateral (apical lateral, midlateral, and basal lateral), inferior (apical inferior, midinferolateral, midinferior, basal inferolateral, and basal inferior), and apical (28). Myocardial perfusion was calculated from the dynamic data by fitting the arterial input function and tissue time–activity curves to a 2–tissue-compartment model for 13N ammonia developed by Hutchins et al. (29). The hMBF for the entire left ventricle was obtained by volume-weighted averaging to the segment territories apex, septum, anterior, lateral, and inferior, as automatically provided by the PCARD program (27). All image studies were analyzed by 1 expert observer, unaware of the patient clinical, echocardiographic, and MRI data.
MRI
MRI was performed using a 1.5-T scanner (gradient slope, 30 mT/m) (Intera; Philips), with a 5-element phased-array coil. Cine images were acquired in multiple short-axis and long-axis views with a breath-hold retrospective steady-state free precession sequence (slice thickness, 8 mm; echo time, 1.53 ms; matrix, 168 × 195; SENSE factor, 1.8). The number of k-space lines for each heartbeat was adjusted to permit the acquisition of 30 cardiac phases covering the whole cardiac cycle. The field of view was 340 mm on average and adapted to the size of the patient, leading to a spatial resolution of about 2 mm. A gadolinium-based contrast agent (0.1 mmol/kg) was then given intravenously, and contrast-enhanced images were acquired by using a 3-dimensional breath-hold inversion-recovery segmented gradient-echo sequence in the same views as those used for the cine cardiac magnetic resonance series, 10–15 min after contrast administration (30). The optimal inversion time (IT) was obtained for each patient by visual inspection of a preliminary acquisition of a single-slice multi-IT series. The optimal IT (usually between 175 and 260 ms) was the one providing the best contrast between the myocardium and the LV chamber.
MRI Analysis
Global LV function parameters, including end-diastolic (ED) volume, end-systolic (ES) volume, ejection fraction, and myocardial mass, were calculated offline on a dedicated workstation (View Forum; Philips) from serial contiguous short-axis slices (usually 9–14). The same regions on the short-axis slices were defined as described for the PET study; myocardial thickness (ED and ES) and percentage systolic thickening were measured for each region (16,31). Each myocardial segment was evaluated for the presence of DCE by 1 expert observer, unaware of the results of the other protocol investigations. DCE location, extent, and pattern (nontransmural or transmural) were analyzed (30). Volumes of DCE areas were calculated by planimetry in all short-axis slices, and the total volume of DCE was expressed as a percentage of total myocardium. Finally, the segments were grouped as follows: segments with DCE, either transmural (DCE-T) or nontransmural DCE (DCE-NT), and segments without DCE, either contiguous to DCE segments (NoDCE-C) or remote (NoDCE-R) from them.
Statistical Analysis
Continuous variables are shown as mean ± SD. χ2 or Fisher exact tests, as appropriate, were used to compare noncontinuous variables expressed as proportions. The comparison of 2 datasets was performed by use of the Student t test for unpaired data. In case of multiple comparisons, the 1-way ANOVA with the Scheffé post hoc test was used. The correlation between variables was evaluated using the Spearman ρ. All P values are 2-sided and considered significant when greater than 0.05.
RESULTS
PET and MRI Findings
Mean hMBF for the entire left ventricle was 2.13 ± 1.03 mL/min/g (range, 0.97–5.57 mL/min/g) and was comparable among patients in New York Heart Association (NYHA) functional class I versus those in class II/III (1.9 ± 0.9 vs. 2.3 ± 1.3 mL/min/g, respectively; P = 0.23). DCE was detected by MRI in 30 patients (88%) and involved the segments with the greatest degree of hypertrophy (i.e., the interventricular septum) in all (Fig. 1); in 5 patients only, DCE extended to the free wall as well. Of a total of 578 segments, the number of those with DCE was 194 (34%). The average total volume of DCE within the left ventricle was 21.0 ± 22.2 mL (range, 3−80 mL), and the percentage value of the total LV volume was 16.9% ± 7.4% (range, 2%−30%). The extent of DCE was comparable among patients in NYHA functional class I versus those in class II/III (20.0 ± 24.1 vs. 22.3 ± 20.76 mL, respectively; P = 0.81).
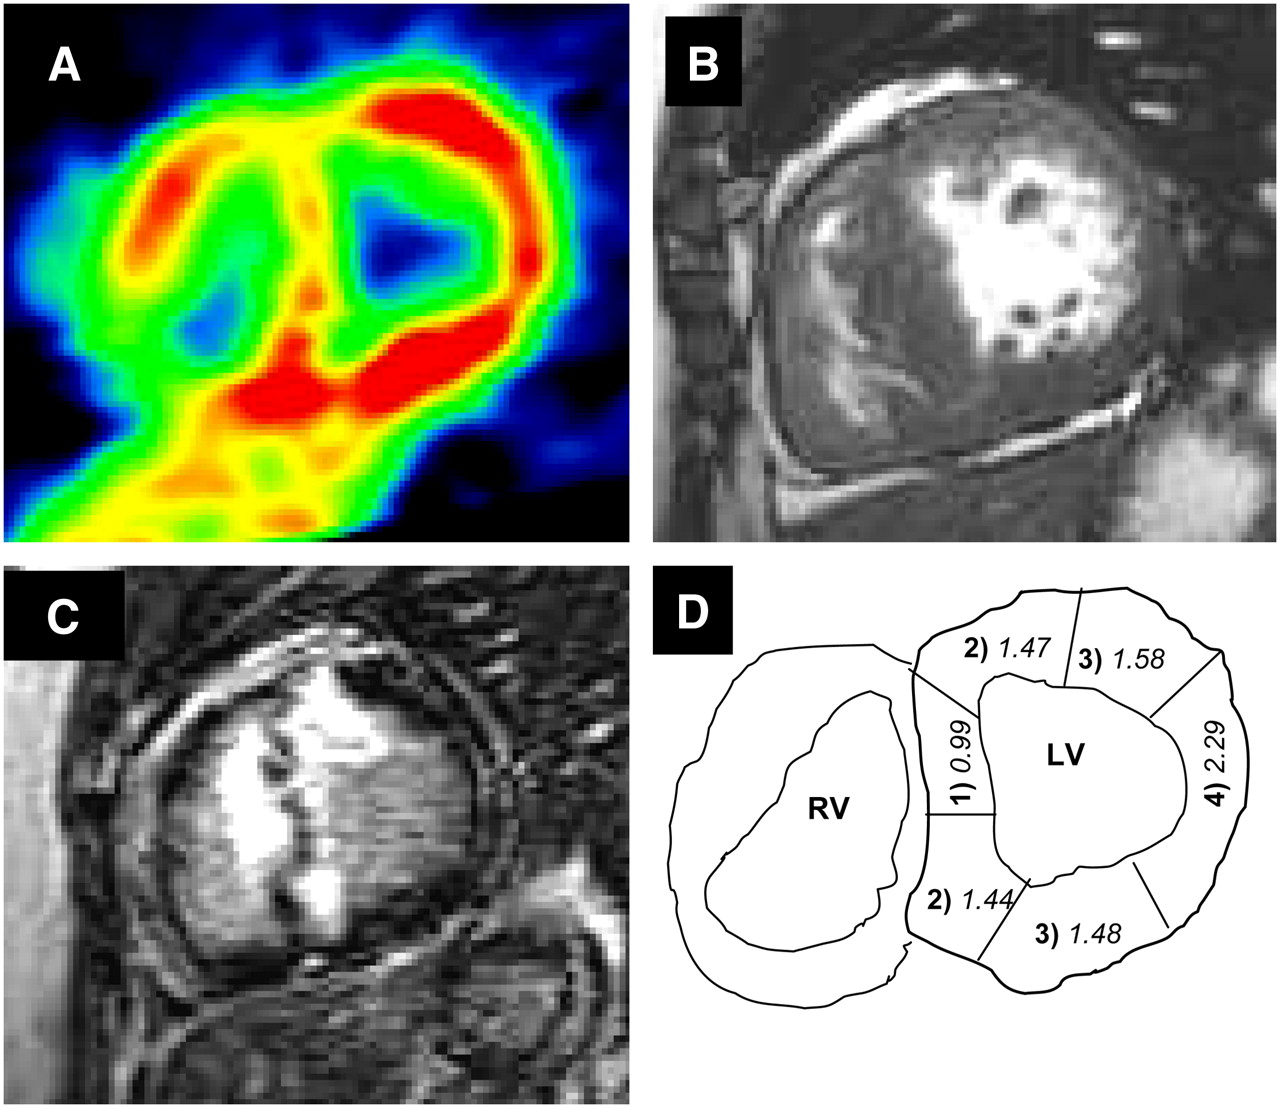
Relationship of hMBF to DCE in 28-y-old woman with HCM. (A) NH3 PET short-axis slice at level of basal LV segments. Color scale shows highest values of flow in red and lowest in green. (B) First-pass MRI short-axis slice at base of left ventricle, showing diffuse septal hypertrophy. (C) After gadolinium infusion, extensive DCE is evident (white signal), involving interventricular septum and extending into anterior wall. DCE and areas of reduced flow at PET closely agree. (D) Diagram illustrating nomenclature used for classification of myocardial segments with extent and proximity of DCE as follows: (1) transmural DCE, (2) nontransmural DCE, (3) without DCE but contiguous to DCE segments, (4) without DCE and remote from DCE. Numbers in italic indicate hMBF (mL/min/g) in segment. RV = right ventricle.
Relationship Between hMBF and DCE
Of the 194 DCE segments, 40 showed DCE-T and 154 showed DCE-NT. Of the remaining 384 segments without DCE, 204 were NoDCE-C and 180 were NoDCE-R. Average hMBF was significantly different between the group with and the group without DCE (1.81 ± 0.94 vs. 2.13 ± 1.11 mL/min/g, respectively; P < 0.001). Within DCE segments, hMBF was significantly lower in DCE-T than in DCE-NT segments (1.43 ± 0.52 vs. 1.91 ± 1.0 mL/min/g, respectively; P < 0.001). Within NoDCE segments, hMBF in NoDCE-C was significantly lower than that in NoDCE-R segments (1.98 ± 1.10 vs. 2.29 ± 1.10 mL/min/g, respectively; P < 0.01). Virtually identical average hMBF was registered between DCE-NT and NoDCE-C segments.
According to ANOVA, a significant overall difference in hMBF was observed among the 4 subgroups (F = 8.6, P < 0.0001). In the post hoc comparisons, a significant difference was observed between NoDCE-R and all other subgroups and between NoDCE-C and DCE-T but was not observed between NoDCE-C and DCE-NT or between DCE-T and DCE-NT (Fig. 2). A significant inverse correlation between hMBF and percentage transmurality of DCE (Spearman ρ = −0.17, P < 0.0001) was demonstrated. Finally, severe coronary microvascular dysfunction (average hMBF in the lowest tertile for the whole study group) was more prevalent among NoDCE-C than NoDCE-R segments (33% vs. 24%, respectively; P < 0.05).

Bar graph of hMBF in LV segments grouped according to severity and proximity of DCE, showing statistical differences according to ANOVA post hoc test.
Impact on Regional Function
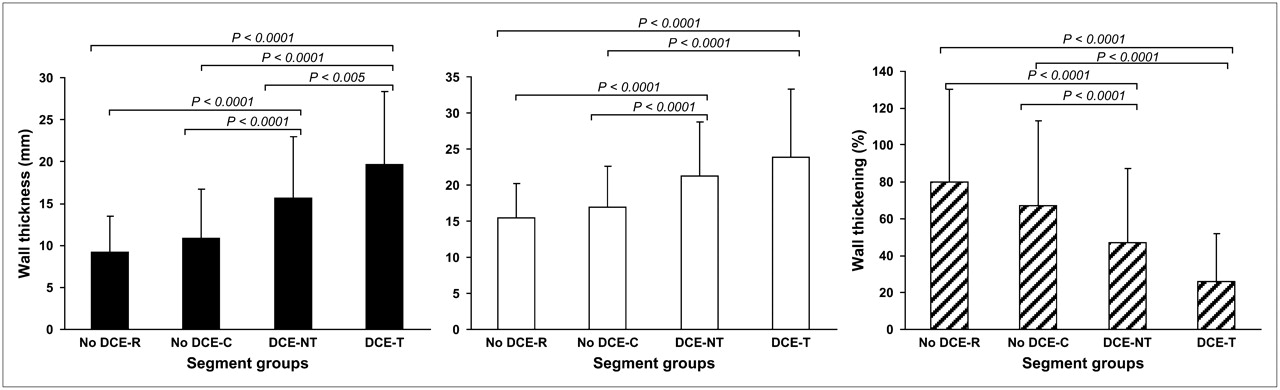
Both ED and ES wall thickness values were significantly greater in segments with DCE than in those segments without DCE (Table 2). Conversely, percentage systolic wall thickening was significantly impaired in DCE segments (Table 2). A highly significant difference among the 4 subgroups was registered for all 3 parameters (ANOVA: F = 56.5, P < 0.00001; F = 35.5, P < 0.00001; and F = 24.7, P < 0.00001, for ED thickness, ES thickness, and systolic thickening, respectively). In the post hoc comparisons, systolic thickening was significantly reduced in the 2 subgroups of segments with DCE compared with those without DCE, but no internal differences within each group was demonstrated (i.e., NoDCE-R vs. NoDCE-C and DCE-T vs. DCE-NT segments) (Fig. 3). A significant direct correlation between hMBF and systolic thickening (Spearman ρ = 0.20, P < 0.0001) was evident. Conversely, the percentage transmurality of DCE showed a strong inverse relationship to systolic thickening (Spearman ρ = −0.37, P < 0.0001).

Bar graphs of ED wall thickness (black bars), ES wall thickness (white bars), and systolic thickening (hatched bars) in LV segments grouped according to severity and proximity of DCE, showing statistical differences according to ANOVA post hoc test.
Segmental ED and ES Wall Thickness and Systolic Thickening of the Segments With and Without DCE
DISCUSSION
The present study investigated the relationship between coronary microvascular dysfunction and fibrosis in patients with HCM. DCE by MRI is presently considered the most accurate method to evaluate myocardial fibrosis in vivo. With its high spatial resolution, contrast MRI has the unique advantage of allowing visualization of microinfarcts that cannot be detected by other noninvasive imaging techniques (32). In our patients, fibrosis was common and, in agreement with prior studies, had a marked preferential localization at the most hypertrophied segments and at midwall level (15,16,33). This pattern clearly differs from that observed in patients with coronary artery disease because the latter is generally associated with reduced myocardial wall thickness and always involves the subendocardial region (32,34).
hMBF in segments without DCE is lower if they are located close to DCE segments than if the segments are remote from fibrotic areas. Average hMBF in these contiguous but DCE-free segments was virtually identical to that of segments with nontransmural DCE. These findings are consistent with the view that DCE may largely represent replacement fibrosis secondary to coronary microvascular dysfunction and ischemia. The additional observation of a strong relationship between impairment of hMBF, transmurality of DCE, and reduction in regional systolic wall thickening lends further corroboration to such a scenario.
Indeed, we demonstrated a continuum of coronary microvascular dysfunction ranging from regions with normal or near-normal wall thickness, in which hMBF is relatively preserved and DCE absent, to regions with greater hypertrophy, in which perfusion is increasingly impaired and DCE becomes progressively more frequent and extensive. Therefore, our data support the hypothesis that coronary microvascular dysfunction is a more widespread phenomenon than myocardial fibrosis in patients with HCM and may contribute to the development of fibrosis itself (11,35–37).
Coronary microvascular dysfunction is a diffuse phenomenon in HCM and is not confined to the hypertrophied regions of the left ventricle (12,18), although it does correlate in severity with the magnitude of segmental hypertrophy (33) and may have considerable regional heterogeneity (13,18). Pathologic reports have demonstrated that focal myocardial fibrosis, a common finding in patients with HCM (3,6,7), may be associated with evidence of ischemia (11). When marked, fibrosis is thought to represent one of the relevant substrates for end-stage progression and heart failure (35), as well as sudden cardiac death (36,37). Recently, Knaapen et al. observed that the extent of DCE in patients with HCM was inversely related to absolute resting perfusion, measured by 15O-labeled tracers (24). The authors concluded that regional heterogeneity of resting perfusion is related to the extent of fibrosis (24). In a previous study, however, the same authors had demonstrated that the water-perfusable tissue index was not decreased in the septum of patients with HCM with DCE and concluded that fibrosis is not the sole cause of DCE in these patients (23). Using MRI, Petersen et al. have shown that perfusion reserve is reduced in HCM independently of the presence of DCE (33). Our results expand the observation by Knaapen et al. (24) by demonstrating an inverse relationship between DCE severity and hMBF. Moreover, the finding that MBF may be reduced in segments without detectable DCE, significant hypertrophy, or systolic dysfunction but located close to DCE regions confirms that coronary microvascular dysfunction extends beyond the limits of DCE and probably precedes it. Therefore, our data and those by Petersen et al. (33) point to coronary microvascular dysfunction as a more diffuse abnormality than DCE in HCM and support the hypothesis that coronary microvascular dysfunction could contribute to the subsequent development of fibrosis in HCM, probably mediated by recurrent ischemia. The opposite view that coronary microvascular dysfunction may be a consequence, rather than a cause, of myocardial fibrosis (24) may not be discounted in individual patients but appears to be less relevant in the general HCM population (3–5,38). Further investigations are needed to demonstrate beyond doubt that coronary microvascular dysfunction is the main substrate for fibrosis in HCM. Moreover, different causes of DCE other than replacement fibrosis could be important in these patients and deserve additional studies (15).
Our results differ from those of Knaapen et al. about the interaction between MBF, DCE, and systolic function. Knaapen et al. demonstrated a significant inverse correlation between DCE extent and degree of regional systolic function and the lack of any relationship between resting MBF and regional function (24). In our series, we confirmed their findings by demonstrating an inverse relationship between DCE severity and ES thickening but also registered a significant direct correlation between this parameter and hMBF. Various explanations can be given for this apparent disagreement, including different methodologies in measuring microvascular and regional systolic function (24,29,32). In particular, the use of systolic thickening in patients with hypertrophy can be problematic because the increased diastolic thickness can spuriously reduce this parameter. However, this parameter has already been used to assess regional function in the setting of HCM (16). Because patients with DCE have reduced wall thickening and thicker walls than do patients without DCE (39), hypertrophic segments with more DCE contract less effectively because of more extensive structural remodeling and not just because they are thicker.
Another technical limitation of our study is that we did not correct our hMBF measurements for the partial-volume effect. It must be considered, however, that the influence of the partial-volume effect on MBF measurements in patients with HCM is less critical than in healthy subjects, because myocardial walls are thicker and frequently well above the PET scanner resolution (40). In our particular patient population with more extensive DCE in thicker segments, the choice not to perform the correction for the partial-volume effect can be regarded as conservative.
CONCLUSION
In our HCM cohort, hMBF was reduced in myocardial segments exhibiting DCE, especially when transmural. In segments without DCE, hMBF was blunted in those segments contiguous to DCE, showing values similar to those of nontransmural DCE segments. These results support the concept that increasing degrees of coronary microvascular dysfunction might play a causative role in the development of myocardial fibrosis in HCM.
Acknowledgments
This study was supported by grants from the Italian Ministry for Scientific and Technologic Research (MURST—COFIN 2004) and the Fondazione Ente Cassa di Risparmio di Firenze.
Footnotes
-
COPYRIGHT © 2008 by the Society of Nuclear Medicine, Inc.
References
- Received for publication December 20, 2007.
- Accepted for publication March 6, 2008.


Jump to section
Related Articles
Cited By...
- Inline perfusion mapping provides insights into the disease mechanism in hypertrophic cardiomyopathy
- Genotype-Positive Status in Patients With Hypertrophic Cardiomyopathy Is Associated With Higher Rates of Heart Failure Events
- Stress Hypoperfusion and Tissue Injury in Hypertrophic Cardiomyopathy: Spatial Characterization Using High-Resolution 3-Tesla Magnetic Resonance Imaging
- Relationship of Delayed Enhancement by Magnetic Resonance to Myocardial Perfusion by Positron Emission Tomography in Hypertrophic Cardiomyopathy
- Microvascular Function Is Selectively Impaired in Patients With Hypertrophic Cardiomyopathy and Sarcomere Myofilament Gene Mutations
- Disease Pathways and Novel Therapeutic Targets in Hypertrophic Cardiomyopathy
- Clinical Features and Outcome of Hypertrophic Cardiomyopathy Associated With Triple Sarcomere Protein Gene Mutations
- The Case for Myocardial Ischemia in Hypertrophic Cardiomyopathy