


Abstract
Compromised regional cerebral blood flow (rCBF) in major depressive disorder may be partly reversed by successful antidepressant treatment. However, it is not known if the reversal of rCBF compromise is dependant on the mode of antidepressant treatment. The current study aimed to address this question. Methods: Thirty-three patients (19 women and 14 men; mean age ± SD, 53 ± 16 y) with moderate major depressive disorder were studied before 6 wk of treatment with tricyclic antidepressants, selective serotonin reuptake inhibitors, or a course of electroconvulsive therapy, and 31 of these patients were also studied afterward. A comparison group of 25 healthy volunteers (13 women and 12 men; mean age, 49 ± 15 y) were studied once. rCBF was assessed using 99mTc-hexamethylpropyleneamine oxime SPECT. Images were analyzed using globally normalized statistical parametric mapping localized to the Montreal Neurologic Institute brain atlas. Results: Baseline rCBF was lower in depressed patients than in controls in the frontal cortex and subcortical nuclei bilaterally. A response to medication was associated with normalization of rCBF deficits, whereas a response to electroconvulsive therapy was associated with an additional rCBF decrease in the parietotemporal and cerebellar regions bilaterally. Conclusion: Hypoperfusion in major depressive disorder largely normalizes after a response to pharmacotherapy. Perfusion changes after a response to electroconvulsive therapy may follow a different course.
Early functional neuroimaging studies comparing healthy and depressed subjects reported decreases in regional cerebral blood flow (rCBF) and metabolism typically in the frontal and prefrontal regions but also in temporal, parietal, and limbic-subcortical structures (1–3). More recent studies have presented a more diverse and complex picture, replicating but also extending the findings of earlier studies (1,2). These studies distinguished between ventral frontal and prefrontal regions that display increased metabolism or perfusion in depressed patients and more rostral regions within the cingulate gyrus and dorsolateral prefrontal cortex that show decreased perfusion. In other regions postulated to play a role in the pathophysiology of depression, such as the limbic and paralimbic regions and the basal ganglia, findings have been inconsistent (1,2). This diversity in brain imaging findings may reflect the heterogeneity between studies in age of subjects, group size, male-to-female ratio, subtype and severity of psychopathology, and medication status. The choice of imaging technique, radiopharmaceutical, acquisition parameters, and processing parameters also have varied considerably, as have the method of data analysis and choice of reference region.
rCBF alterations in depression generally normalize after a response to treatment with medication, interpersonal psychotherapy, or a placebo (2,4) (but a different pattern of perfusion changes is seen in response to venlafaxine (5) or cognitive behavioral therapy (6)). Less consistency is found regarding the reversibility of abnormalities in rCBF and in cerebral metabolic rate for glucose in depression after electroconvulsive therapy (ECT). Studies that addressed the immediate and acute effects of ECT (e.g., 30 min to 24 h after treatment) disclosed mainly reductions in rCBF and cerebral metabolic rate, whereas when imaging took place some days after ECT, reversal of major depressive disorder (MDD) abnormalities was often found (7–9). Still, even when imaging was performed at the later stage, reductions (10) or no change (11) in rCBF or cerebral metabolic rate were noted. Thus, it is unclear which perfusion impairments in major depression are state markers and which, if any, are enduring “trait” phenomena.
In the present study, we first established the presence of rCBF anomalies in a group of depressed patients relative to a healthy control group and then compared the effects of diverse antidepressant treatment (tricyclic antidepressants [TCAs] and selective serotonin reuptake inhibitors [SSRIs]) and ECT on these perfusion deficits.
MATERIALS AND METHODS
Subjects
Thirty-three inpatients and outpatients (19 women and 14 men; mean age ± SD, 53 ± 16 y) with MDD (DSM-IV criteria (12)) participated in the study. Inclusion criteria were a score of at least 18 (27.6 ± 5.5) on the 21-item Hamilton Depression Rating Scale (13), 27 on the Mini-Mental State Examination (14), and no more than 2 on the Hachinski ischemia index (15). The Structured Clinical Interview for DSM-IV (16) was used to evaluate the presence of concurrent and lifetime DSM-IV axis I disorders. The patients had no DSM-IV axis I comorbidity preceding MDD. Diagnoses of panic and generalized anxiety disorders were allowed only if symptoms began after MDD had been diagnosed. The patients had been free of psychotropic medication for at least 2 wk, and of short-term hypnotics for at least 1 night, before undergoing SPECT (no patient had been treated with fluoxetine before inclusion in the study). Additional exclusion criteria were ECT within the past 6 mo, a current or past neurologic disorder (including head trauma involving loss of consciousness or amnesia for longer than 24 h), and current or past alcohol or substance abuse or dependence. A group of 25 healthy volunteers (13 women and 12 men; mean age, 49 ± 15 y) served as controls for the depressed patients. All participants underwent routine physical and blood examinations. All received a comprehensive description of the study and provided written informed consent. The research protocol was approved by the Hadassah-Hebrew University internal review board.
The first SPECT evaluation was done immediately before treatment with antidepressants or ECT. The choice of treatment was based on clinical considerations. Patients who were drug-naïve or had previously responded favorably to this class of medication were treated with SSRIs. Patients who had previously responded favorably to TCAs or who did not respond to SSRIs before inclusion in the study were treated with TCAs. Thirteen patients were treated with SSRIs (8 with paroxetine, 31 ± 7 mg/d; 3 with fluoxetine, 30 ± 8 mg/d; and 2 with citalopram, 20 mg/d [SSRI group]). Eleven patients were treated with tri- or tetracyclics (7 with clomipramine, 164 ± 33 mg/d; 2 with nortriptyline, 88 ± 17 mg/d; 1 with desipramine, 150 mg/d; and 1 with mianserin, 60 mg/d [TCA group]). Nine patients were treated with ECT (8 had received treatment with ECT during previous episodes and relapsed while on maintenance, and 1 was treated with ECT after no response to diverse pharmacotherapy during the current episode [ECT group]); all ECT-treated patients were also drug-free for more than 2 wk. Hamilton scores were similar in all treatment groups (SSRI group: 28 ± 7; TCA group: 26 ± 5; ECT group: 27 ± 4). All subjects underwent MRI to rule out structural brain abnormalities. All control subjects had Hamilton scores of 7 or less. ECT-treated patients were significantly older than medication-treated patients (68 ± 8 y vs. 50 ± 16 y, P < 0.01) and were predominantly female (6 of 8 patients whose data were available for analysis were female).
For ECT, a mobile electroconvulsive therapy apparatus (Mecta SR-1; Mecta Corp.) was used, with bilateral frontotemporal electrode placement and twice-weekly treatment (average, 9.9 ± 1.9 treatments). The dosage was titrated at the first ECT session to establish the seizure threshold. Thereafter, stimulus parameters were set at 2.5 times the threshold and increased as required to achieve a clinical seizure duration of more than 20 s in a cuffed lower limb or an electroencephalographic seizure duration of more than 25 s.
A second SPECT and psychometric evaluation was performed on MDD patients 1 wk (7 ± 2 d) after 6 wk of medication or completion of the ECT course (7 ± 1 wk after the initial SPECT evaluation). The technical quality of 2 posttreatment scans (1 each from the SSRI- and ECT-treated groups) was not suitable for data processing. Thus, only data from 31 patients with MDD were available for the pre- vs. posttreatment image analysis. Treatment response was defined as a reduction of at least 50% in Hamilton score. Nine of 12 patients treated with SSRIs, 8 of 11 patients treated with TCAs, and 7 of 8 patients treated with ECT responded to treatment (Hamilton scores: 5.3 ± 2.1, 5.1 ± 2, and 4.4 ± 1.6, respectively).
SPECT
SPECT was performed between 9:00 and 10:00 am. Images were obtained with a double-head γ-camera (Helix; Elscint) with 2 rectangular 540 × 400 mm field-of-view detectors, equipped with low-energy, ultra-flared fanbeam collimators. Twenty millicuries (740 MBq) of 99mTc-hexamethylpropyleneamine oxime (HMPAO) were injected into each subject 20 min after placement of an indwelling intravenous catheter, while the subject rested supine in a quiet, darkened room, with the head immobilized, eyes open, and ears unplugged. Sixty projections were obtained over 360°, with a 25-s acquisition time per projection. Corrections were made for the center of rotation, isotope decay, sensitivity, and scanning velocity. Processing included spatial normalization, backprojection, filtering, transaxial reconstruction, and attenuation correction (Chang method). The transaxial datasets were reconstructed with 1-pixel-thick (3.655-mm) slices using ramp-filtered backprojection. Identical reconstruction parameters were applied for the 99mTc-HMPAO SPECT images of the medication and ECT groups.
Data Analysis: Statistical Parametric Mapping (SPM)
SPM software (http://www.fil.ion.ucl.ac.uk/spm/software/spm2/; Wellcome Department of Cognitive Neurology), implemented on a MATLAB platform (The MathWorks, Inc.), was used to analyze the images. SPM analyzes images on a voxel-by-voxel basis, testing for brain regions according to user-defined hypotheses. Images were prepared for SPM analysis by realignment to the Montreal Neurologic Institute brain atlas, resampling to a pixel size of 2 × 2 × 2 mm, and smoothing with an isotropic gaussian kernel (full width at half maximum, 10 mm). Each image was normalized to the mean total activity within the brain. Pixels below 80% of the global mean were excluded from subsequent analysis. Unpaired t tests were then performed to compare subject groups (depressed vs. healthy groups and groups of different treatment types), and paired t tests were used to compare pre- and posttreatment scans of the same subjects within each patient group or subgroup (all depressed patients, all responders, or treatment-type subgroups). Because ECT-treated patients were significantly older than medication-treated patients and predominantly female, all analyses that involved ECT-treated patients were age- and sex-corrected. The general linear model was used to test for group (treatment type) by condition (pretreatment/posttreatment) interaction. For identifying regions of statistical significance, the initial voxel threshold was set at P < 0.05 and the minimum cluster extent was 30 voxels; only clusters with a corrected significance level of P < 0.01 are reported. All locations are reported in Montreal Neurologic Institute coordinates. Main structures in regions of higher rCBF reported in the next section and in Table 1 are defined as those in which more than 30% of the structure was included within a significant cluster of voxels.
Between- and Within-Group Comparisons Before and After Treatment
RESULTS
Compared with healthy controls, depressed patients had a significantly lower rCBF before treatment over much of the frontal lobes (medial, orbitofrontal, and dorsolateral cortices), the insular cortex, part of the temporal lobe (transverse temporal gyrus), and the subcortical nuclei (including the caudate, amygdala, thalamus, and hypothalamus; P < 0.001; Table 1). In no brain region was rCBF higher in depressed patients. Similar findings were observed in comparisons between controls and patients subsequently treated with SSRIs, TCAs, or ECT (P < 0.001). No perfusion differences were found before treatment between patients treated with SSRIs, patients treated with TCAs, and patients treated with ECT.
After treatment, a significant increase in rCBF was found in a circumscribed area in the right parietal lobe of depressed patients (P = 0.001). This difference became more prominent once the comparison was limited to patients who responded to treatment (P < 0.001). No perfusion changes were found in nonresponders. Further categorization of the treatment-responsive depressed patients into those treated with TCAs, SSRIs, or ECT revealed similar and widespread posttreatment perfusion increases in patients treated with TCAs or SSRIs and decreases in rCBF in the posterior brain regions of ECT-treated patients. No perfusion differences were found between medication responders and controls. In contrast, rCBF was still lower in ECT responders than in controls, in the same regions as before treatment as well as in the occipital and cerebellar regions (P < 0.001). Because no differences in rCBF were found between patients who responded to SSRIs and TCAs both before and after treatment, medication-treated patients were combined to increase power in further analyses.
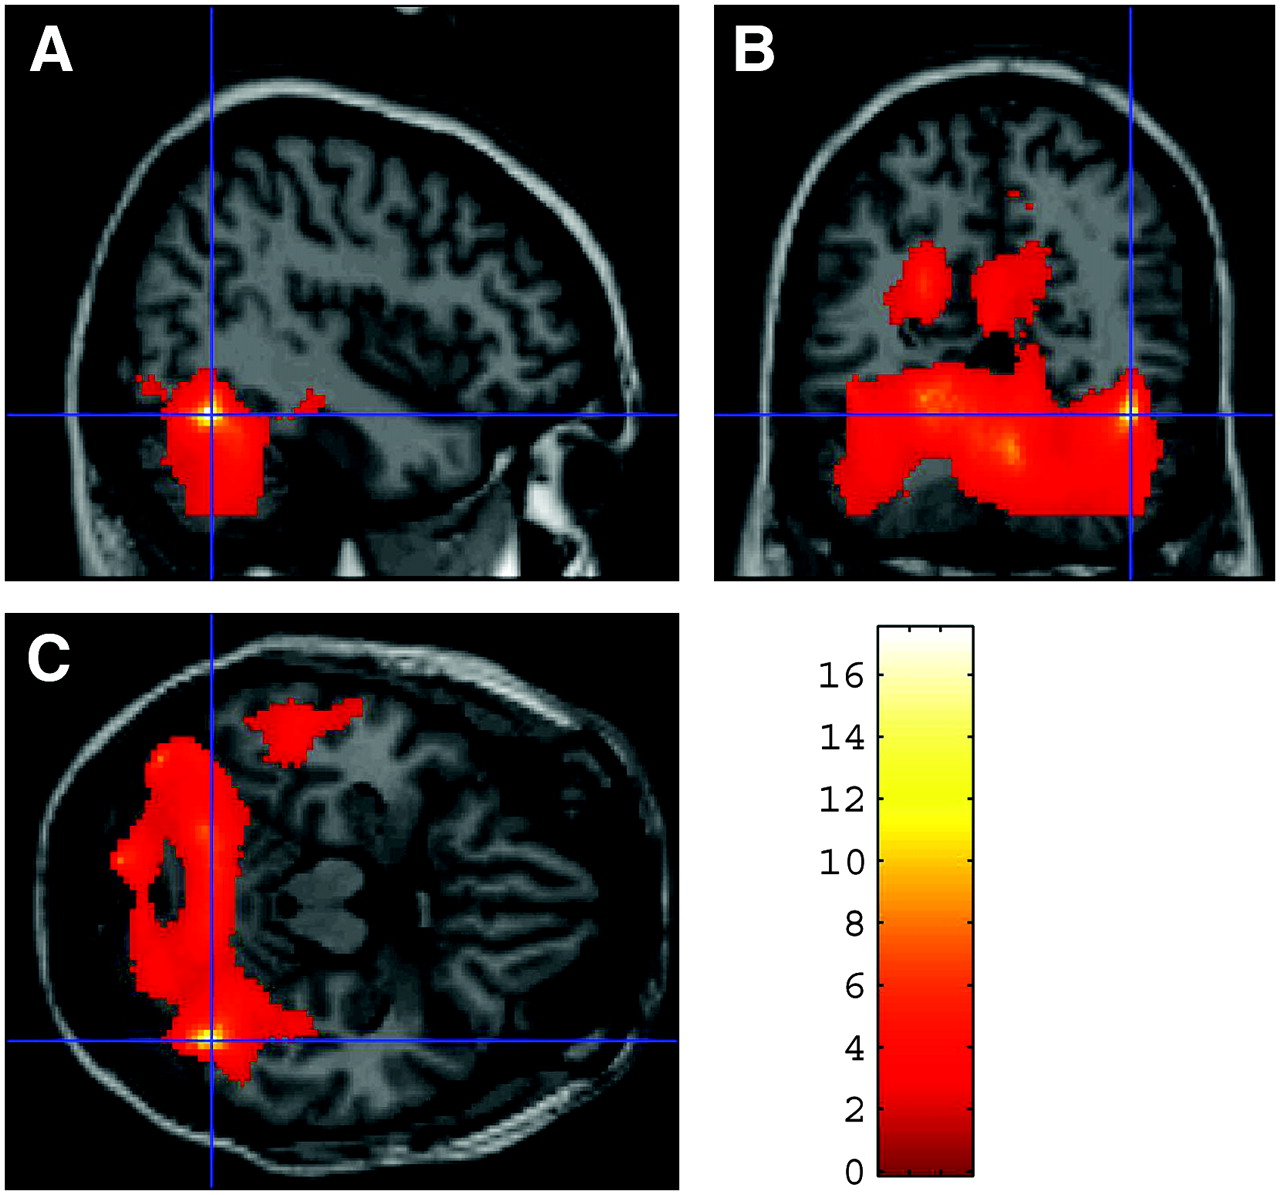
ANOVA with repeated measures revealed a significant group (medication responders/ECT responders) by condition (pretreatment/posttreatment) interaction bilaterally in the temporal, parietal, occipital, and cerebellar regions (P < 0.001). Medication responders showed a bilateral increase in rCBF in the frontal, temporal, parietal, occipital, and medial cerebellar cortices (P < 0.001; Fig. 1), whereas patients who responded to ECT showed a bilateral decrease in rCBF in the parietotemporal and cerebellar cortices (P < 0.001; Fig. 2).

Brain regions exhibiting higher perfusion in depressed patients who responded to medication: posttreatment vs. pretreatment comparison of sagittal plane (A), coronal plane (B), and transaxial plane (C) through voxel of maximal difference (42, −32, 46). Images were obtained by SPM analysis.
Brain regions exhibiting higher perfusion in depressed patients who responded to ECT: pretreatment vs. posttreatment comparison of sagittal plane (A), coronal plane (B), and transaxial plane (C) through voxel of maximal difference (44, −60, −20). Images were obtained by SPM analysis.
DISCUSSION
Our findings suggest that rCBF deficits in depression largely normalize in patients who respond to pharmacotherapy but not in patients who respond to ECT. Consistent with previous reports, rCBF in depressed patients before treatment was lower than in healthy controls, and a response to medication was associated with an increase in cerebral perfusion (2,3). Patients who responded to treatment and those who did not respond were treated with similar types and doses of medication, suggesting that increased perfusion is related to the change in clinical status rather than being the effect of medication per se. Our previous work showing no changes in rCBF in healthy controls treated with fluoxetine (17) supports this impression. Partial or full normalization of reduced cerebral perfusion in response to antidepressant medication is consistent with the possibility that perfusion deficits are a state marker for depression.
In contrast to the effect of medication on rCBF, a response to ECT was associated with a bilateral decrease in rCBF in the parietotemporal and cerebellar cortices. The finding of reduced brain function after ECT is consistent with the hypothesis that recruitment of endogenous inhibitory processes to terminate the seizure is an important short-term effect related to the therapeutic action of ECT (18). Because only 1 ECT-treated patient did not respond, it is impossible to determine whether reduced perfusion after response to ECT is related to the procedure, clinical response, or both. It is also unknown if reduced parietotemporal and cerebellar perfusion in ECT responders persists or is limited to the peri-ECT period. Larger-scale studies will be needed to clarify these questions.
Reports of rCBF changes after ECT are inconsistent. In fact, our current findings contradict a previous report by our own group (19). Data in that study were analyzed by the region-of-interest method, with the cerebellum as a reference region. Interestingly, all studies reporting a reduction in rCBF or brain metabolism after ECT used 18F-FDG PET or 133Xe inhalation SPECT, whereas studies reporting increased perfusion were performed using HMPAO or ethyl cysteinate dimer SPECT. Furthermore, all studies that found increases in rCBF after ECT used the region-of-interest method with the cerebellum as a reference region for data analysis. In the current study, we found a decrease in cerebellar perfusion after ECT using SPM for data analysis. We hypothesized that application of region-of-interest analysis with the cerebellum as the reference region would yield increases in rCBF on this dataset too, and we reanalyzed our data accordingly. Increases in perfusion after ECT were observed throughout the brain, reaching trend significance levels for the parietal (P = 0.06), temporal (P = 0.08), and anterior cingulate (P = 0.09) regions, compatible with our earlier study. These findings are congruent with an HMPAO SPECT study (20) that reported discrepant results when using region-of-interest analysis with the cerebellum as a reference area and globally normalized SPM analyses to study depressed patients before and after ECT. Although not traditionally considered a major contributor to the neurocircuitry of mood regulation, cerebellar dysfunction is known to have an impact on cognition and affect, modulating neural circuits linking prefrontal, posterior parietal, superior temporal, and limbic cortices (21). Cerebellar involvement in depression neurocircuitry casts doubt on the validity of previous neuroimaging studies using region-of-interest analysis with the cerebellum as a reference region.
The present study had certain limitations. Subdividing our cohort into smaller groups using response and treatment modality as grouping factors limited the power of our study, potentially inducing type II error. Still, the differences we found appeared to be widespread and robust. Furthermore, additional safeguards were used to prevent random error, including adjustment for age and sex differences (in comparisons between ECT- and medication-treated patients) and the setting of lower-than-normal thresholds for statistical significance.
Another limitation of this study was that it did not apply linearization correction for nonlinearity in correlations between 99mTc-HMPAO uptake values and rCBF. However, linearization correction (22) is of the greatest importance in high-flow cortical regions and can even be detrimental by underestimating rCBF levels in low-flow areas (23) and, thus, possibly in the areas of reduced flow that were of interest in our study.
CONCLUSION
We have presented data replicating findings of reduced cerebral perfusion in depression. We have shown that this reduction normalizes after successful treatment with antidepressant medication. This finding is in contrast to the further reductions in rCBF found in posterior brain regions after a response to ECT. Full restoration of premorbid levels of mood and function after a major depressive episode requires more time than that which elapsed between our first and second SPECT scans. Therefore, long-term, large-scale studies are needed to document the course of rCBF changes, if any, in depressed patients during the time between an immediate response to treatment and a return to full, satisfying remission.
Acknowledgments
This study was funded by a grant from the Israel National Academy of Sciences to one of the authors.
Footnotes
-
COPYRIGHT © 2007 by the Society of Nuclear Medicine, Inc.
References
- Received for publication March 16, 2006.
- Accepted for publication May 15, 2007.


