


Abstract
The aim of this study was to investigate whether compartmental modeling of 1-11C-glucose PET kinetics can be used for noninvasive measurements of myocardial glucose metabolism beyond its initial extraction. Methods: 1-11C-Glucose and U-13C-glucose were injected simultaneously into 22 mongrel dogs under a wide range of metabolic states; this was followed by 1 h of PET data acquisition. Heart tissue samples were analyzed for 13C-glycogen content (nmol/g). Arterial and coronary sinus blood samples (ART/CS) were analyzed for glucose (μmol/mL), 11C-glucose, 11CO2, and 11C-total acidic metabolites (11C-lactate [LA] + 11CO2) (counts/min/mL) and were used to calculate myocardial fractions of (a) glucose and 1-11C-glucose extractions, EF(GLU) and EF(11C-GLU); (b) 11C-GLU and 11C-LA oxidation, OF(11C-GLU) and OF(11C-LA); (c) 11C-glycolsysis, GCF(11C-GLU); and (d) 11C-glycogen content, GNF(11C-GLU). On the basis of these measurements, a compartmental model (M) that accounts for the contribution of exogenous 11C-LA to myocardial 11C activity was implemented to measure M-EF(GLU), M-GCF(GLU), M-OF(GLU), M-GNF(GLU), and the fraction of myocardial glucose stored as glycogen M-GNF(GLU)/M-EF(GLU)). Results: ART/CS data showed the following: (a) A strong correlation was found between EF(11C-GLU) and EF(GLU) (r = 0.92, P < 0.0001; slope = 0.95, P = not significantly different from 1). (b) In interventions with high glucose extraction and oxidation, the contribution of OF(11C-GLU) to total oxidation was higher than that of OF(11C-LA) (P < 0.01). In contrast, in interventions in which glucose uptake and oxidation were inhibited, OF(11C-LA) was higher than OF(11C-GLU) (P < 0.05). (c) A strong correlation was found between GNF(11C-GLU)/EF(GLU) and direct measurements of fractional 13C-glycogen content, (r = 0.96, P < 0.0001). Model-derived PET measurements of M-EF(GLU), M-GCF(GLU), and M-OF(GLU) strongly correlated with EF(GLU) (slope = 0.92, r = 0.95, P < 0.0001), GCF(11C-GLU) (slope = 0.79, r = 0.97, P < 0.0001), and OF(11C-GLU) (slope = 0.70, r = 0.96, P < 0.0001), respectively. M-GNF(GLU)/M-EF(GLU) strongly correlated with fractional 13C-content (r = 0.92, P < 0.0001). Conclusion: Under nonischemic conditions, it is feasible to measure myocardial glucose metabolism noninvasively beyond its initial extraction with PET using 1-11C-glucose and a compartmental modeling approach that takes into account uptake and oxidation of secondarily labeled exogenous 11C-lactate.
Perturbations in myocardial glucose metabolism occur in various diseases and states (1–10). Thus, accurate measurements of myocardial glucose metabolism are necessary to better understand the physiology or pathophysiology of these processes and to evaluate novel therapies designed to ameliorate detrimental effects on cardiac function. Previously, we have validated the method for noninvasive measurement of myocardial glucose uptake by PET using an appropriate compartmental model of myocardial 1-11C-glucose kinetics (11,12). Glucose radiolabeled in the carbon-1 position has the identical metabolic fate in myocardium as that of unlabeled glucose. Consequently, no assumptions are needed with regard to the metabolic fate of 1-11C-glucose relative to unlabeled glucose. However, thus far, these measurements have been limited to the quantification of glucose uptake and do not provide information about the further metabolism of extracted glucose. Accordingly, the purpose of this study was to investigate whether compartmental modeling of PET 1-11C-glucose kinetics could be used for noninvasive measurements of myocardial glucose metabolism beyond its initial uptake.
MATERIALS AND METHODS
Experimental Protocol
All animal experiments were conducted in compliance with the Guidelines for the Care and Use of Research Animals established by the Animal Studies Committee at Washington University. The purpose-bred 20- to 25-kg mongrel dogs were fasted and anesthetized and underwent instrumentation as reported previously (11,12). Catheters were placed in the thoracic aorta via the femoral arteries for monitoring of arterial blood pressure and arterial sampling. One femoral vein was cannulated for peripheral sampling and drug administration. Twenty-four dogs were studied under various interventions initiated 60–90 min before imaging (11,12) to achieve a wide range in both myocardial glucose extraction and its metabolic fate—especially its 2 primary pathways, glycolysis and glycogen synthesis. Five dogs were studied fasted (Fast), and 19 were studied during a hyperinsulinemic–euglycemic clamp, which entailed a continuous infusion of insulin (70 mU/kg/h) with an adjustable infusion of 20% dextrose. Of the clamped dogs, 5 were studied at rest (Clamp). To markedly increase glucose use and glycolysis, 5 dogs received concomitant administration of phenylephrine (0.84–1.6 μg/kg/min) (Clamp/PH). To increase glycogen synthesis, 2 interventions were used: 6 dogs received a continuous infusion of 20% Intralipid (Fresenius Kabi Clayton, LP; 1 mL/min) (Clamp/IL), and, in 5 dogs, plasma lactate concentration was increased to approximately 3–3.5 times over normal fasting levels by infusion of sodium l-(+)-lactate diluted in phosphate buffer (0.06 M NaH2PO4 and 0.0134 M Na2HPO4) at a rate of 130 μmol/kg/min (Clamp/LA). Two dogs (1 Clamp/IL and 1 Clamp/LA) were excluded because of hypoglycemia.
All PET studies were performed on a Siemens ECAT 962 HR+ scanner. The electrocardiogram, arterial blood pressure, heart rate, and blood gases were monitored throughout the study. A transmission scan was performed to correct for photon attenuation. To measure myocardial blood flow (MBF, mL/g/min), 15O-water was administered and dynamic PET data were acquired as described previously (13–15). After allowing for decay of 15O radioactivity, a bolus of 1-11C-glucose (740–925 MBq) was administered; this was followed by 60 min of dynamic PET data acquisition and arterial and coronary sinus (ART/CS) sampling. To determine the accuracy of the PET estimates of 1-11C-glucose incorporation into glycogen, 100 μmol/kg of uniformly labeled U-13C-glucose (Cambridge Isotope Laboratories, Inc.) was administered concurrently to label the glycogen pool. U-13C-Glucose was used to achieve measurable enrichment. Simultaneous ART and CS blood samples were obtained at 5, 10, 15, 20, 25, 30, 40, 50, and 60 min after tracer administration for the measurement of 11C-glucose, 11CO2, and 11C-lactate (12). Paired blood samples were also collected to determine plasma substrates (glucose, free fatty acids [FFA], lactate), and insulin at baseline, before 11C injection and at 30 and 60 min of imaging.
After the imaging protocol was completed, the chest was opened via median sternotomy. The pericardium was opened, and the portion of myocardium was raised between the parallel incisions on each side of the main diagonal branch of the left anterior descending artery, freeze-clamped with aluminum tongs cooled in liquid N2, and then stored at −80°C. Animals were euthanized with an overdose of sodium thiopental (at least 60 mg/kg) followed by 60 mL of saturated KCl.
Determination of Circulating Substrate and Insulin Levels
Plasma glucose and lactate levels were determined using a 2300 STAT Plus Analyzer (YSI Life Sciences). Plasma FFA concentrations were measured by an enzymatic colorimetric method (Wako NEFA C kit; Wako Chemicals). Plasma insulin was measured by radioimmunoassay (Linco Research Co.).
Measurement of 11C Plasma Metabolites
1-11C-Glucose was separated from total 11C-acidic metabolites (11C-lactate and 11CO2), using an ion-exchange column (AG1-X4 resin, 100–200 mesh, formate form). 11CO2 and 11C-lactate were separated and counted (counts/min/mL) as described previously (12).
Measurement of Myocardial Glycogen Content and 13C-Glycogen Enrichment
Glycogen was isolated from myocardial tissue samples as described by Stauffacher and Renold (16) and measured using the method of Passonneau et al. (17). U-13C-Glucose enrichment was determined using an Agilent 5973N gas chromatography/mass spectrometry system, monitoring m/z 525 and 519. The amount of 13C-labeled glycogen formed during the study (nmol/g wet weight) was then calculated as the product of the U-13C-glucose enrichment and the total glycogen content. The fraction of myocardial glucose that ended up as glycogen was calculated from these measurements as the ratio of 13C-glycogen to total myocardial glucose used during the PET study ([nmol/g]/[nmol/g]).
PET Image Analysis and MBF Measurements
Myocardial 15O-water and 1-11C-glucose images were analyzed as described previously (13–15) to extract blood and myocardial time–activity curves. Eight regions per study were generated from anterior and lateral myocardium. MBF was quantified from blood and the myocardial time–activity curves generated from myocardial PET images of 15O-water using a compartmental modeling approach developed and validated previously by our group (13–15).
PET Kinetic Modeling
To investigate whether myocardial glucose metabolism beyond its initial uptake could be measured noninvasively by PET using 1-11C-glucose and kinetic modeling, a compartmental modeling approach was evaluated (Fig. 1; Supplemental Appendix B [Supplemental Appendices A and B are available online only at http://jnm.snmjournals.org]). This approach takes into account the contribution of exogenous 11C-lactate to 11C-myocardial activity and was implemented in a stepwise fashion on the basis of the following assumptions: (a) The early myocardial PET kinetics of 1-11C-glucose are not significantly affected by 11C-lactate uptake and oxidation and, therefore, can be used to measure myocardial glucose uptake by a simple compartmental model (step 1, Fig. 1A). (b) The late myocardial kinetics of 1-11C-glucose obtained from PET are contaminated by 11C-lactate metabolism and include metabolic glucose pathways, such as glycogen formation and glycolysis (i.e., glucose oxidation plus lactate production). Thus, to differentiate lactate metabolism from glucose metabolism, a 5-compartment model was implemented by adding 2 compartments to step 1 that describe the contribution of exogenous 11C-lactate to total myocardial 11C-activity (step 2, Fig. 1B). (c) Low levels of arterial 11C-lactate produced from 1-11C-glucose are insufficient to measure accurately myocardial uptake and oxidation of exogenous lactate and, thus, rate constants K5B–k7B are used exclusively to account for the contribution of exogenous 11C-lactate to myocardial 11C kinetics. (d) Because compartment 1 in both steps represents glucose uptake, the rate constants describing glucose uptake and estimated in step 1 (K1A–k3A) were fixed in step 2. This kinetic modeling approach was implemented using 1-11C-glucose and 11C-lactate blood (input functions) and 11C-myocardial time–activity curves obtained from myocardial PET images.
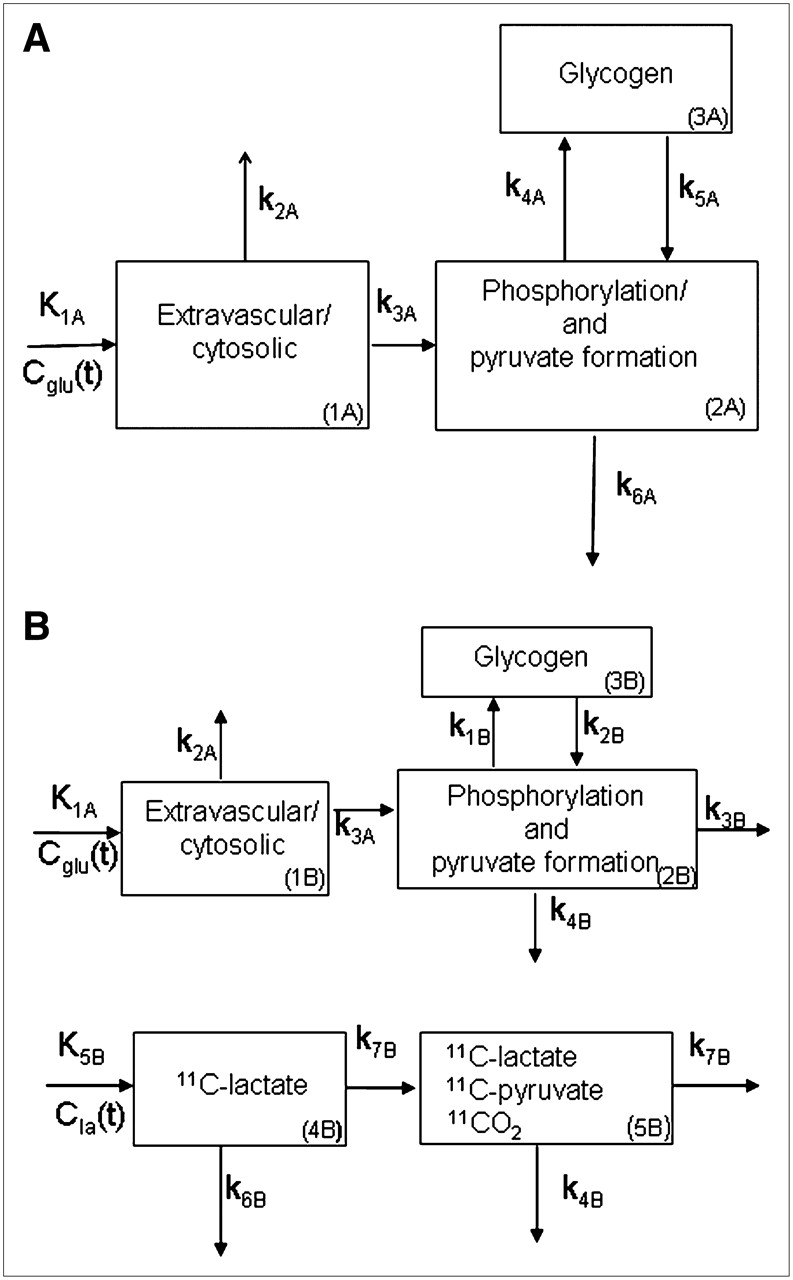
Two-step kinetic model used to quantify myocardial glucose metabolism. (A) Step 1: Cglu(t) = arterial 1-11C-glucose activity (input function, counts/min); K1A = tracer delivery into myocyte (mL/g/min); k2A = tracer washout; k3A = phosphorylation and pyruvate formation; k4A = glycogen formation; k5A = glycogenolysis; and k6A = lactate production + oxidation; k2A–k6A (min−1). (B) Step 2 consists of step 1 plus 2 more compartments representing 11C-lactate uptake and oxidation. Cla(t) = arterial 11C-lactate activity (input function). Rate constants defining 1-11C-glucose uptake were fixed to those obtained from step 1 (K1A, k2A, and k3A). k1B and k2B in step 2 correspond to k4A and k5A in step 1, and k3B and k4B in step 2 correspond to k6A in step 1, with k3B representing glucose oxidation and k4B representing lactate production from glucose. Rate constants K5B–k7B are associated with 11C-lactate metabolism. Rates k4A–k6A were not used to measure glucose metabolism.
Generation of 11C-Glucose and 11C-Lactate Input Functions from PET Blood 11C Activity
The 1-11C-glucose input function (Cglu(t); Fig. 1) was obtained for each study from the PET 11C blood time–activity curve, CPET(t), as follows: (a) Arterial 1-11C-glucose as a fraction of total 11C activity in blood (counts/min/mL) was calculated from each arterial blood sample collected during the PET study by subtracting the contribution of 11C-glucose metabolites (11CO2 + 11C-lactate) from the total 11C activity. (b) A monoexponential function was fitted to this fraction to define the fraction of 1-11C-glucose in blood at any point in time. (c) CPET(t) was then multiplied by the monoexponential function to obtained Cglu(t) at any given time. The lactate input function Cla(t) (Fig. 1) was obtained in a similar fashion, where 11C-lactate in blood was calculated by subtracting 1-11C-glucose and 11CO2 from the total 11C arterial activity.
Calculations and Statistical Analysis
Measurements of myocardial oxygen consumption (MVo2, μmol/g/min) and myocardial 1-11C-glucose metabolism were done from ART and CS concentrations of O2, 1-11C-glucose, 11C-lactate, 11CO2 and MBF measurements using the Fick method. Equations used to calculate 1-11C-glucose metabolism from ART/CS and PET measurements are described in Supplemental Appendices A and B. Myocardial PET measurements generated for 8 ROIs were averaged to obtain one global measurement per study.
Group data are presented as mean ± SD. The differences among interventions were compared by means of 1-way ANOVA, and the differences among interventions with multiple measurements within a study were analyzed by 2-way ANOVA for repeated measurements. For both ANOVA tests, differences were localized by the post hoc Scheffé test. Correlations were calculated by linear regression. A P value of < 0.05 was considered statistically significant.
RESULTS
Hemodynamics, MBF, and MVo2
Heart rate (beats/min) was higher in all Clamp groups (102 ± 15 beats/min) than that in the Fast group (73 ± 15 beats/min; P < 0.05). Systolic blood pressure (mm Hg), diastolic blood pressure (mm Hg), and rate·pressure product (mm Hg·beats/min) did not differ among the 4 groups studied at rest (114 ± 21, 77 ± 16, 10,747 ± 3,072, respectively) and were significantly higher in the Clamp/PH group: 183 ± 16, 136 ± 11, and 18,585 ± 4,011; P < 0.05 vs. all groups). Elevated hemodynamics in Clamp/PH were paralleled by a higher MBF (1.4 ± 0.51), particularly when compared with the Fast group (0.52 ± 0.19; P < 0.05). MVo2 ranged from 6.6 ± 1.3 to 12.5 ± 2.7 and tended to be the highest in the Clamp/PH and Clamp/IL groups.
Plasma Substrates and Myocardial Substrate Use and 13C-Glycogen Content
Table 1 shows the wide range of plasma substrate levels and myocardial substrate extraction and use attained by the study interventions. Plasma FFA levels were the highest in Clamp/IL, resulting in the highest myocardial FFA use levels among all groups. Myocardial glucose extraction and use were the highest in the Clamp/PH group and the lowest in the Fast group. Significant lactate extraction was observed in all groups. The range of interventions performed also resulted in a wide range in myocardial 13C-glycogen content (Table 2), from 18.7 ± 7.7 nmol/g (Clamp/PH) to 133.3 ± 56.4 nmol/g (Clamp/LA). Similarly, there was a wide range in the fraction of myocardial glucose that ended up as glycogen (13C-glycogen/glucose use, %) from 0.014 ± 0.009 (Clamp/PH) to 1.053 ± 0.779 (Fast).
Arterial Substrate Concentration, Myocardial Extraction Fraction, and Utilization
Myocardial Glycogen Measurements
ART/CS Measurements of Fractional Myocardial 1-11C-Glucose Metabolism
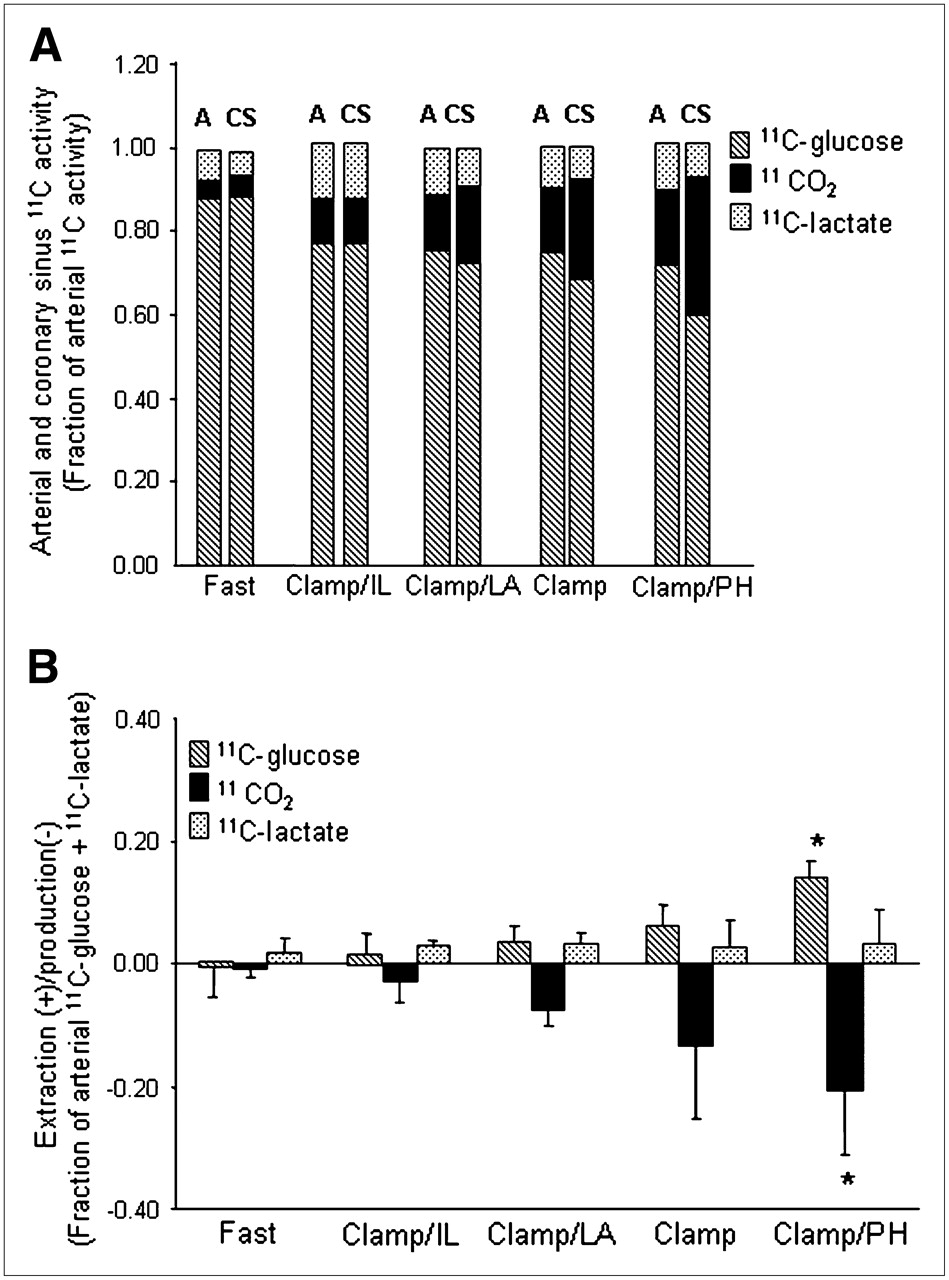
The fractional contributions of 1-11C-glucose and its metabolites to total ART activity are shown in Figure 2A. For all groups combined, 1-11C-glucose represented 0.77 ± 0.07 whereas 11CO2 represented 0.12 ± 0.06, with 11C-lactate contributing 0.11 ± 0.05. Arterial 1-11C-glucose activity was the highest in the Fast study (0.88 ± 0.05) and declined to an average of 0.74 ± 0.04 in all Clamp studies. This pattern was paralleled by a progressive increase in 11CO2 activity with the lowest 11CO2 activity in the Fast group and the highest during Clamp/PH. 11C-Lactate activity did not differ among groups. Similar patterns were observed for CS data.

(A) Mean fractional arterial (A) and coronary sinus (CS) activity for 1-11C-glucose, 11CO2, and 11C-lactate for each intervention. 1-11C-Glucose: P < 0.05 Fast vs. all groups (A or CS); 11CO2: P < 0.05 Fast vs. Clamp and Clamp/PH (A or CS). (B) Corresponding myocardial extraction(+)/production(−). Data are expressed as mean ± SD. Clamp = hyperinsulinemic–euglycemic clamp; IL = Intralipid; LA = lactate; PH = phenylephrine. 1-11C-glucose or 11CO2: *P < 0.05 vs. Fast, Clamp/IL, and Clamp/LA.
Figure 2B shows the corresponding myocardial extraction(+)/production(–) for 11C ART/CS measurements shown in Figure 2A. Increased 1-11C-glucose extraction was paralleled by a proportional increase in 11CO2 production with both reaching the highest levels in Clamp/PH and the lowest levels in the Fast group. However, 11CO2 production was consistently higher than 1-11C-glucose extraction for all interventions, suggesting that some 11CO2 could be attributed to 11C-lactate oxidation. Net 11C-lactate extraction was observed during all interventions and did not differ among interventions. However, 2 animals, 1 from Clamp and 1 from Clamp/PH, exhibited net lactate production.
ART/CS and PET Measurements of 11C-Glucose and 11C-Lactate
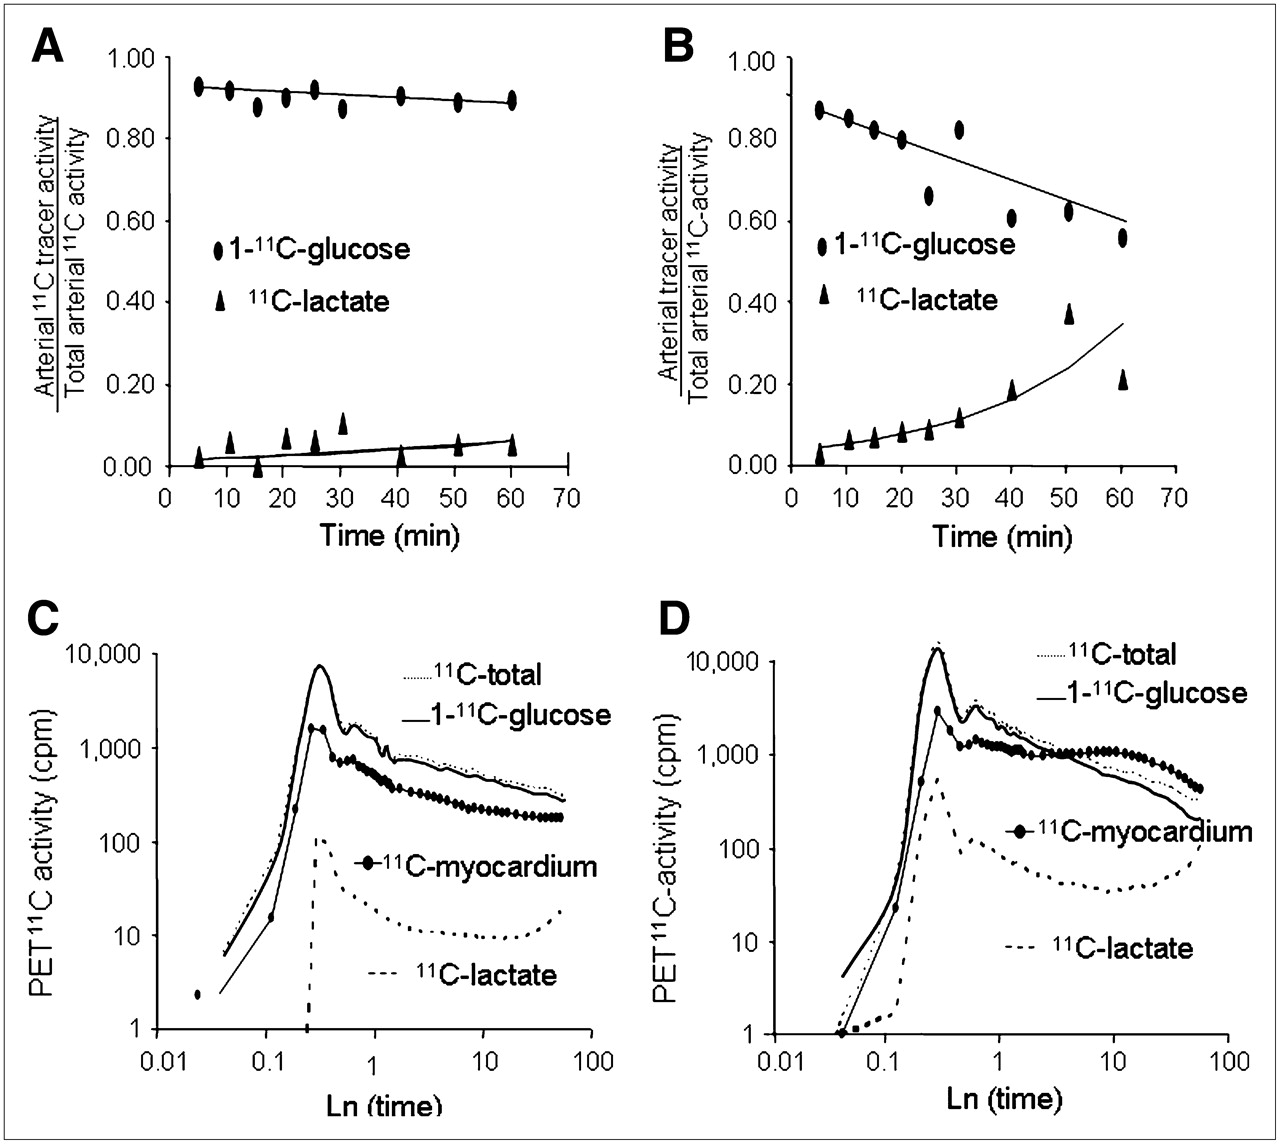
Representative time courses of fractional arterial 1-11C-glucose and 11C-lactate measurements for the interventions with the lowest (Fast) and the highest (Clamp/PH) glucose uptake are shown in Figures 3A and 3B. The contribution of 1-11C-glucose to total blood 11C-activity decreased over time in all interventions. In contrast, 11C-lactate contribution to total 11C blood activity 5 min after injection was <7% and increased throughout the PET study in all interventions. The corresponding PET-derived time–activity curves (not corrected for partial-volume and spillover effects) are shown in Figures 3C and 3D. Arterial 1-11C-glucose time–activity curve reflects the progressive loss of 1-11C-glucose in blood as myocardial glucose uptake and metabolism increases. Similarly, the arterial 11C-lactate time–activity curve reflects 11C-lactate in blood produced in the heart and other organs, with the 11C-lactate time–activity curve in the Fast group with lowest average contribution to total 11C-blood activity (2.0% ± 1.1%) and the Clamp/PH having the highest average contribution (9% ± 15%). Note that in the Fast study, the observed lower than blood myocardial 11C activity reflects the underestimation of myocardial tracer activity due to PET partial-volume effects.

(A and B) Representative time courses of arterial 1-11C-glucose and 11C-lactate as fractions of total 11C-activity in arterial blood and corresponding fitted monoexponential curves (solid lines) obtained from 1 Fast and 1 Clamp/PH study. (C and D) Corresponding PET-derived blood (11C-total, 1-11C-glucose, and 11C-lactate) and myocardial (solid dots) time–activity curves. To help visualize differences in time–activity curves, x- and y-linear coordinates were transformed to logarithmic (Ln) coordinates. cpm = counts/pixel/min.
Correlation of Model Rate Constants and 1-11C-Glucose Metabolism
Rate constants (Table 3) associated with glucose uptake (K1A and k3A) and glycogenolysis (k2B) were positively correlated with direct measurements of glucose uptake and oxidation and inversely correlated with fractional myocardial 13C-glycogen content. The opposite pattern was observed for k1B (glycogen formation). In contrast, the rates associated with glycolysis, k3B (oxidation) and k4B (lactate production), did not correlated with any of the measurements. The rates associated with 11C-lactate uptake and oxidation (K5B–k7B) positively correlated with glucose uptake and oxidation and inversely correlated with fractional myocardial 13C-glycogen. Correlations between model rate constants and lactate metabolism are shown in Table 4. Whereas none of the rates correlated with unlabeled lactate uptake (mL/g/min), k5B–k7B correlated positively with 11C-lactate uptake. There was also a weak but significant positive correlation of k6B and k7B with the rate of 11CO2 produced from 11C-lactate.
Correlation Between Rate Constants and Glucose Metabolism
Correlation Between Rate Constants and Lactate Metabolism
Measurement of Myocardial Glucose Metabolism
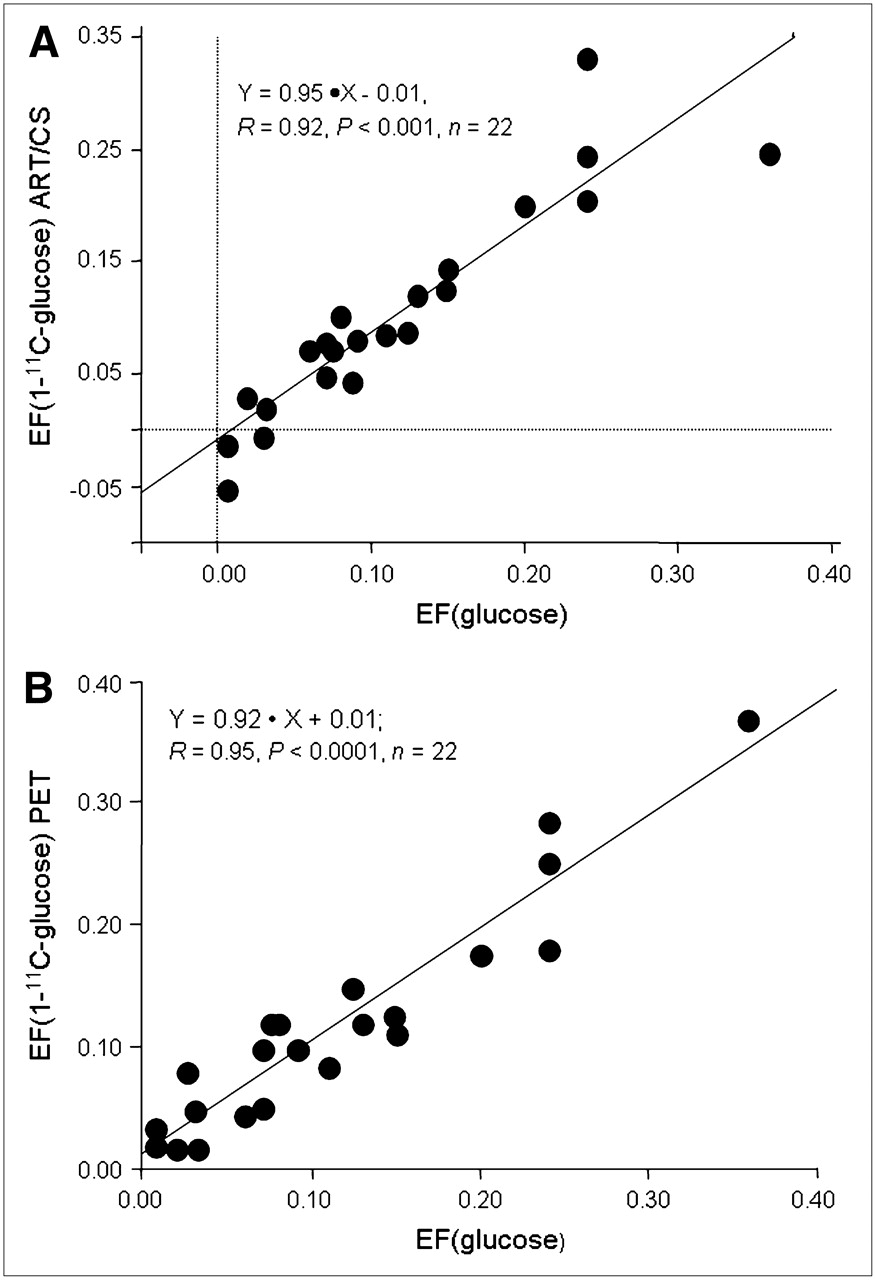
Strong correlations were obtained between the unlabeled and 1-11C-glucose extraction fraction (Fig. 4) measured from either ART/CS (Fig. 4A) (r = 0.92, P < 0.001) or PET (Fig. 4B) (r = 0.95, P < 0.0001). Both 11C correlations resulted in slopes not different from the line of identity, with PET having a significant stronger correlation than ART/CS.

Correlation between ART/CS (A) and PET (B) measurements of myocardial 1-11C-glucose (y-axes) and unlabeled glucose (x-axis) extraction fraction (EF).
Consistent with the glycogen synthesis effect of insulin, glycogen storage was observed in all Clamp studies (Figs. 5A and 5B). Furthermore, for both ART/CS and PET measurements, 11C-glycogen content was greater than glucose oxidation in interventions in which strong substrate competition was present (Clamp/IL and Clamp/LA). In contrast, in Clamp/PH, the primary fate of extracted glucose was oxidation. In Clamp, where no substrate competition was present, the glycogen storing effect of insulin resulted in comparable measurements of oxidation and glycogen content for both ART/CS and PET measurements. Oxidation of exogenous 11C-lactate (Fig. 5A) was higher than that of 1-11C-glucose in interventions in which strong substrate competition was present. In contrast, 1-11C-glucose was the major contributor to total oxidation in Clamp and Clamp/PH. PET measurements of fractional lactate production (Fig. 5B) did not differ among groups and accounted for 17% ± 13% of glycolysis. However, because no direct measurements of 11C-lactate production from exogenous 1-11C-glucose were obtained in the present study, it could not be corroborated whether fractional lactate production measured by PET was representative of lactate produced from glucose metabolism. Note that lactate oxidation was not measured with PET.
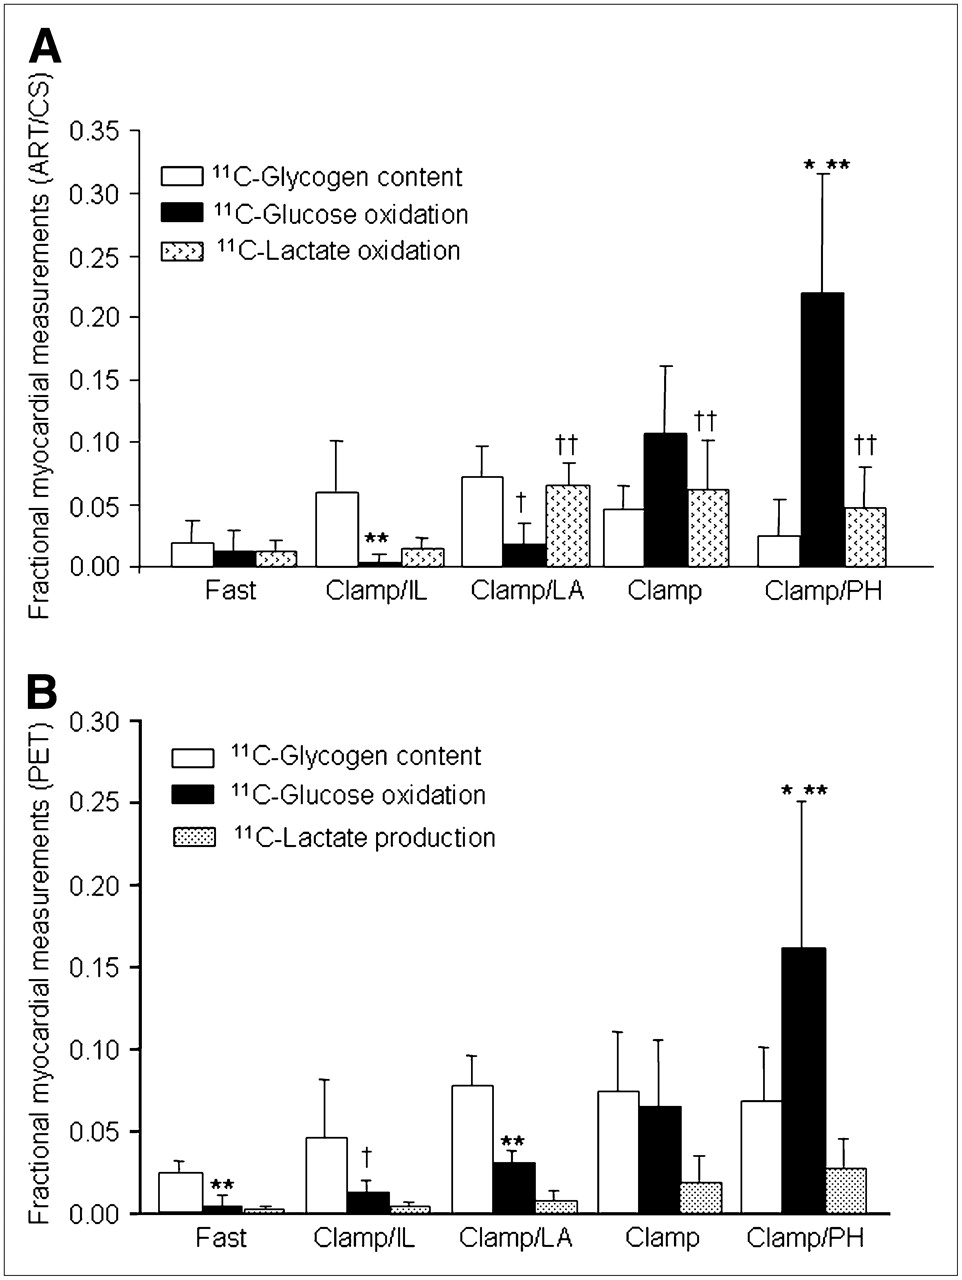
(A) ART/CS measurements of 1-11C-glucose metabolism expressed as fractions of arterial 1-11C-glucose. Glucose oxidation (among interventions): *P < 0.05 vs. Fast, Clamp/IL, and Clamp/LA; glucose oxidation (within intervention): **P < 0.05 and †P = 0.06 vs. glycogen content; lactate oxidation (among interventions): ††P < 0.001 vs. Fast and Clamp. (B) PET measurements of glucose metabolism expressed as fractional contributions to myocardial glucose extraction (glucose extraction = glycogen content + glucose oxidation + lactate production). Glucose oxidation (among interventions): *P < 0.01 vs. all groups; (within interventions): **P < 0.05 and †P = 0.10 vs. glycogen content.
Correlations between PET and ART/CS measurement for glycolysis and glucose oxidation are shown in Figures 6A and 6B, respectively. Note that ART/CS glycolysis and glucose oxidation measurements were calculated on the basis of several assumptions (Supplemental Appendix A); therefore, they represent an estimate of true measurements.

Correlation between PET and ART/CS measurements of fractional glycolysis (A) and glucose oxidation (B).
Glycogen content/glucose extraction calculated from either 11C ART/CS or PET measurements (Figs. 7A and 7B) resulted in a strong nonlinear correlation with direct measurements of fractional 13C-glycogen content. Note that 11C-glycogen measured from ART/CS and PET represents the average of 11C-glycogen stored during PET (60 min), whereas 13C-glycogen reflects the amount of glycogen present in the heart 2 h after tracer injection. Thus, a nonlinear relationship is to be expected. Fractional 11C-glycogen content measurements obtained from the Fast group were excluded in these analyses because of very low levels of glucose extraction (0.03 ± 0.03; Table 1), which resulted in very low myocardial 11C-activity and, consequently, unreliable measurements of the myocardial ratio of 11C-glycogen/1-11C-glucose.

Correlation between glycogen formation expressed as fraction of myocardial glucose obtained from ART/CS 11C measurements (y-axis) and heart 13C-glycogen content (x-axis) (A). Corresponding correlation between PET 11C and heart 13C-glycogen measurements (B). Fasted group was excluded from analysis because of negligible glucose extraction (Table 1, Fast).
DISCUSSION
A new compartmental modeling approach of 1-11C-glucose PET kinetics was developed to assess whether the fate of glucose beyond its initial myocardial extraction can be measured noninvasively. This approach was based on the observations obtained from direct measurements of 1-11C-glucose and its metabolites in the nonischemic healthy heart studied under a wide range of substrate and work environments. Excellent measurements of glucose extraction, glycolysis, glucose oxidation, and glycogen content were obtained with a 2-step kinetic model approach that took into account the contribution of arterial 11C-lactate to 11C myocardial activity (Figs. 4–7⇑⇑⇑).
Measurements of Glycolysis, Oxidation, and Glycogen Content Using PET and Kinetic Modeling
Physiologic validation of the kinetic models was done by investigating whether the model rate constants represented the physiologic processes they were designed to model (Tables 3 and 4) and by comparing model-derived estimates of glycolysis, glucose oxidation, and glycogen content with direct measurements obtained from ART/CS blood and heart tissue samples (Figs. 4–7⇑⇑⇑). In general, the rate constants associated with a given metabolic process were highly correlated with direct measurements of that given process. However, despite no significant correlation between rate constants associated with glycolytic end products (k3B for glucose oxidation and k4B for lactate production) and direct measurements of glycolysis, a good correlation were observed between model and direct measurements of glycolysis and glucose oxidation (Fig. 6).
These discrepancies between metabolic rate constants and glycolysis can be understood in the context of 1 key assumption of the model, that during the PET study the system is in quasi-steady state—that is, the amount of 11C-glycogen formed from exogenous 1-11C-glucose that undergoes glycogenolysis during the PET study is negligible (Supplemental Appendix B). This assumption reduces the fate of extracted 1-11C-glucose to 2 potential pathways: release of glucose metabolites into the vasculature (11CO2 and 11C-lactate) or retention of glucose by-products in the myocardium, primarily as glycogen. Thus, if this assumption holds, glycolysis can be calculated as the differences between glucose uptake and glycogen content. The results of this study suggest that the quasi-steady-state assumption is valid. Nonetheless, the underestimation of model-derived glycolysis and glucose oxidation when compared with ART/CS measurements (Fig. 6) could be partially attributed to some glycogenolysis that is not accounted for in the quasi-steady-state conditions.
To investigate whether rates of glucose oxidation could be distinguished from rates of lactate production, glycolysis was represented by 2 different transfer rates: k3B (glucose oxidation) and k4B (lactate production) (Fig. 1B; Supplemental Appendix B). Glucose oxidation flux (k3B·q2B, mL/g/min) ranged from 0.003 ± 0.05 in the Fast group to 0.22 ± 0.09 in Clamp/PH and was highly correlated with direct measurements of glucose oxidation (Fig. 6B). Lactate production flux (k4B·q2B) ranged from 0.001 ± 0.001 in the Fast group to 0.041 ± 0.039 in Clamp/PH. On average, the ratios of glucose oxidation to lactate production ranged between 3 (Fast, Clamp/IL, and Clamp) and 4 (Clamp/LA and Clamp/PH). These observations are consistent with measurements of lactate production and glucose oxidation in isolated normal rat hearts perfused under conditions comparable to Clamp/IL, where lactate production rates (66.4 ± 17.3 μmol/g dry weight/30 min) were much lower than glucose oxidation rates (475 ± 70 μmol/g dry weight/30 min) (18). Nonetheless, whether k4B·q2B truly represents 11C-lactate production could not be validated, as direct measurements of 11C-lactate produced from myocardial 1-11C-glucose were not obtained.
Impact of Myocardial 11C-Lactate Uptake on Measurements of Glucose Metabolism
As a key fuel for heart under fully aerobic conditions, lactate is simultaneously produced and released into the bloodstream and used (oxidized) in the myocardium (19,20). It has been hypothesized that this simultaneous efflux and uptake of lactate can be explained by a compartmentalization of lactate metabolism within the myocardium (21,22). Specifically, it has been proposed that lactate produced glycolytically is released preferentially into the vasculature, whereas circulating lactate is proposed to be oxidized preferentially. Although the functional significance of such a compartmentalization of lactate metabolism is still unclear, this model is consistent with the intracellular lactate shuttle hypothesis (23).
To avoid overestimation of myocardial 11C-glucose oxidation and underestimation of the fraction of extracted 1-11C-glucose directed toward glycogen synthesis, the contribution of secondarily labeled 11C-lactate to myocardial glucose metabolism in vivo cannot be ignored. Both in vivo and PET measurements of 1-11C-glucose metabolism clearly demonstrate the importance of accounting for 11C-lactate oxidation when using 1-11C-glucose to quantify myocardial glucose metabolism (Figs. 2 and 4–7⇑⇑⇑). By designing a modeling approach that describes 1-11C-glucose metabolism beyond initial myocardial uptake, including the secondary labeling of 11C-lactate and its contribution to myocardial 11C-activity, measurements of overall myocardial glucose metabolism are feasible using PET and 1-11C-gucose.
Comparison with Prior Studies: Glucose and Lactate Metabolism
Further, albeit indirect, evidence of the PET kinetic modeling validation comes from comparison of the present PET results with previously published studies. For example, Beaufort-Krol el al. (24) demonstrated in intact lambs that an acute increase in cardiac work due to exercise resulted in an increase in myocardial oxidation of extracted glucose. Consistent with this observation, in the current study the administration of phenylephrine (α−agonist) resulted in a significant increase in glucose oxidation (Fig. 5B). In a study on perfused rat hearts, Russell et al. (25) found that, in the presence of insulin, the addition of acetoacetate to the perfusate resulted in a marked decline in the oxidation rate of exogenous glucose and an ∼3-fold increase in the rate of incorporation of glucose into glycogen. Similarly, in the present study, increasing FFA blood levels during Clamp/IL resulted in an 80% decrease in glucose oxidation and a concomitant 40% increase in the incorporation of glucose into glycogen (Clamp vs. Clamp/IL, Fig. 5B). Our results are also consistent with a study by Laughlin et al. (26), who have shown an increased rate of insulin-stimulated glycogen synthesis in dog hearts in vivo when nonglucose substrates such as lactate are also infused. We observed that, in the presence of glucose and insulin alone (Clamp), approximately 27% of extracted glucose was directed toward glycogen synthesis, whereas when circulating lactate levels were doubled (Clamp/LA), this percentage increased to 68% (Fig. 5B). Thus, both quantitative and qualitative data support the present approach of using 1-11C-glucose to assess not only the initial myocardial glucose extraction but also its metabolic fate.
There are certain limitations to the present study. First, all calculations were performed on the basis of direct measurement of just 4 quantities: total plasma radioactivity, 1-11C-glucose, 11C-acidic metabolites, and 11CO2 (counts/min/mL). The relatively short half-life of 11C (20.4 min) combined with the fact that blood samples had to be processed before analysis contributed to the variability in the data, especially at later time points. Second, 11C-lactate blood activity was calculated as the differences between total 11C-acidic metabolites and 11CO2. This approach is justified on the basis of our previous observations that, together, 11CO2 and 11C-lactate accounted for >95% of acidic metabolites in plasma when 1-11C-glucose was administered (12). Nonetheless, a small amount of what has been treated as 11C-lactate may, in fact, have been 11C-pyruvate. Third, it was assumed that any 1-11C-glucose taken up by the heart was oxidized, converted to lactate, or incorporated into glycogen. Therefore, metabolism via the pentophosphate pathway or the transamination of pyruvate to alanine was assumed to be negligible. Furthermore, it was also assumed that a true metabolic steady state prevailed; such glycogen synthesis—as estimated from arteriovenous balance measurements of 1-11C-glucose metabolism during the first hour after tracer injection—could be compared with the incorporation of U-13C-glucose into glycogen as measured in myocardial samples obtained 2 h after tracer injection. The close correlation of estimates of glycogen synthesis based on 1-11C-glucose and U-13C-glucose support these assumptions (Fig. 7). Fourth, to differentiate between 1-11C-glucose and 11C-lactate metabolism, it was necessary to assume that 75% of extracted 11C-lactate was oxidized (20,21,27). However, it is possible that the oxidized fraction of extracted lactate may, in some cases, have been significantly less or greater than 75%, which would impact the accuracy of the estimates of glucose metabolism obtained using 1-11C-glucose. Thus, some of the underestimation observed between model-derived and direct measurements of glucose metabolism (Fig. 6) might be due to uncertainties in the direct measurements. Lastly, this model was implemented and tested in the healthy nonischemic heart when net lactate uptake was observed in all but 2 experiments. Conditions of net lactate production, which is present only at high rates of glycolysis in the presence of impaired oxidation of pyruvate, such as ischemia or poorly controlled diabetes (28–30), were not tested. Implementation of this model under ischemic conditions might be challenging because of the low delivery of tracer to ischemic myocardium as well as the potential significant spillover of tracer from normal to ischemic regions.
CONCLUSION
The results of this study demonstrate that under nonischemic conditions, measurements of glucose oxidation, glycolysis, oxidation, and glycogen content can be obtained noninvasively with 1-11C-glucose PET and a kinetic modeling approach that takes into account the contribution of exogenous 11C-lactate to total 11C-myocardial activity.
Acknowledgments
This study was supported by NIH grants HL-69100 and P30-DK56341.
Footnotes
-
COPYRIGHT © 2007 by the Society of Nuclear Medicine, Inc.
References

- Received for publication October 24, 2006.
- Accepted for publication February 27, 2007.


Jump to section
Related Articles
Cited By...
- Imaging Myocardial Metabolic Remodeling
- Radionuclide Imaging of Myocardial Metabolism
- Multimodality Cardiovascular Molecular Imaging, Part I
- Time Course of Alterations in Myocardial Glucose Utilization in the Zucker Diabetic Fatty Rat with Correlation to Gene Expression of Glucose Transporters: A Small-Animal PET Investigation
- L-3-11C-Lactate as a PET Tracer of Myocardial Lactate Metabolism: A Feasibility Study