

FIGURE 2.

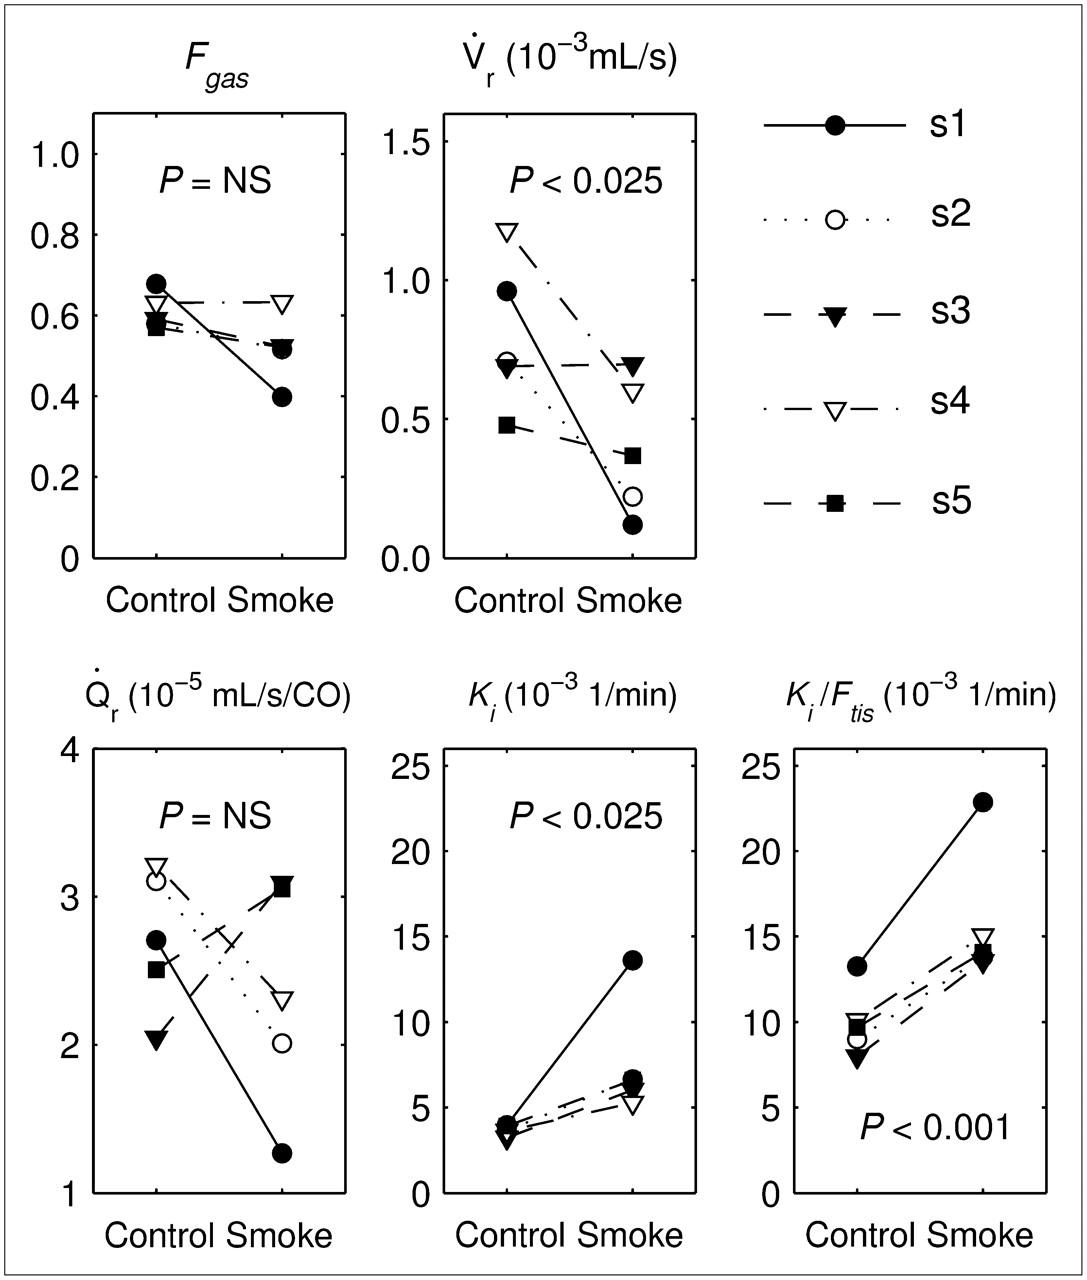
FIGURE 2.
Mean values of lung function variables for all 5 sheep (s1–s5) in control and smoke-exposed lungs.
In this issue


Related Articles
Cited By...
- Quantitative 18F-fluorodeoxyglucose positron emission tomography/computed tomography to assess pulmonary inflammation in COPD
- PET/CT in nononcological lung diseases: current applications and future perspectives
- Heterogeneity in Lung 18FDG Uptake in Pulmonary Arterial Hypertension: Potential of Dynamic 18FDG Positron Emission Tomography With Kinetic Analysis as a Bridging Biomarker for Pulmonary Vascular Remodeling Targeted Treatments
- Detection of Lung Dysfunction Using Ventilation and Perfusion SPECT in a Mouse Model of Chronic Cigarette Smoke Exposure
- 18F-FDG Uptake Rate Is a Biomarker of Eosinophilic Inflammation and Airway Response in Asthma
- Image-Derived Input Function for Assessment of 18F-FDG Uptake by the Inflamed Lung