


Abstract
Recent developments have established molecular imaging of mouse models with small-animal PET and bioluminescence imaging (BLI) as an important tool in cancer research. One of the disadvantages of these imaging modalities is the lack of anatomic information. We combined small-animal PET and BLI technology with small-animal CT to obtain fusion images with both molecular and anatomic information. Methods: We used small-animal PET/CT and BLI to detect xenografts of different cell lines and metastases of a melanoma cell line (A375M-3F) that had been transduced with a lentiviral vector containing a trimodality imaging reporter gene encoding a fusion protein with Renilla luciferase, monomeric red fluorescent protein, and a mutant herpes simplex virus type 1 thymidine kinase. Results: Validation studies in mouse xenograft models showed a good coregistration of images from both PET and CT. Melanoma metastases were detected by 18F-FDG PET, 9-[4-18F-fluoro-3-(hydroxymethyl)butyl]guanine (18F-FHBG) PET, CT, and BLI and confirmed by ex vivo assays of Renilla luciferase and mutant thymidine kinase expression. 18F-FHBG PET/CT allowed detection and localization of lesions that were not seen on CT because of poor contrast resolution and were not seen on 18F-FDG PET because of higher background uptake relative to 18F-FHBG. Conclusion: The combination of 18F-FHBG PET, small-animal CT, and BLI allows a sensitive and improved quantification of tumor burden in mice. This technique is potentially useful for the study of the biologic determinants of metastasis and for the evaluation of novel cancer treatments.
Systemic metastasis is the primary cause of mortality for most cancer types and represents a major therapeutic challenge in oncology. Determination of the presence and extent of metastasis is a cornerstone of diagnosis in oncology. PET has been playing an increasingly important role in this staging process, largely because of improved detection of lymph node and systemic metastases with 18F-FDG (1), and the introduction of combined clinical PET/CT scanners has further strengthened this role.
The biologic mechanism of metastasis has become better understood through the study of the migration and seeding of tumoral cells, tumor–stroma interactions, vascularization of tumors, genetic mouse models, and gene expression and proteomic patterns that correlate with metastasis. These insights have highlighted the need for more realistic models of tumor xenografts that suffer from altered vascularization, have no relevant tumor–stroma interactions, and often rely on immunodeficient mice (2). Recently, our group and others have made progress in adapting whole-body imaging techniques to small animals so that tumor burden can be visualized and quantified in a single animal over time. For this purpose, we have developed reporter gene systems for PET (3) and for bioluminescence imaging (BLI) (4). We have used these systems to study the role of specific genes in cancer progression (5), to study viral vector targeting of metastasis (6), and to noninvasively monitor novel treatments for melanoma metastases (7,8). We have also developed a trimodality fusion reporter gene that allows detection of gene expression by fluorescence, BLI, and PET (9). For the latter, the reporter probe used is 9-[4-18F-fluoro-3-(hydroxymethyl)butyl]guanine (18F-FHBG), which is phosphorylated by the reporter gene product, a mutant herpes simplex virus type 1 thymidine kinase (HSV1-tk) enzyme.
Recently developed small-animal CT systems (10,11) allow imaging of the anatomy of living mice with a high spatial resolution of 50–200 μm based on differential x-ray absorption by different tissues. Tissue contrast depends mainly on differences in tissue density and on the presence of mass amounts of contrast agents, providing limited if any molecular information. Hence, most current applications of small-animal CT have focused on specific tissues, such as bone (11), that can be well depicted because of their favorable contrast properties or tissues that have required the use of specific contrast agents (12). We have previously used small-animal CT to study a localized model of prostate cancer bone metastasis in the tibia of mice (13).
The high specificity of PET tracers for their molecular targets provides few anatomic landmarks—a disadvantage in studies in which the origin of the signal is not known, such as cell and metastasis trafficking studies. To improve this weakness of PET, we investigated the use of small-animal PET and small-animal CT as a multimodality imaging method allowing visualization of molecular information within an adequate anatomic framework. We used BLI to validate our findings and to compare combined small-animal PET/CT with BLI within the same animal.
Our study was a preliminary assessment of combined PET/CT with the following specific goals: establishment of a methodology to obtain coregistered small-animal PET and small-animal CT images, validation of these fused PET/CT images in tumor xenografts, evaluation of fused PET/CT in the detection of pulmonary melanoma metastases in a mouse model with 18F-FDG and 18F-FHBG (intravenously administered), evaluation of fused PET/CT in the detection of pulmonary melanoma metastases in a mouse model with 18F-FDG and 18F-FHBG, and comparison of this result to BLI metastasis detection.
MATERIALS AND METHODS
An overview of the mouse conditions and the performed scans is presented in Table 1.
Overview of Mouse Conditions and Performed Scans
Inoculation of Tumor Cells
Animal care and euthanasia were performed with the approval of the University of California Animal Research Committee. Cells were harvested after trypsinization, suspended in a solution containing 150 mM sodium phosphate and 150 mM sodium chloride (pH 7.2) (phosphate-buffered saline), and stored on ice. All mice were anesthetized using 30 μL of a mixture of ketamine and xylazine (80 and 20 mg/mL, respectively) injected intraperitoneally. Twelve- to 16-wk-old male nude mice (nu/nu) received an injection of 1.5 × 10⁶ N2a cells (n = 3) or 0.5 × 10⁶ C6 cells (n = 4) subcutaneously in the shoulder region or an injection of 1.5 × 10⁶ A375M cells (n = 3), 1.5 × 10⁶ A375M-3F cells (n = 6), or 0.5 × 10⁶ B16F0 cells (n = 3) in the left cardiac ventricle. Eight-week-old beige SCID mice received an injection of 0.7 × 10⁶ A375M-Fluc cells (n = 5) in the lateral tail vein. The weight of the mice and the size of the tumor grafts were recorded on a regular basis and before each scan.
PET Procedure
The animals were kept fasting for a minimum of 6 h before undergoing PET. They were anesthetized using 1 L/min of 2% isoflurane in 100% oxygen. After receiving the anesthesia, they were given a 7.4-MBq injection of 18F-FDG or 18F-FHBG. After 1 h had been allowed for clearance of nonspecifically bound tracer, the animals received an intraperitoneal injection of 30 μL of a mixture of ketamine and xylazine (80 and 20 mg/mL, respectively) and subsequently were fixed in the prone position on a polystyrene bed in the presence of 6 fiducial markers (Fig. 1A). These consisted of a polymerase chain reaction tube filled with 2 μL of iohexol (Omnipaque; GE Healthcare) and 74 kBq of 18F-FDG to allow detection by CT and PET and were positioned next to the mouse. A 10-min static single-frame scan was acquired on the small-animal PET camera (microPET P4; Concorde Microsystems Inc.). Images were reconstructed by filtered backprojection using a ramp filter. The pixel size was 0.845 × 0.845 × 1.260 mm, and the resolution was approximately 1.85 mm.

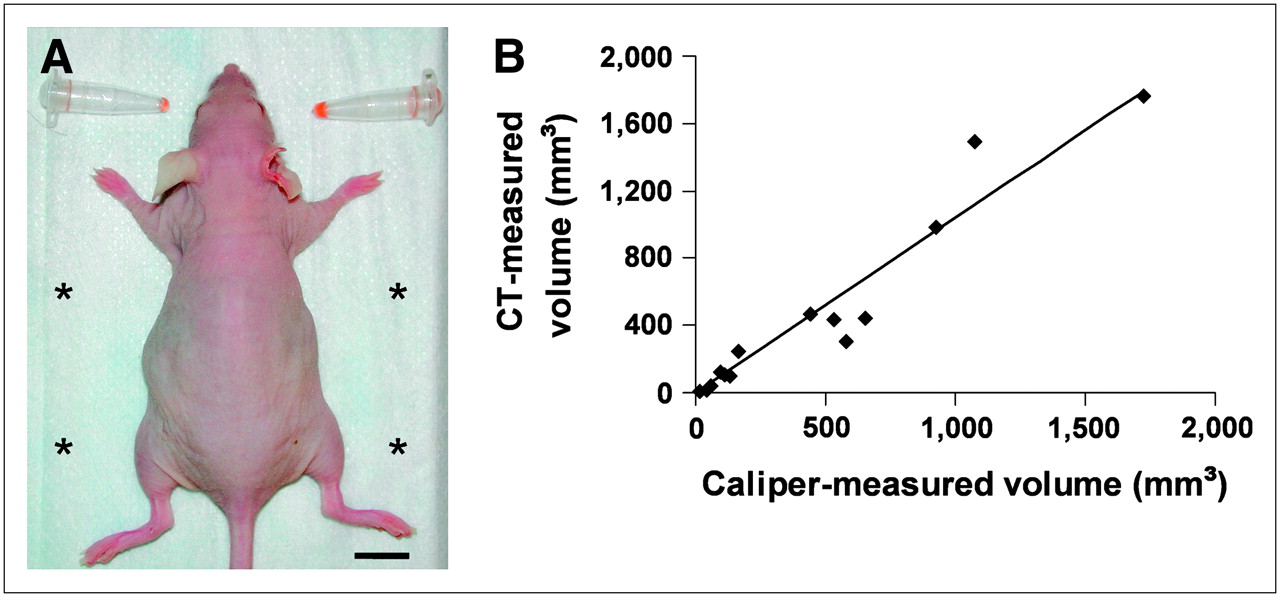
Validation of CT measurements. (A) Nude mouse in imaging position on polystyrene bed. Two fiducial markers are shown before fixation to bed; positions of other markers are marked by asterisks. Scale bar is 1 cm wide. (B) Correlation between tumor volume measured on CT images and caliper-measured tumor volume. Correlation is strong (r2 = 0.92; P < 0.0001), close to identity line (slope = 1.08).
CT Procedure
We used a small-animal CT scanner (MicroCAT; Imtek). This system consists of a low-energy x-ray tube (x-ray energy, 30–50 kVp), a high-resolution phosphor screen, a charge-coupled-device detector with 1,024 × 1,024 pixels (field of view, ∼50 × 50 mm), and a precision-motion translation stage. The detector and x-ray source rotate about a fixed bed, allowing the mouse to be kept in the same horizontal position in the CT scanner as in the PET scanner. Directly after the PET scan, the animals were transported to and positioned in the CT scanner while still fixed to their polystyrene bed containing the fiducial markers. After administering a booster dose of 15 μL of ketamine/xylazine intraperitoneally, we scanned 2 bed positions (separated by 40.6 mm along the longitudinal axis) for 15 min each (190 projection images) to acquire the entire body of the mouse (total axial field of view, ∼90.6 mm). The total procedure took about 40 min, including 2 intervals of 5 min for positioning and system initialization. The images were acquired in step-and-shoot mode with the x-ray source set at 50 kVp and 450 μA. Two-dimensional slices of each bed position were reconstructed using a fanbeam resorting algorithm with a standard ramp filter. Images were reconstructed on a 256 × 256 pixel grid with a pixel size of 70 × 70 μm. For reconstruction in Hounsfield units, the system was calibrated using a 50-mL polypropylene tube filled with water. The resolution of the reconstructed images was 200 μm. We then merged the images of both bed positions into a single whole-body image dataset by discarding the 18 outer slices of each bed position and by computing a progressive weighted average of the overlapping 18 slices. No x-ray contrast medium was used.
Image Fusion and Quantitative Analysis
Both the PET and the CT datasets were imported using the nonproprietary AMIDE software (14), version 0.8.2 (http://amide.sourceforge.net). In the datasets of both modalities, “fiducial marker points” were placed at the center of each image of the fiducial markers. Subsequently, the fiducial marker points, and their respective datasets, were aligned using the alignment wizard and the Procrustes rigid-body alignment algorithm without scaling. The CT images were displayed in Hounsfield units. The PET images were converted to percentage injected dose per gram (%ID/g) by means of a calibration constant obtained from scanning a cylindric phantom in the small-animal PET scanner, assuming a tissue density of 1 g/mL, and dividing by the injected dose, decay-corrected to the time of scanning. Three-dimensional ellipsoidal regions of interest were drawn over the tumors and metastases. In the metastatic models, control regions of interest were drawn contralaterally or on nonpathologic tissue. The mean and maximum pixel values were obtained for both datasets. Tumor-to-background contrast was calculated using the %ID/g values and the formula (tumor − background)/(tumor + background).
BLI Procedure and Image Analysis
Each mouse received 30 μL of ketamine/xylazine by intraperitoneal injection and was placed supine. To generate the bioluminescence reaction catalyzed by Renilla luciferase, we injected its substrate, coelenterazine (20 μg in 100 μL of a 10% methanol/90% phosphate-buffered saline [pH 7.4] solution), in the lateral tail vein. Immediately afterward, we placed the animal supine in an IVIS system (Xenogen Inc.), which consists of a cooled charge-coupled-device camera (−105°C) mounted on a lighttight chamber. A photograph and a bioluminescent image consisting of a 1-min photon collection were acquired 3 times successively. The photograph and bioluminescent image were superimposed using Living Image software (version 2.20; Xenogen Inc.) and IGOR Pro image analysis software (version 4.06A; Wavemetrics). A region of interest was manually drawn over the body of the mouse, and the average radiance was measured in photons·s−1·cm−1·sr−1 (steradians). The highest value of the 3 scans is reported.
Radiotracers and Chemicals
18F-FDG was synthesized using the method described by Hamacher et al. (15) at a specific activity of approximately 185 TBq/mmol. 18F-FHBG was synthesized as previously described (16) at a specific activity of approximately 37 TBq/mmol. Coelenterazine was purchased from Biotium, Inc.
Cell Lines and Transfection Procedures
N2a murine neuroblastoma cells were obtained from Dr. Vincent Mauro (Scripps Research Institute). B16F0 and A375M human melanoma cells were provided by Dr. Michael Kolodney (UCLA). These cell lines were cultured in high-glucose Dulbecco's modified Eagle medium supplemented with 10% fetal bovine serum and 1% penicillin/streptomycin solution (respectively, 100 and 292 μg/mL). C6 rat glioma cells were provided by Dr. Margaret Black (Washington State University) and cultured in high-glucose deficient Dulbecco's modified Eagle medium supplemented with 10% fetal bovine serum, 1% penicillin/streptomycin, and 1% l-glutamine (100 nM).
The A375M cell line was transfected with Firefly luciferase (A375M-Fluc (7)) or transduced with a lentiviral vector expressing the triple-fusion gene hRL-mRFP-tTK (humanized Renilla luciferase, monomeric red fluorescent protein, and truncated herpes simplex virus type 1 thymidine kinase) (A375M-3F (9)).
Herpes Simplex Virus 1 Thymidine Kinase Activity Assay
Cell or tumor extracts were incubated for 20 min with 8-3H-penciclovir to determine the formation of phosphorylated 8-3H-penciclovir. This phosphorylated 8-3H-penciclovir was trapped on a DE-81 filter (Whatman) while the parent compound was washed away. The remaining activity was counted in an LS-9000 liquid scintillation counter (Beckman) with BioSafe II scintillation fluid (Beckman). The results are reported as the percentage conversion of 8-3H-penciclovir ([disintegrations per minute per microgram of cell protein or tumor extract protein]/[disintegrations per minute of control sample] × 100).
Renilla Luciferase Assay
The Renilla luciferase assay was performed using a dual-luciferase reporter assay system (Promega). Each of the luciferase reactions was measured in a TD 20/20 luminometer (Turner Designs) for 10 s and normalized for protein content.
Statistical Analysis
All data were processed using Excel 2000 software (Microsoft). Results are expressed as mean ± SD of the mean. Linear regression analysis was performed to obtain the Pearson correlation coefficient. Comparisons of consecutive scans within the same animal and with control animals were performed using a paired and unpaired 2-sided Student t test, respectively.
RESULTS
Adequacy of Alignment Procedure
Because of the limited transaxial field of view of the small-animal CT scanner, some fiducial markers were not visible in the CT dataset and, on average, only 4.5 ± 0.23 fiducial markers could be used for the alignment procedure. The required minimum of 3 fiducial markers was visible on all scans. After alignment of the PET and CT images, the mean fiducial reference error was 0.29 ± 0.072 mm per fiducial marker used. This error is well below the resolution of the small-animal PET scanner—approximately 1.85 mm—and indicates that the alignment procedure was adequate. The outlines of the body, the heart, and the kidneys were systematically verified in 24 mice and showed a good correspondence between the PET and CT images.
18F-FDG PET/CT for Monitoring Growth of Tumor Xenografts
Small-animal CT measurements using an ellipsoidal ROI correlated well with caliper measurements for the 13 scans of the xenograft models, with tumor size ranging from 15.6 to 1,720 mm3 (r2 = 0.92; P < 0.0001) (Fig. 1B). The small-animal PET images showed a hypermetabolic signal in all tumors that could be detected by external palpation. The PET data showed increasing uptake of 18F-FDG in the N2a xenografts from day 8 to day 20 after inoculation, with a maximum final value of 4.52 ± 0.69 %ID/g. In the C6 xenograft model, 18F-FDG uptake did not significantly differ from day 12 to day 17 after implantation: the mean 18F-FDG uptake evolved from 4.54 ± 0.94 to 4.70 ± 1.67 %ID/g, and the maximum evolved from 7.07 ± 1.86 to 8.28 ± 0.78 %ID/g. Necrotic areas were visualized on the PET images for all 4 C6 tumors but were not detected on the corresponding CT images, regardless of the settings of the Hounsfield thresholding windows (Fig. 2).

Evolution of xenograft growth at days 12 and 17 after inoculation of 0.5 × 10⁶ C6 cells in nude mouse as seen on CT and on 18F-FDG PET/CT fusion images. Tumor ROIs are outlined in orange. White arrows indicate necrotic area at periphery of tumor, visible on 18F-FDG PET image but not discriminable from viable tumor on CT image alone. Fiducial markers are indicated by blue arrows.
18F-FDG PET/CT for Detecting Pulmonary Melanoma Metastases
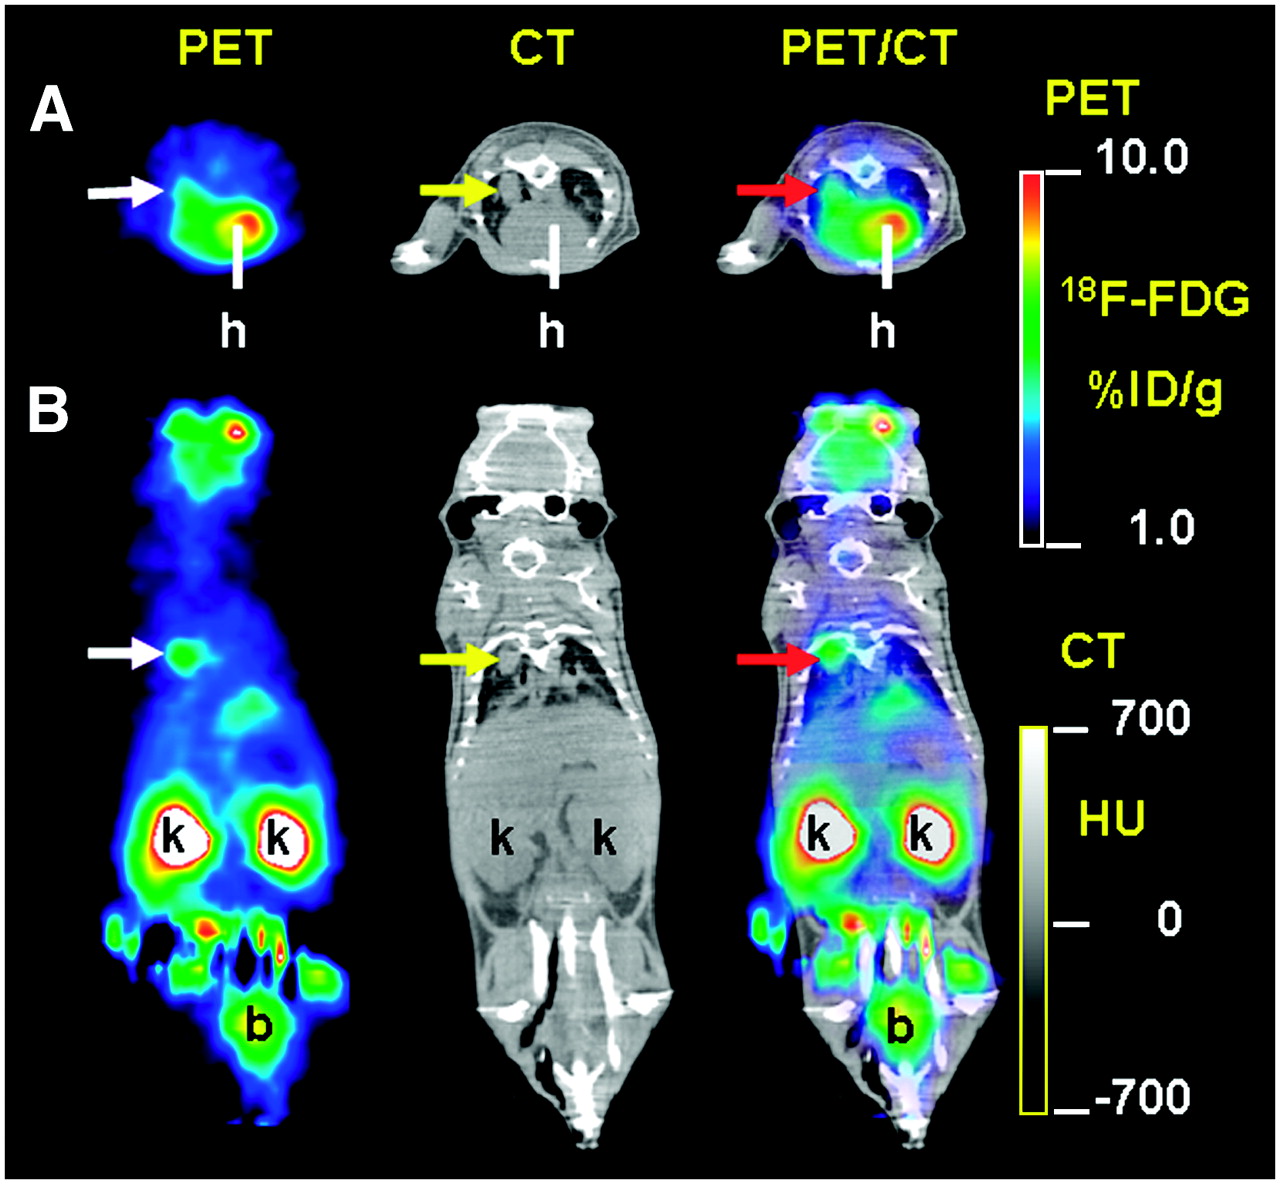
Small-animal 18F-FDG PET/CT was capable of detecting pulmonary metastases in 4 of 5 SCID mice 45 d after the intravenous injection of A375M-Fluc cells. The CT images showed round, nodular water-density lesions in the lung parenchyma and near the visceral pleura (Fig. 3). The PET images showed high uptake of 18F-FDG in the corresponding areas. Uptake was 8.8 ± 1.6 %ID/g (control: 1.1 ± 0.2 %ID/g, P = 0.0042), density was 98.3 ± 38.8 Hounsfield units (control: −352 ± 21.5, P = 3.8 × 10⁻⁸), and tumor volume was 24.4 ± 12.0 mm3 (range, 7.5–58 mm3). High uptake in the heart, in the interscapular brown fat, and in the bone marrow did interfere with detection and delineation of the lesions in 2 mice. Because of low 18F-FDG uptake in the B16F0 cell line, 18F-FDG PET/CT did not detect the numerous metastatic lesions in the mice injected with B16F0 cells (data not shown).

Detection of pulmonary metastasis with 18F-FDG PET/CT. Transverse (A) and coronal (B) sections of coregistered 18F-FDG PET and CT images of SCID mouse 45 d after tail-vein injection of 0.7 × 10⁶ A375M-Fluc melanoma cells. White arrows indicate hypermetabolic area seen on 18F-FDG PET image. Yellow arrows show water-density nodule in dorsal apex of right lung in CT image. PET/CT fusion image confirms registration of hypermetabolic image on anatomic reference (red arrow). Physiologic tracer uptake in heart (h), kidneys (k), and bladder (b) is marked.
18F-FHBG PET/CT and BLI for Imaging Systemic Melanoma Metastases
After 12 cell culture generations, the A375M-3F cell line showed good activity in the herpes simplex virus 1 thymidine kinase assay (1.98% ± 0.28% penciclovir/min/μg of protein) and good Renilla luciferase activity (5,098 ± 791 relative light units/min/μg of protein). The 6 mice that received an intraventricular injection of A375M-3F cells were monitored with BLI every 3–4 d (Figs. 4A and 4B). Metastatic sites could be detected with BLI from day 15 on, and subsequent 18F-FHBG PET/CT scans on day 28 showed increased uptake at these sites. Metastases were detected in bone (mandibula [n = 3] or long bones [n = 2]), liver (n = 2), brown fat (n = 1), lung (n = 1), and eye (n = 1). The mean uptake of 18F-FHBG was 3.3 ± 1.3 %ID/g, and 18F-FHBG uptake in these lesions was higher 1 wk later (Fig. 5). The CT images showed increased soft tissue in the pulmonary lesions (n = 2) and enlargement of the liver (n = 2) and spleen (n = 1). No osteolytic lesions were documented in the bone lesions detected on PET. The combination of the PET and CT images allowed a precise anatomic localization of the lesions (Figs. 6A and 6B) that could be captured in a single image using 3-dimensional rendering (supplemental Fig. 1 and supplemental video [available online only at http://jnm.snmjournals.org]). The locations of the lesions as detected by small-animal PET/CT were confirmed by necropsy and by Renilla luciferase and TK assay of tissue samples (Fig. 6C).

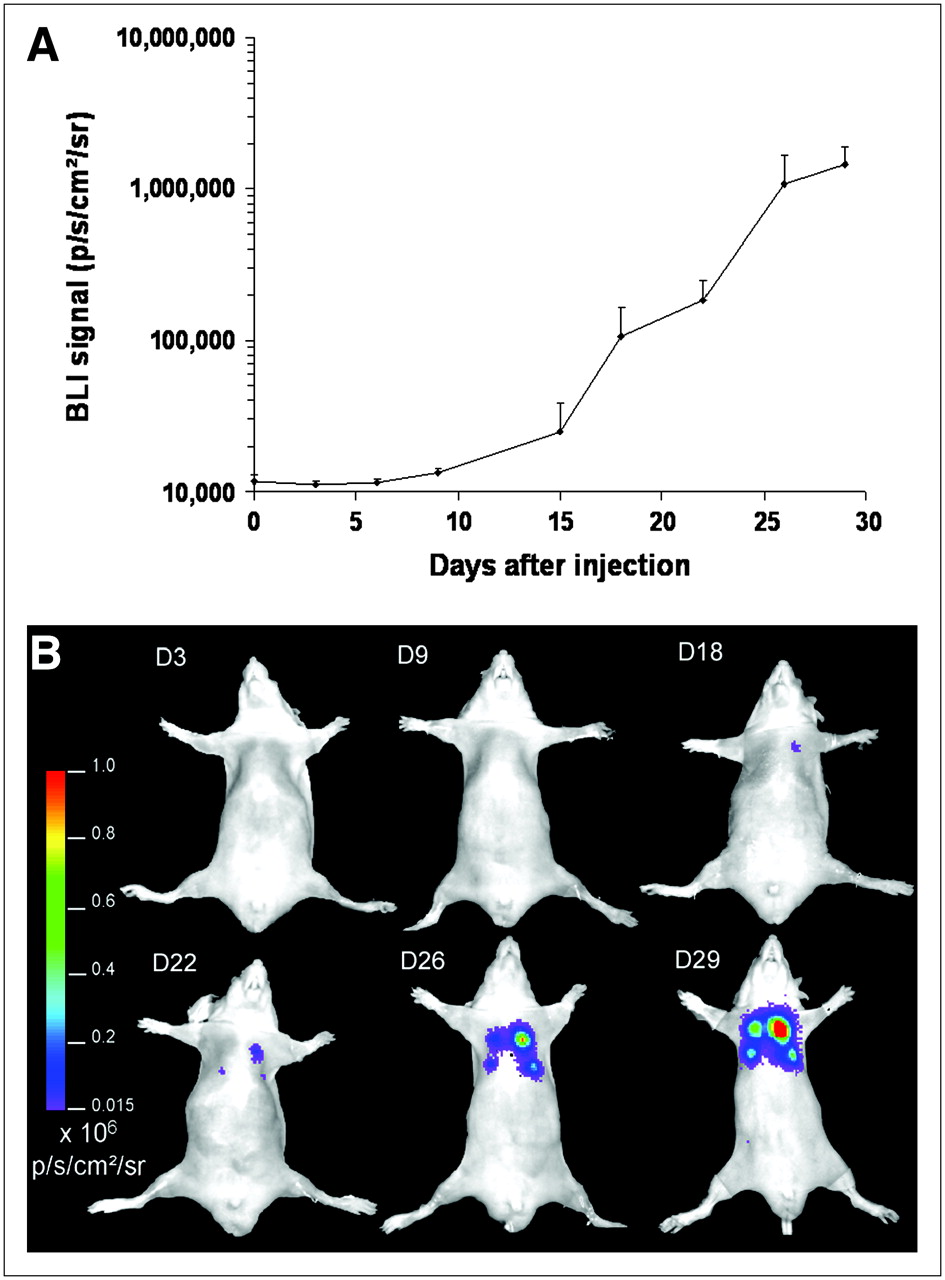
Monitoring of metastasis with BLI. (A) Growth of A375M-3F metastasis after intraventricular injection in nude mice as documented by BLI. Evolution of maximum pixel at site of metastasis over 1 mo is shown (n = 6, error bar represents SD). (B) Growth of A375M-3F pulmonary metastasis in 1 mouse.

Evolution of metastasis with 18F-FHBG PET/CT. Transverse (A) and coronal (B) sections of coregistered 18F-FHBG PET/CT images of nude mouse that received injection of A375M-3F in left ventricle. Left (yellow arrows) and right (red arrows) basal fields of lung show increase in tracer uptake from 1.8 to 2.5 %ID/g (39% increase) and from 1.4 to 2.1 %ID/g (50% increase), respectively, from week 4 to week 5, indicating progressive growth of pulmonary metastasis. Blue arrows indicate fiducial markers. Physiologic tracer uptake in intestines (i), right kidney (k), and bladder (b) is marked.
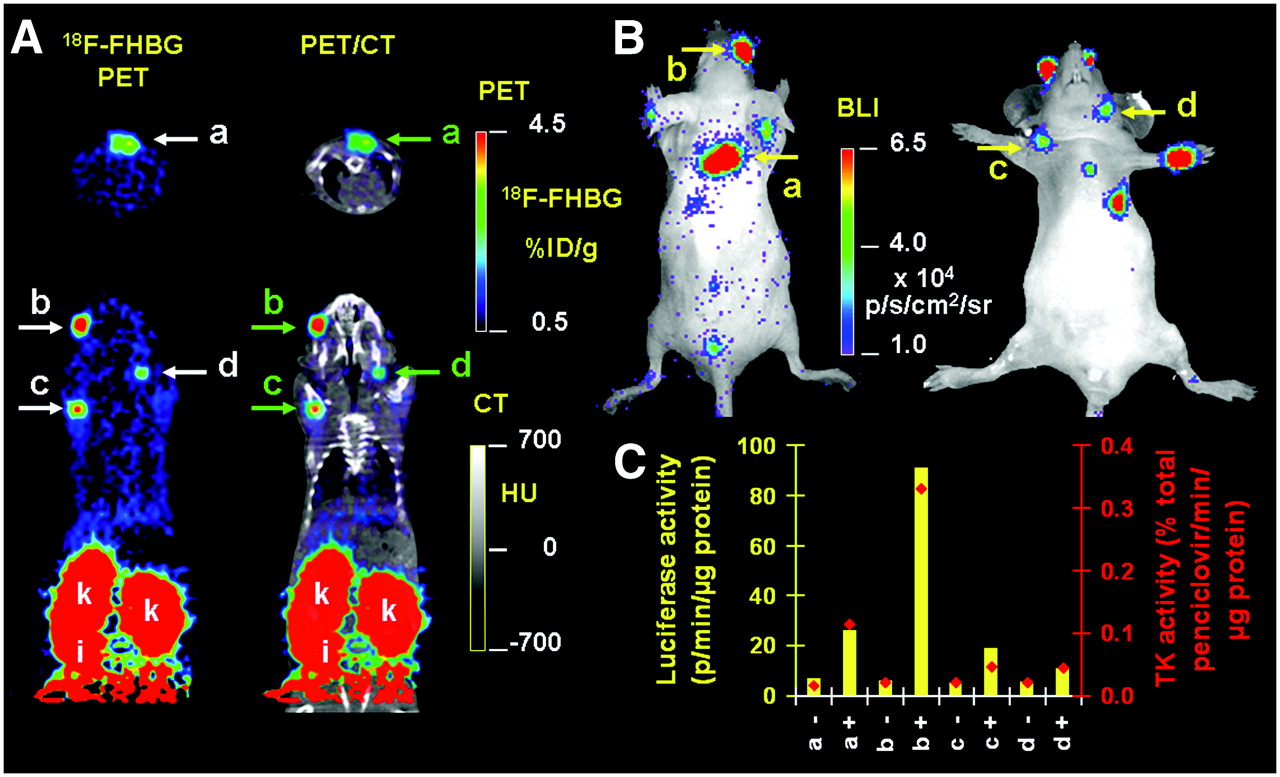
Additional value of CT in 18F-FHBG PET images of metastasis. (A) Thirty-five days after intraventricular injection of 1.5 × 10⁶ A375M-3F melanoma cells in nude mouse, 18F-FHBG PET/CT allows precise anatomic localization of metastasis in interscapular fat (a), right eye (b), right humeral head (c), and left mandibula (d) as shown by green arrows. Lack of anatomic landmarks on PET alone is illustrated by white arrows. (B) BLI shows same lesions as seen on 18F-FHBG PET/CT but does not provide information on depth of lesion. (C) Ex vivo thymidine kinase and luciferase assays of lesions (+) and contralateral controls (−) validate imaging observations.
18F-FHBG Versus 18F-FDG PET/CT for Detecting Systemic Metastases
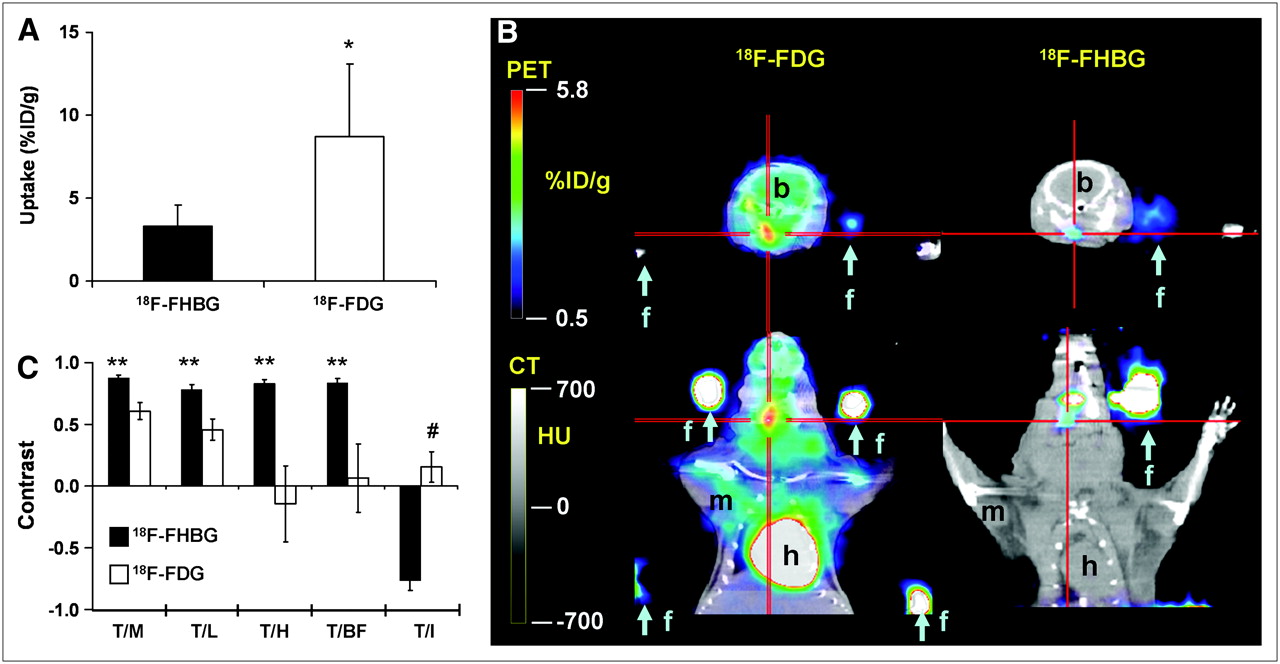
Two days after small-animal 18F-FHBG PET/CT had been performed, small-animal 18F-FDG PET/CT was performed. The 18F-FDG scans detected some but not all of the metastatic lesions seen on the 18F-FHBG scans. The mean uptake of 18F-FDG (8.7 ± 4.4 %ID/g) was higher than that of 18F-FHBG (3.3 ± 1.3 %ID/g, P < 0.01) (Fig. 7A). Delineation of the detected lesions was more difficult because of the increased background uptake of 18F-FDG (Fig. 7B). The tumor-to-background contrast ratios for 18F-FHBG in muscle, liver, heart, brown fat, and intestine were 0.88 ± 0.02, 0.78 ± 0.04, 0.83 ± 0.03, 0.84 ± 0.03, and −0.77 ± 0.08, respectively, whereas for 18F-FDG the respective ratios were 0.61 ± 0.07, 0.46 ± 0.09, −0.14 ± 0.31, 0.06 ± 0.28, and 0.15 ± 0.12 (Fig. 7C). Despite the lower absolute uptake, there was a significant increase in 18F-FHBG contrast in muscle, liver, heart, and brown fat (0.27, 0.32, 0.97, and 0.77, respectively) compared with 18F-FDG contrast (all P < 0.001).

Comparison of 18F-FDG and 18F-FHBG for detection of A375M-3F metastasis. (A) Uptake of 18F-FDG and 18F-FHBG in metastatic lesions of A375M-3F in 4 mice (6 lesions) that were scanned at days 33 and 31 after injection, respectively (*P < 0.01). (B) 18F-FDG and 18F-FHBG PET scans of nude mouse on days 30 and 28 after injection of 1.5 × 10⁶ A375M-3F cells in left cardiac ventricle. Red crosshairs show metastatic lesion in right mandibula. 18F-FDG uptake is higher than 18F-FHBG uptake, but latter is specific to metastatic cells whereas 18F-FDG uptake is also prominent in heart, brain, and muscles (labeled h, b, and m, respectively). Blue arrows indicate fiducial markers. (C) Tumor-to-background contrast for muscle (T/M), liver (T/L), heart (T/H), brown fat (T/BF), and intestine (T/I) for 18F-FHBG (n = 6; 10 lesions) and 18F-FDG (n = 4; 6 lesions) in metastatic lesions of A375M-3F (mean ± SEM). Contrast is significantly higher for 18F-FHBG than for 18F-FDG (**P < 0.001), except for intestine, where it is significantly lower (#P < 0.0001).
DISCUSSION
In this study, we demonstrated noninvasive, quantitative, and tomographic imaging of tumor xenografts and metastases in mouse models using a combination of small-animal PET and small-animal CT. We determined the feasibility of coregistering the PET and CT images in xenograft models, explored the possibility of using 18F-FDG PET/CT to detect pulmonary melanoma metastases, and evaluated the detection of systemic metastases of a reporter gene–expressing melanoma cell line with 18F-FHBG PET/CT and BLI.
Our method was based on the use of fiducial markers for fusion of the PET images with the CT images. Because the alignment error was about 5 times lower than the resolution of the small-animal PET scanner, we consider this method sufficiently accurate. We did not perform any partial-volume or attenuation correction, because this was beyond the scope of the study. The reported values are therefore underestimations for lesions smaller than about 4 mm in diameter.
The tumor xenografts could be visualized with 18F-FDG PET and CT. The N2a xenografts showed increasing uptake with time, whereas the C6 xenografts showed no differences in mean or maximum uptake over time. This finding was due to a partial-volume effect in the N2a xenografts, because the volume in the early scans was around 45 mm3 (diameter, ∼4.5 mm). In the C6 xenografts, the increase in mean uptake was less than the increase in the maximum pixel value because of necrosis in the tumor periphery. The fact that this necrosis was not seen on the CT images in any of the tissue windows we examined was due to the poor soft-tissue contrast of small-animal CT. This finding highlights the need for contrast agents to characterize tumors in small-animal CT. These agents can be of the classic iodine-based type, can be tissue-specific (12), or can come from another imaging modality, as in our approach using 18F-FDG PET.
To study metastasis, we first used an established model of lung metastasis (7) to take advantage of the contrast between tumoral soft tissue and the air in the lungs. We were successful in detecting pulmonary metastases with CT and 18F-FDG PET in 4 of 5 SCID mice 45 d after intravenous injection of A375M-Fluc melanoma cells. These mice did represent an advanced stage of disease, with lesions ranging in size from 7.5 to 58 mm3. High background uptake of 18F-FDG in heart, muscle, and brown fat did interfere with lesion delineation in 2 mice, and because pulmonary metastases of B16-F0 melanoma cells did not show increased 18F-FDG uptake, we further focused on reporter gene–based metastasis detection.
We used melanoma cells expressing the trimodality fusion reporter gene hRL-mRFP-tTK after lentiviral transduction (A375M-3F). We showed that reporter gene activity was still present after 12 cell culture generations, indicating that there is no significant silencing of reporter gene expression that might influence cell detection. Ten metastatic sites in total were detected by 18F-FHBG PET, with a mean uptake of 3.3 ± 1.3 %ID/g. The CT images showed changes in the lung and liver but not in the bone lesions. Earlier reports showed the presence of osteolytic lesions caused by A375 cells (17,18), but this is not the case for the derived cell line A375M, which was selected for its capacity to form lung metastases (19,20). Despite a higher uptake of 18F-FDG in the A375M-3F cells, 18F-FHBG was superior to 18F-FDG because of its much lower background uptake in the thorax and the head. Tumor-to-background contrast showed a significant increase of at least 0.27 for 18F-FHBG in the most relevant thoracic organs. This better performance of 18F-FHBG than of 18F-FDG in the thorax was anticipated because 18F-FHBG is specifically designed to be retained only in cells expressing HSV1-tk, a viral enzyme that in these mice is present only in the tumor cells. Furthermore, 18F-FHBG has a favorable pharmacokinetic profile, with rapid washout from normal tissues. In contrast, 18F-FDG uptake is related to glucose metabolism and is determined primarily by the number of active glucose transporters on the cell membrane and by hexokinase activity, and these are not restricted to tumor cells but also occur in brain, heart, brown fat, and liver. In intestines, the nonspecific physiologic hepatobiliary clearance of 18F-FHBG causes higher activity levels that are responsible for the limited detection of metastatic lesions in the peritoneal cavity, the lumbar spine, and pelvic bones. Novel molecules with better imaging characteristics, such as 2′-fluoro-2′-deoxyarabinofuranosyl-5-ethyluracil (21), are currently under investigation in our laboratory, and they might improve the detection of metastasis because they show a higher absolute uptake and lower gastrointestinal activity than does 18F-FHBG. Using a rabbit model of VX2-carcinoma pulmonary metastasis, Kondo et al. (22) showed that the performance of 18F-FDG PET was significantly greater for lesions larger than 4 mm than for smaller ones. Recently, oncologic imaging of mice has been reported in clinical combined PET/CT systems (23), but the low resolution of the system (6 mm) interferes with accurate quantification of metastatic lesions.
The BLI signal intensity is depth-dependent, resulting in a higher signal for superficial lesions than for deeper lesions that showed a comparable 18F-FHBG uptake, confirming our previous observations (9). BLI has the advantage of a relatively low cost and high throughput capability, making the depth dependence of the signal the major disadvantage in small animals. The other major limitation of BLI is that the planar nature of the images impedes accurate 3-dimensional localization of the signal. Recent studies have used BLI for evaluating metastases noninvasively (24), for evaluating lymphoma therapy (25), for studying the influence of differential gene expression on the pattern of metastasis formation (26), and for studying the importance of cellular receptors for metastasis development (27). The development of tomographic optical systems is progressing (28). These systems are using novel hardware that allows the acquisition of bioluminescence images from multiple angles and the use of reconstruction algorithms that apply models of photon transport in tissue to localize and quantify photon sources, but tomographic optical systems still need substantial validation regarding localization and quantification of the luminescent signal. The low cost, high sensitivity, and high throughput of planar BLI also make it suited as a routine monitoring tool that, when metastases are detected, can be complemented by 18F-FHBG small-animal PET/CT for anatomic localization and quantitation. A slightly different strategy was used by Kang et al. (29). They used BLI to detect MDA-MB-231 breast cancer bone metastases followed by PET reporter gene imaging of HSV1-tk expression under the control of a TGF-β response element. Images produced by the latter represent signal transduction through the TGF-β/Smad pathway and can show in vivo that these cells are engaged in Smad-dependent transcription while growing as bone metastases. Thus, PET and BLI can be used to detect 2 different molecular signals from the same metastasis.
We have demonstrated that multimodality imaging with PET, CT, and BLI is a powerful tool in the study of metastatic mouse models. Because of the low contrast of 18F-FDG, even in a cell line that has a high 18F-FDG uptake, PET reporter gene strategies are superior to 18F-FDG imaging except for abdominal metastases. On the basis of our results, we suggest the following imaging strategy: frequent BLI scanning should be used initially to monitor the animals while the metastases are below the detection thresholds of PET and CT. When BLI shows lesions that have reached the detection thresholds of PET or CT, combined PET/CT scans can than be used for detection (PET and CT), quantitation (PET), anatomic localization (CT), or density and volume measurement (CT).
A major limitation of the current study is the lack of a histologic gold standard for assessing tumor metastases. For identifying lesions as metastases, this lack was partially compensated for by the double detection of lesions on PET and BLI and by the in vitro analysis of tissue extracts. However, there might have been lesions that did not reach the threshold of detection by either imaging method, resulting in false-negative findings. This study, however, was designed to show the feasibility of using multimodality PET/CT and BLI to detect metastases. Future work will have to address the issue of sensitivity and determine the detection thresholds for the different modalities. For instance, scan times longer than 10 min for PET might increase sensitivity. Histologic standards will be needed, and the monomeric red fluorescent protein moiety of the multimodality reporter gene will be useful for detecting and identifying fluorescent metastatic cells in tissue specimens. The monomeric red fluorescent protein moiety is also important for fluorescence-activated cell sorting, rather than for in vivo fluorescent imaging, in which the high background and the weak signal generate a signal-to-noise ratio that is much lower than for BLI (30).
CONCLUSION
We combined noninvasive molecular and anatomic information in mice by fusing small-animal PET and small-animal CT images acquired from independent systems. We demonstrated that our multimodality reporter gene approach is capable of detecting metastatic lesions at an early stage by using BLI, and at a later stage these lesions can accurately be localized on 3-dimensional combined PET/CT images. Noninvasive detection of reporter gene expression, combined with accurate anatomic information, can have important applications in the study of the biology of metastasis formation and progression, in the monitoring of novel cancer treatments, and in the establishment of new transgenic models that combine oncogenic mutations with reporter genes. Combined molecular and anatomic imaging can also be useful in other areas of biomedical research, such as the tracking of immune cells and the monitoring of stem cell–based therapies.
Acknowledgments
We thank Dr. Nagichettiar Satyamurthy and his cyclotron team for production of the tracers, Judy Edwards and Waldemar Ladno for technical assistance with the small-animal PET imaging, Dr. David Stout for help with the small-animal CT acquisitions, and Zachary Walls for help with the cell and molecular work. Special thanks are extended to Professor Luc Mortelmans by Dr. Deroose for help with coordinating and funding his stay at the Crump Institute. One of the authors is a research assistant supported by the Fund for Scientific Research Belgium–Flanders (F.W.O) and is the beneficiary of a Henri Benedictus Fellowship of the Belgian American Educational Foundation and the King Boudewijn Foundation. This work was supported in part by the NCI SAIRP and NCI ICMIC CA114747 P50.
Footnotes
-
COPYRIGHT © 2007 by the Society of Nuclear Medicine, Inc.
References
- Received for publication October 15, 2006.
- Accepted for publication October 19, 2006.


Jump to section
Related Articles
Cited By...
- Human-specific GAPDH RT-qPCR is an accurate and sensitive method of xenograft metastasis quantification
- Functional Flow Patterns and Static Blood Pooling in Tumors Revealed by Combined Contrast-Enhanced Ultrasound and Photoacoustic Imaging
- Molecular Imaging of Post-Src Inhibition Tumor Signatures for Guiding Dasatinib Combination Therapy
- Methods to Study Metastasis in Genetically Modified Mice
- The selective inhibition of protein phosphatase-1 results in mitotic catastrophe and impaired tumor growth
- Current Preclinical Models for the Advancement of Translational Bladder Cancer Research
- Magnetic Resonance and Fluorescence-Protein Imaging of the Anti-angiogenic and Anti-tumor Efficacy of Selenium in an Orthotopic Model of Human Colon Cancer
- A Clinically Relevant, Syngeneic Model of Spontaneous, Highly Metastatic B16 Mouse Melanoma
- Hybrid PET-optical imaging using targeted probes
- Molecular MRI for sensitive and specific detection of lung metastases
- PF-00477736 Mediates Checkpoint Kinase 1 Signaling Pathway and Potentiates Docetaxel-Induced Efficacy in Xenografts
- Immunodeficient Mouse Strains Display Marked Variability in Growth of Human Melanoma Lung Metastases
- Advancing Bioluminescence Imaging Technology for the Evaluation of Anticancer Agents in the MDA-MB-435-HAL-Luc Mammary Fat Pad and Subrenal Capsule Tumor Models
- Multimodality Molecular Imaging with Combined Optical and SPECT/PET Modalities