


Abstract
To date, the in vivo imaging of quantum dots (QDs) has been mostly qualitative or semiquantitative. The development of a dual-function PET/near-infrared fluorescence (NIRF) probe can allow for accurate assessment of the pharmacokinetics and tumor-targeting efficacy of QDs. Methods: A QD with an amine-functionalized surface was modified with RGD peptides and 1,4,7,10-tetraazacyclodocecane-N,N′,N″,N‴-tetraacetic acid (DOTA) chelators for integrin αvβ3–targeted PET/NIRF imaging. A cell-binding assay and fluorescence cell staining were performed with U87MG human glioblastoma cells (integrin αvβ3–positive). PET/NIRF imaging, tissue homogenate fluorescence measurement, and immunofluorescence staining were performed with U87MG tumor–bearing mice to quantify the probe uptake in the tumor and major organs. Results: There are about 90 RGD peptides per QD particle, and DOTA–QD–RGD exhibited integrin αvβ3–specific binding in cell cultures. The U87MG tumor uptake of 64Cu-labeled DOTA–QD was less than 1 percentage injected dose per gram (%ID/g), significantly lower than that of 64Cu-labeled DOTA–QD–RGD (2.2 ± 0.3 [mean ± SD] and 4.0 ± 1.0 %ID/g at 5 and 18 h after injection, respectively; n = 3). Taking into account all measurements, the liver-, spleen-, and kidney-to-muscle ratios for 64Cu-labeled DOTA–QD–RGD were about 100:1, 40:1, and 1:1, respectively. On the basis of the PET results, the U87MG tumor-to-muscle ratios for DOTA–QD–RGD and DOTA–QD were about 4:1 and 1:1, respectively. Excellent linear correlation was obtained between the results measured by in vivo PET imaging and those measured by ex vivo NIRF imaging and tissue homogenate fluorescence (r2 = 0.93). Histologic examination revealed that DOTA–QD–RGD targets primarily the tumor vasculature through an RGD–integrin αvβ3 interaction, with little extravasation. Conclusion: We quantitatively evaluated the tumor-targeting efficacy of a dual-function QD-based probe with PET and NIRF imaging. This dual-function probe has significantly reduced potential toxicity and overcomes the tissue penetration limitation of optical imaging, allowing for quantitative targeted imaging in deep tissue.
Semiconductor quantum dots (QDs), after surface modification to render them water soluble and biocompatible, have a promising future in biomedical applications (1–3). QDs have size- and composition-adjustable fluorescence emission wavelengths, narrow emission bands, and very high levels of brightness and photostability. For in vitro studies, QDs have been used for cell labeling, fluorescence in situ hybridization, cell tracking, fluorescence resonance energy transfer, and many other applications (2–4). Nonspecific QDs have been used for the in vivo imaging of embryo development, the vasculature, lymph nodes, and many diseases in animal models (1–7). To be more useful for in vivo imaging and other biomedical applications, QDs need to be effectively, specifically, and reliably directed to a specific organ or disease site without alteration. To date, only a few in vivo targeting and imaging studies of QDs have been reported (8–10). In the near-infrared (NIR) region (700–900 nm), the absorbance of all biomolecules reaches a minimum and provides a clear window for in vivo optical imaging (11). We recently reported the use of arginine-glycine-aspartic acid (RGD) peptide–conjugated NIR QDs for tumor vasculature targeting and imaging in living mice (12).
The pharmacokinetics and plasma clearance of QDs and their uptake by various organs have been investigated (13,14). Because of the difficulty in quantifying the fluorescence signal in vivo and many other technical challenges that remain to be solved, the in vivo imaging of QDs so far has been mostly qualitative or semiquantitative. The information obtained from NIR fluorescence (NIRF) imaging alone is insufficient for the accurate quantification of tumor-targeting efficacy and for a complete understanding of pharmacokinetics. Hence, the development of dual-function probes for both fluorescence imaging and MRI was recently reported (15,16). We reasoned that a combination of NIRF imaging and PET imaging may offer additional advantages. Because PET is a highly quantitative, tomographic imaging modality with ultrahigh sensitivity (17), the development of a dual-function probe containing both an NIR QD and a PET isotope can allow for sensitive, accurate assessment of the pharmacokinetics and tumor-targeting efficacy of NIR QDs by PET, thereby greatly facilitating the future translation of QDs into clinical applications. Such information will also be crucial for fluorescence-guided surgery in providing sensitive, specific, and real-time intraoperative visualization of the molecular features of normal and disease processes.
Integrin αvβ3, a cell adhesion molecule, is highly expressed on activated endothelial cells and tumor cells but is not readily detectable in resting endothelial cells and most normal organ systems (18,19). The fact that integrin αvβ3 is overexpressed on both tumor vasculature and tumor cells makes it an excellent target for in vivo–targeted imaging with QDs, because extravasation is not required to observe tumor contrast. Indeed, we have reported noninvasive NIRF imaging of tumor vasculature with RGD peptide–conjugated QDs in a subcutaneous U87MG human glioblastoma (integrin αvβ3–positive) model (12). The goal of this study was to use both PET imaging and NIRF imaging of the dual-function probe to quantify the organ and tumor uptake levels of the QD conjugate, thereby allowing an accurate evaluation of tumor-targeting efficacy. In vivo targeting can be achieved through an RGD–integrin αvβ3 interaction, and 1,4,7,10-tetraazacyclododecane-N,N′,N″,N‴-tetraacetic acid (DOTA) conjugation on the QD surface will allow for 64Cu (half-life: 12.7 h; β+: 17.4%) chelation; these properties permit PET imaging in addition to NIRF imaging based on QD fluorescence.
MATERIALS AND METHODS
Synthesis of Dual-Function Probe
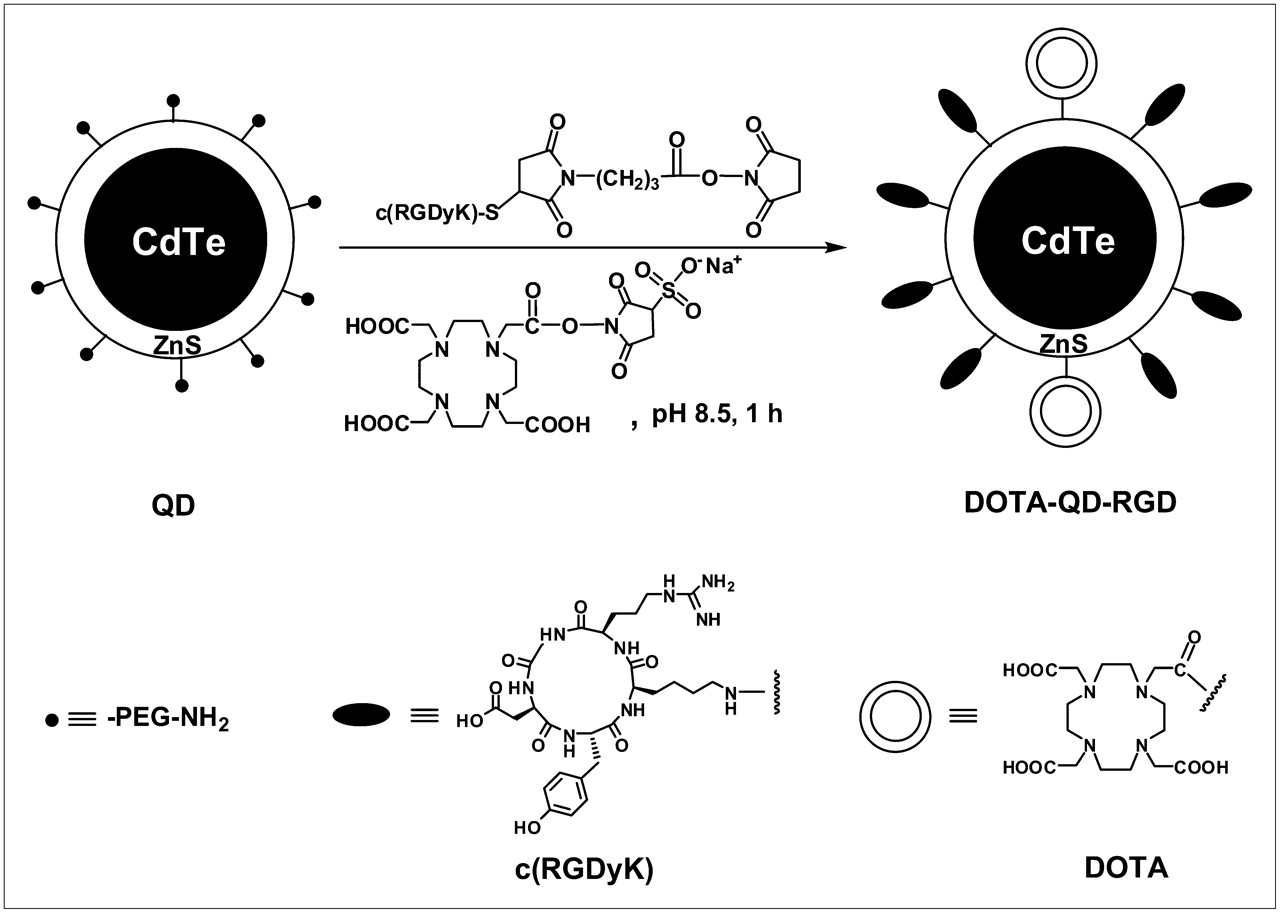
A thiolated cyclic pentapeptide, c(RGDyK)-SH (potent integrin αvβ3 antagonist), was synthesized as previously reported (20). It was then conjugated to a heterobifunctional linker, 4-maleimidobutyric acid N-hydroxysuccinimide ester (Sigma). In parallel, DOTA–N-hydroxysulfosuccinimide ester was synthesized as previously reported (21). The 2 active esters (containing RGD and DOTA, respectively) were mixed and added to a buffered solution (10 mM sodium borate, pH 8.5) of a QD with an amine-functionalized surface (QD705; emission maximum, 705 nm; Invitrogen) (Fig. 1). The reaction ratio for c(RGDyK):DOTA:QD was 1,000:200:1. After 1 h of incubation at room temperature (RT), the conjugate DOTA–QD–RGD was purified by size exclusion chromatography (Nap-10 column; GE Healthcare). DOTA–QD was also synthesized as a control, with the reaction ratio for DOTA:QD being 1,200:1. A competitive cell-binding assay on U87MG cells in cultures was then performed to evaluate the integrin αvβ3–binding affinity of DOTA–QD–RGD with 125I-echistatin as the integrin αvβ3–specific radioligand (22).

Synthesis of dual-function PET/NIRF probe DOTA–QD–RGD. DOTA–QD was prepared in similar manner, except that no RGD peptide was used. Overall diameter of QD conjugate is about 20 nm (12). PEG = polyethylene glycol.
Fluorescence Microscopy
Detailed procedures for fluorescence staining of live U87MG and C6 (rat glioma with low integrin αvβ3 expression) cells have been reported elsewhere (12). The final concentration used for both DOTA–QD–RGD and DOTA–QD was 1 nM. To confirm the integrin αvβ3 specificity of DOTA–QD–RGD, blocking experiments with 1 μM c(RGDyK) were also performed. The parameters were as follows: filter set—excitation, 420/40 nm, and emission, 705/40 nm; magnification, 400×.
Animal Model
Animal experiments were performed according to a protocol approved by the Stanford University Institutional Animal Care and Use Committee. The U87MG tumor model was established by subcutaneous injection of U87MG cells (5 × 10⁶ in 50 μL of phosphate-buffered saline) into the front left flank of female athymic nude mice (Harlan). The mice were subjected to imaging studies when the tumor volume reached 200–500 mm3 (3–4 wk after inoculation).
Small-Animal PET Imaging
The details of 64Cu labeling, small-animal PET imaging, and region-of-interest (ROI) analysis have been reported elsewhere (23,24). 64Cu-labeled DOTA–QD–RGD and DOTA–QD were purified by size exclusion chromatography and injected intravenously into U87MG tumor–bearing mice. The amount injected into each mouse was about 20 pmol, on the basis of the QD (7–14 MBq, on the basis of 64Cu). Small-animal PET imaging was performed with a microPET R4 rodent scanner (Siemens Medical Solutions) at multiple time points after injection. For each small-animal PET scan, 3-dimensional ROIs were drawn over the tumor and various organs on decay-corrected whole-body coronal images. The average radioactivity concentration was obtained from the mean pixel values within the ROI volume, which were converted to counts per milliliter per minute by use of a predetermined conversion factor (23,24). Given a tissue density of 1 g/mL, the counts per milliliter per minute were converted to counts per gram per minute, and the values were divided by the injected dose to obtain the imaging ROI-derived percentage injected dose per gram (%ID/g).
NIRF Imaging
After the U87MG tumor and major organs were harvested, half of the samples were immediately frozen in OCT medium (Sakura Finetek) and then cut into 5-μm-thick slices for microscopy studies. The other half of the harvested tissues were subjected to both small-animal PET imaging and NIRF imaging (IVIS200; Xenogen). A customized filter set (excitation, 500–550 nm; emission, 695–770 nm) was used for data acquisition. All fluorescence images were acquired with a 1-s exposure (f-stop = 4). The fluorescence intensity of each tissue was measured and normalized to photons per second with an ROI covering the entire tissue. After subtraction of the background signal from an ROI of the same size and shape drawn over an area without any tissue, the total fluorescence flux of each tissue was divided by its weight. The tissue-to-muscle ratios were then calculated.
After ex vivo small-animal PET imaging and NIRF imaging, the tissues were immediately homogenized in phosphate-buffered saline, and the fluorescence signal of each tissue homogenate at a wavelength of 705 nm was measured with a fluorimeter (excitation, 600 nm; FluoroMax-3 spectrofluorimeter; Jobin Yvon Horiba). After normalization to weight, the tissue-to-muscle ratios were calculated.
Immunofluorescence Staining
Frozen tumor sections (5 μm thick) were warmed to RT, fixed with ice-cold acetone for 10 min, and dried in the air for 10 min. The sections were blocked with 10% donkey serum for 10 min at RT. For CD31 staining, the sections were incubated with a rat anti–mouse CD31 monoclonal antibody (1:50; BD BioSciences) for 30 min at RT. After incubation with a Cy3-conjugated donkey antirat secondary antibody (1:100; Jackson ImmunoResearch Laboratories, Inc.) for another 30 min, the tumor sections were examined under a microscope (Axiovert 200 M; Carl Zeiss). For murine integrin β3 staining, a hamster anti–mouse β3 antibody (1:50; BD BioSciences) and a fluorescein isothiocyanate–conjugated goat antihamster secondary antibody (1:200; Jackson ImmunoResearch Laboratories, Inc.) were used.
RESULTS
Synthesis and Characterization of Dual-Function Probe
QD modification was achieved in one step (Fig. 1). No aggregation was observed for either DOTA–QD–RGD or DOTA–QD. Because of the strong UV absorbance of QDs, the number of RGD peptides per QD particle cannot be measured by UV–visible light absorbance. Instead, an isotope dilution method was used (23,25). The numbers of DOTA chelators per QD particle for DOTA–QD–RGD and DOTA–QD were found to be 28.2 ± 0.2 [mean ± SD] and 117.7 ± 1.1, respectively (n = 3). Thus, there are about 90 RGD peptides per QD particle.
The competitive cell-binding assay revealed that DOTA–QD–RGD inhibited the binding of 125I-echistatin to U87MG cells in a dose-dependent manner (Fig. 2A). The 50% inhibitory concentrations (IC50s) for DOTA–QD–RGD and c(RGDyK) were 3.88 and 231 nM, respectively, demonstrating that DOTA–QD–RGD had about 60-fold-higher integrin αvβ3 avidity than c(RGDyK). The IC50s measured with such a cell-based assay are always lower than those obtained from purified integrin αvβ3 protein fixed on a solid matrix (e.g., enzyme-linked immunosorbent assay or solid-phase receptor–binding assay) (26).
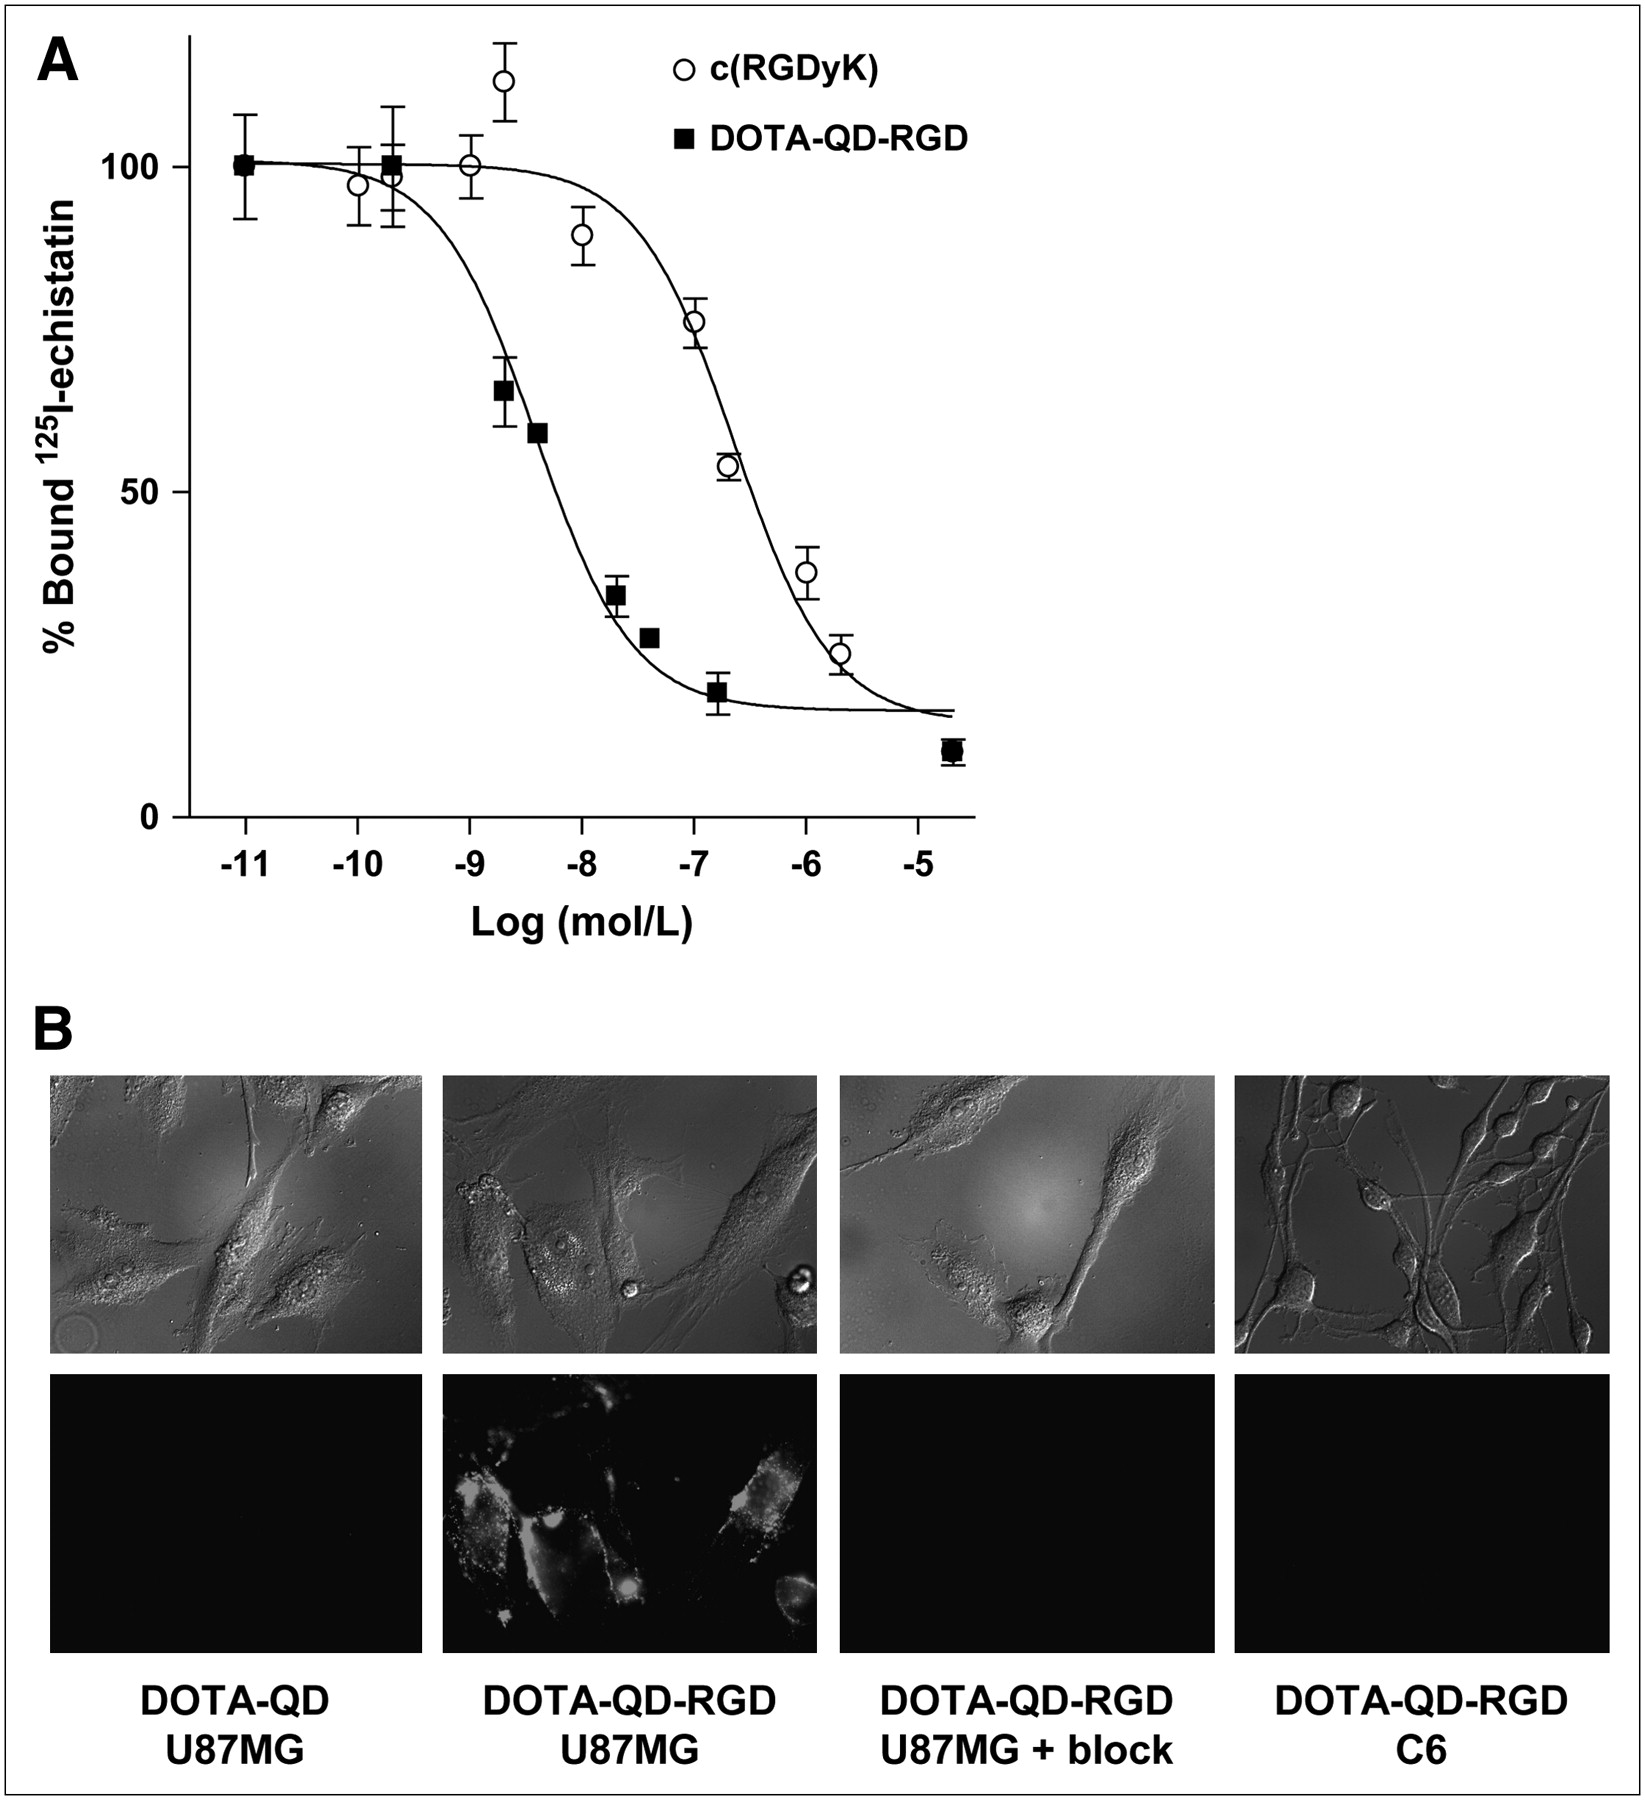
Competitive cell-binding assay and fluorescence cell staining. (A) Inhibition of 125I-echistatin (integrin αvβ3–specific) binding to αvβ3 integrin on U87MG cells by c(RGDyK) and DOTA–QD–RGD (mean ± SD, n = 3). IC50s for c(RGDyK) and DOTA–QD–RGD were 231 and 3.88 nM, respectively. (B) Staining of live U87MG human glioblastoma cells (high integrin αvβ3 expression) with 1 nM DOTA–QD, DOTA–QD–RGD, and DOTA–QD–RGD in presence of 1 μM c(RGDyK) (denoted as “block”). Images of live C6 rat glioma cells (low integrin αvβ3 expression) stained with 1 nM DOTA–QD–RGD are also shown. Bright-field images are in top row, and fluorescence images are in bottom row. All fluorescence images were acquired under same conditions and are displayed at same scale.
DOTA–QD showed minimal nonspecific binding to U87MG cells, whereas DOTA–QD–RGD clearly delineated the cell membrane (integrin αvβ3 is a transmembrane protein, and the RGD-binding site is in the extracellular domain) (Fig. 2B) (27). The binding of DOTA–QD–RGD to U87MG cells was completely blocked by 1 μM c(RGDyK), confirming the integrin αvβ3 specificity of DOTA–QD–RGD. DOTA–QD–RGD did not bind to integrin αvβ3–negative C6 cells. These findings indicate that DOTA–QD–RGD has high integrin αvβ3 specificity and affinity in cell cultures.
In Vivo Small-Animal PET Imaging
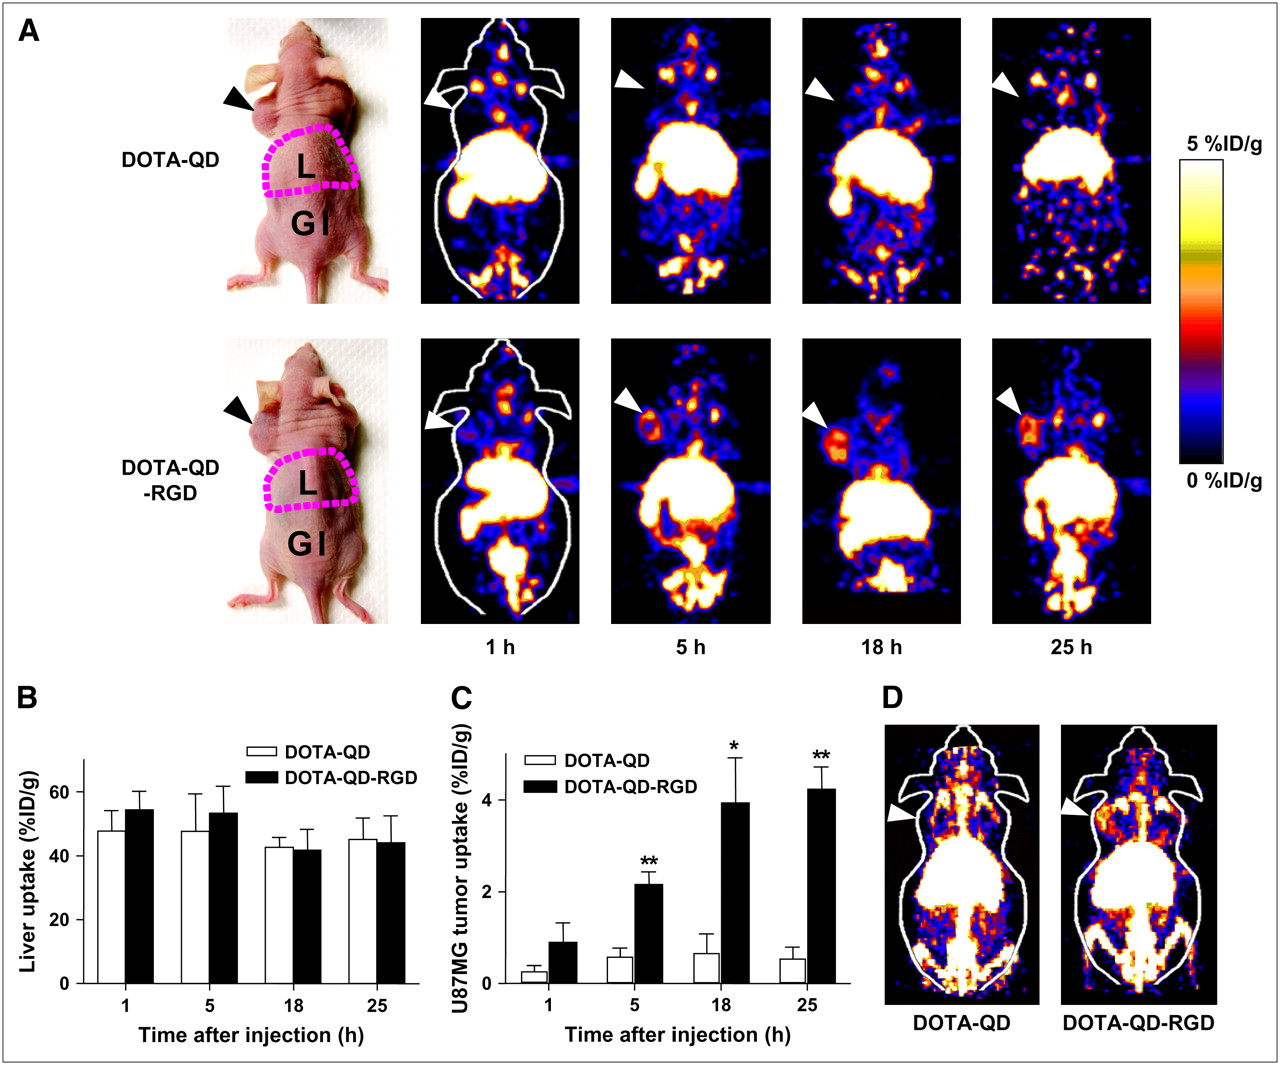
The 64Cu labeling yield was greater than 90% for both QD conjugates (on the basis of 50 pmol of QD per 37 MBq of 64Cu; n = 3). Using NIRF imaging alone, we previously found that the liver, spleen, lymph nodes, and bone marrow all showed prominent uptake of the QD conjugates (12). The same phenomenon was observed in this study with small-animal PET; the liver, spleen, and multiple lymph nodes were clearly visualized (Fig. 3A). Because the tomographic coronal slices shown here were 1 mm thick, bone marrow was not clearly visualized because of the curvature of the mouse spine.

In vivo PET of U87MG tumor–bearing mice with dual-function PET/NIRF probe. (A) Whole-body coronal PET images of mice at 1, 5, 18, and 25 h after injection of 7–14 MBq of 64Cu-labeled DOTA–QD or DOTA–QD–RGD. Arrowheads indicate tumors. Images shown are for slices that were 1 mm thick. GI = gastrointestinal tract; L = liver. (B) Liver uptake of 64Cu-labeled DOTA–QD and DOTA–QD–RGD over time, as quantified by ROI analysis of small-animal PET scans (n = 3 per group). (C) U87MG tumor uptake of 64Cu-labeled DOTA–QD and DOTA–QD–RGD over time, as quantified by ROI analysis of small-animal PET scans (n = 3 per group). (D) Two-dimensional whole-body projection of the 2 mice shown in A at 5 h after injection. Arrowheads indicate tumors. *P < 0.05. **P < 0.01.
Quantitative ROI analysis indicated that there was no significant difference in the liver uptake of the 2 QD conjugates (Fig. 3B). The uptake for both was about 50 %ID/g throughout the study, indicating that the majority of each injected QD conjugate was taken up by the reticuloendothelial system (RES) (28). The difference in the U87MG tumor uptake of the 2 QD conjugates was significant at all time points examined, except at 1 h after injection (Fig. 3C). The tumor uptake of DOTA–QD was less than 1 %ID/g, suggesting minimal passive targeting in the tumor, whereas the uptake of DOTA–QD–RGD was significantly higher (2.2 ± 0.3 [mean ± SD], 4.0 ± 1.0, and 4.3 ± 0.5 %ID/g at 5, 18, and 25 h after injection, respectively; n = 3). The whole-body 2-dimensional projection images of the 2 mice at 5 h after injection are shown in Figure 3D. The bone marrow, lymph nodes, and liver were all clearly visualized. Although having a much lower signal than these organs, the U87MG tumor of the mouse injected with 64Cu-labeled DOTA–QD–RGD was clearly seen. There was no appreciable contrast between the tumor and the contralateral background in the mouse injected with 64Cu-labeled DOTA–QD.
Ex Vivo Small-Animal PET Imaging and NIRF Imaging
On the basis of the small-animal PET findings (U87MG tumor uptake was significantly higher than the uptake in the control at 5 h after injection) and the findings of our previous NIRF imaging study (U87MG tumor uptake reached a peak at about 4–6 h after injection) (12), another U87MG tumor–bearing mouse was injected with 64Cu-labeled DOTA–QD–RGD and euthanized at 5 h after injection. Ex vivo small-animal PET imaging and NIRF imaging were performed on harvested tissues (Figs. 4A and 4B). The trends for signal intensity were similar with both imaging modalities; the liver, spleen, and bone marrow all had very strong signals, and the U87MG tumor had significantly higher uptake than the heart, kidneys, and muscle. ROI analysis of both in vivo and ex vivo PET imaging data produced similar tissue-to-muscle ratios (Table 1). The liver-, spleen-, bone-, and kidney-to-muscle ratios were about 100:1, 30:1, 10:1, and 2:1, respectively. The U87MG tumor-to-muscle ratios for DOTA–QD–RGD and DOTA–QD were about 4:1 and 1:1, respectively. ROI analysis of the NIRF imaging data produced liver-, spleen-, bone-, kidney-, and tumor-to-muscle ratios of about 100:1, 50:1, 40:1, 1:1, and 2:1, respectively (Table 1).
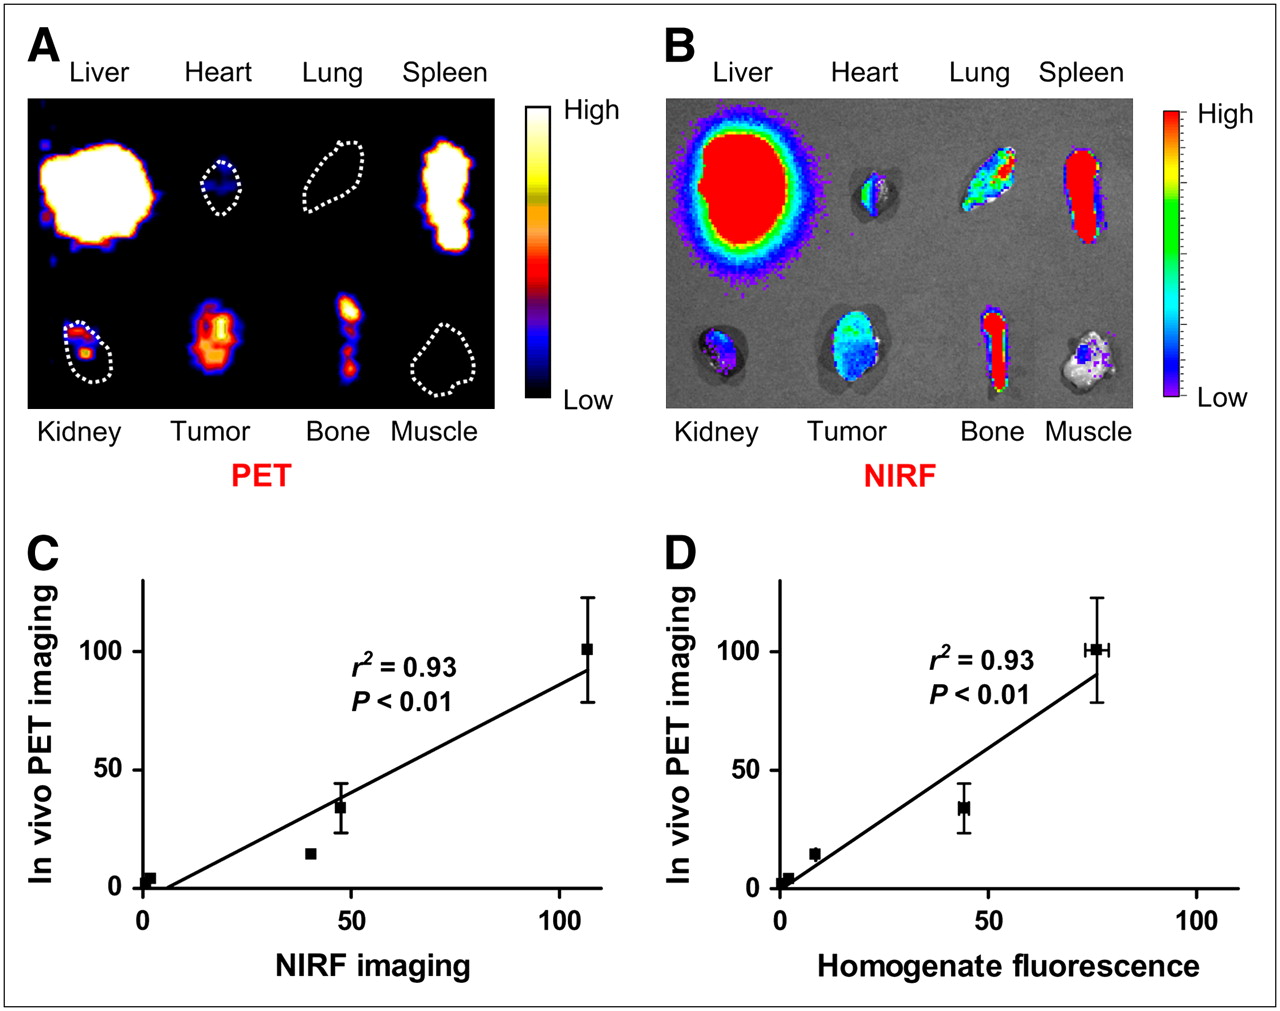
Ex vivo PET imaging and NIRF imaging. (A) PET image of harvested tissues at 5 h after injection of 64Cu-labeled DOTA–QD–RGD. (B) NIRF image of harvested tissues at 5 h after injection of 64Cu-labeled DOTA–QD–RGD. (C) Correlation among kidney-, U87MG-, bone-, spleen-, and liver-to-muscle ratios measured by in vivo PET and ex vivo NIRF imaging. (D) Correlation among kidney-, U87MG-, bone-, spleen-, and liver-to-muscle ratios measured by in vivo PET and tissue homogenate fluorescence.
Tissue-to-Muscle Ratios Measured by Different Methods
Tissue homogenate fluorescence was also measured to quantify the QD signal intensity. The tissue-to-muscle ratios closely resembled the results obtained from PET and NIRF imaging, except for bone (Table 1). Because the whole femoral bone was homogenized, rather than the bone marrow only, the fluorescence signal in the bone was much lower when this tissue was normalized by weight because the bone marrow was significantly diluted by the bone homogenate. Given all of the quantitative data obtained at 5 h after injection of DOTA–QD–RGD, the tissue-to-muscle ratios were plotted to correlate the quantification results obtained by different measurement methods. Excellent linear correlation was found between the ratios measured by in vivo PET imaging and ex vivo NIRF imaging (Fig. 4C; r2 = 0.93) as well as between the in vivo PET and tissue homogenate fluorescence data (Fig. 4D; r2 = 0.93). Thus, in vivo PET of the dual-function QD-based probe can allow for accurate quantification of the probe distribution in tumor-bearing mice independent of the depth of the tissue.
Histologic Analysis
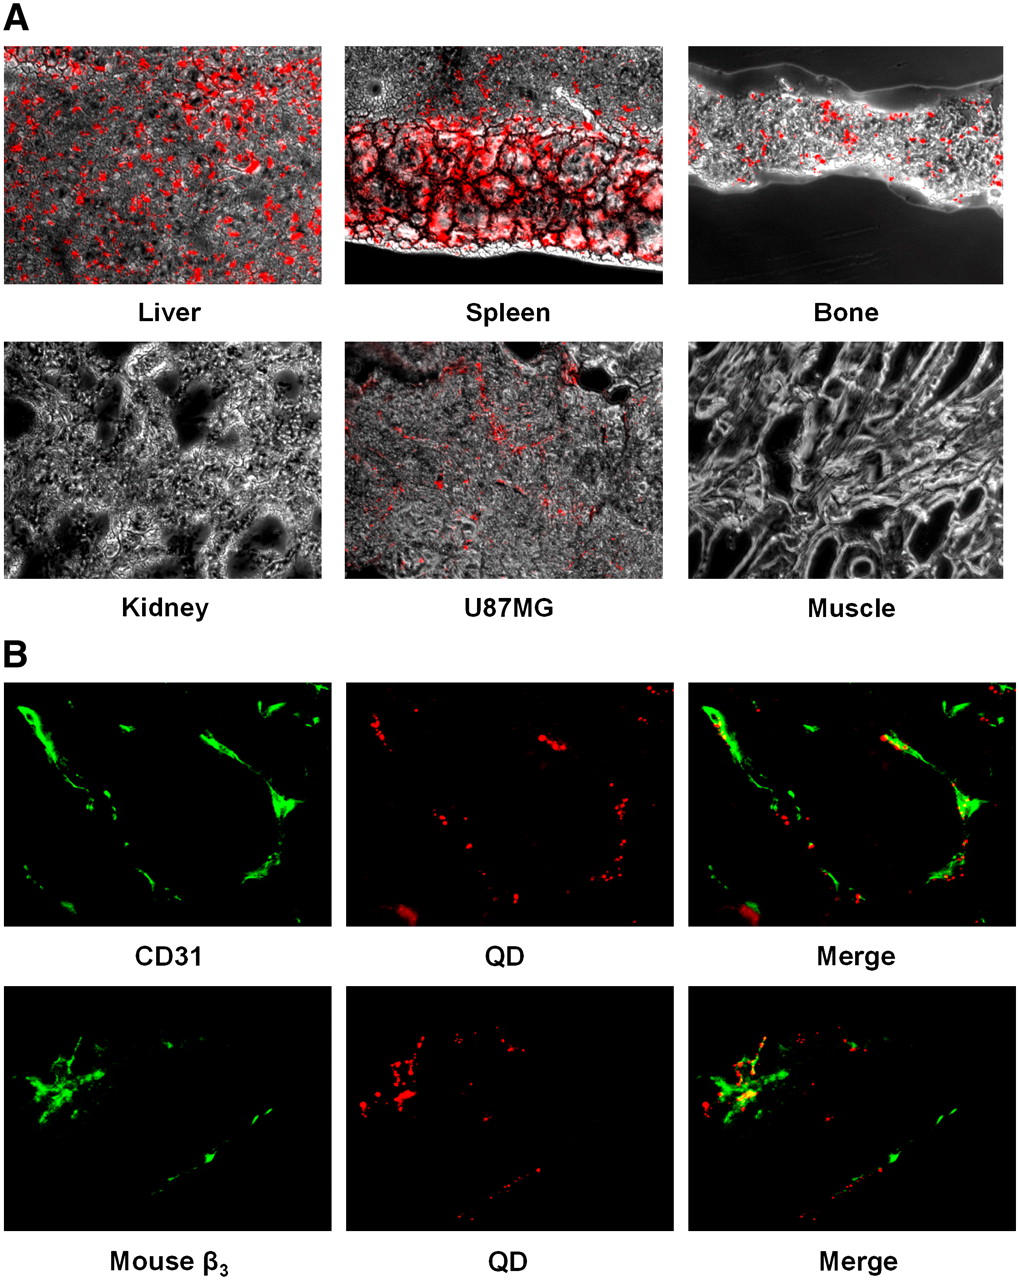
The QD fluorescence of the frozen tissue slices overlaid with the bright-field images is shown in Figure 5A. To better illustrate the relative fluorescence intensity, all images were acquired under the same experimental setup. Fluorescence images of the liver, spleen, and bone were displayed at the same scale; all had strong QD fluorescence. Fluorescence images of the U87MG tumor, kidneys, and muscle were also displayed at the same scale; there was virtually no QD fluorescence in the kidneys and muscle, but there was appreciable QD fluorescence in the U87MG tumor. Of note is that QD fluorescence in the tumor tissue was not homogeneous.

Histologic analysis of DOTA–QD–RGD distribution in U87MG tumors and other tissues. (A) Overlay of bright-field and QD fluorescence images of frozen tissue slices (5 μm thick). All images were acquired under same experimental conditions. QD fluorescence images of liver, spleen, and bone are displayed at same scale. QD fluorescence images of kidneys, U87MG tumor, and muscle are also displayed at same scale. (B) Immunofluorescence staining (CD31 and mouse β3) of frozen U87MG tumor slices from mice injected with 64Cu-labeled DOTA–QD–RGD. Note that U87MG cells were not stained by mouse β3 because integrin αvβ3 on U87MG cells is of human origin. Good overlay was observed in both cases, confirming that DOTA–QD–RGD mainly targeted integrin αvβ3 on tumor vasculature.
Excellent overlay between QD fluorescence and CD31 staining of tumor vessels confirmed that the vast majority of injected DOTA–QD–RGD did not extravasate (far) from the tumor vessels (Fig. 5B). Good overlay between QD fluorescence and the vasculature stained with anti–mouse β3 monoclonal antibody further confirmed the integrin αvβ3 specificity of DOTA–QD–RGD (Fig. 5B). No observable QD fluorescence was detected in the U87MG tumor tissue of mice injected with DOTA–QD (data not shown). Taken together, these results indicate that DOTA–QD–RGD targets mainly the tumor vasculature through a specific RGD–integrin αvβ3 interaction, with little extravasation.
DISCUSSION
Each molecular imaging modality has its advantages and disadvantages (29). The dual-function PET/NIRF probe described here can offer synergistic advantages over the NIRF-only QD-based probe, one of which is the significantly lower potential toxicity. For in vivo biomedical applications, the toxicity of Cd-based QDs is a major concern, because free Cd2+ may be released from the cadmium chalcogenide materials and lead to cytotoxicity (30,31). Multiple factors can affect the potential toxicity of QD-based materials; these include the overall size, charge, concentration, coating (including capping material and functional groups), and oxidative, photolytic, and mechanical stability (1). One way to reduce toxicity is to develop non–Cd-based semiconductor materials (32). The other way—and possibly the simplest way—to reduce potential cytotoxic risk is to use smaller amounts of QDs. The dual-modality approach described in this study requires a much smaller amount of QD (∼20 pmol) to yield tumor contrast, because of the high sensitivity of PET imaging, than NIRF imaging alone (for which ∼200 pmol of QD is needed) and therefore significantly decreases the potential cytotoxic risk (12).
Another advantage of the PET/NIRF probe is the ability to accurately quantify fluorescence intensity in vivo and ex vivo. Quantitative ROI analysis of noninvasive PET data as a true reflection of the probe biodistribution was rigorously validated in our previous PET studies (20,21,23,24,33). In the present study, the quantification data obtained from in vivo PET and ex vivo PET matched closely. The tumor-to-muscle ratios obtained from NIRF imaging were similar to those obtained from PET imaging for the liver and spleen, because the majority of the injected QD conjugate was taken up by the RES shortly after injection. The bone marrow uptake measured by NIRF imaging was significantly higher than that measured by PET imaging, likely because of the partial-volume effect of PET, in that the bone is smaller than the resolution of the small-animal PET scanner (about 2 mm).
Certain differences between different measurements may be caused by the shedding of the polymer coating from the QD, because the PET scanner detects 64Cu but NIRF imaging measures QD fluorescence. The hydrophilic polymer (containing both RGD peptide and 64Cu) can also target integrin αvβ3 in the U87MG tumor; this factor likely caused the increase in tumor uptake after 5 h after injection, as revealed by PET (Figs. 3A and 3C). Because no significant radioactivity accumulation was observed in urine throughout this study, the fraction of polymer coating shedding was likely very small (hydrophilic polymer is typically cleared through the renal pathway), at least until 5 h after injection.
Overall, the quantitative data obtained from the different measurement methods were quite comparable. Such consistency suggests that the small-animal PET imaging results (64Cu was detected) are a close reflection of the actual QD conjugate distribution. Taken together, all measurements (in vivo and ex vivo small-animal PET imaging, NIRF imaging, and tissue homogenate fluorescence measurements) indicated that the majority of DOTA–QD–RGD was taken up by the RES in the liver, spleen, and bone marrow. The liver-, spleen-, and kidney-to-muscle ratios were about 100:1, 40:1, and 1:1, respectively. The bone marrow uptake of the QD conjugate was prominent, but the quantification results varied among the different measurement methods. The U87MG tumor-to-muscle ratios for DOTA–QD–RGD and DOTA–QD were about 3:1 (4:1 based on PET and 2:1 based on NIRF imaging) and 1:1, respectively.
The delivery of nanoparticles to solid tumors is a vexing problem, even with the local hyperpermeability of the tumor vasculature. The absolute U87MG tumor uptake of 64Cu-labeled DOTA–QD–RGD was comparable to that of 64Cu-labeled c(RGDyK) but lower than that of 64Cu-labeled tetrameric RGD peptide (34,35). In the U87MG tumor, both the tumor cells and the tumor vasculature have high integrin αvβ3 expression that can be recognized by RGD peptides (21,23). Thus, the key question is whether DOTA–QD–RGD is targeting the tumor vasculature (no extravasation needed) or targeting the tumor cells (extravasation required). Our ex vivo histology data clearly indicate minimal extravasation of this dual-function probe, which in turn leads to relatively low tumor uptake.
To further improve tumor-targeting efficacy, smaller QDs (36–39) will be needed for future studies. It is expected that smaller QDs may extravasate more efficiently and produce better in vivo targeting efficacy for both the tumor vasculature and tumor cells. Smaller QDs are also expected to have lower RES uptake, which can result in better imaging properties. QDs have relatively large surface areas that can be conjugated with multiple targeting ligands and imaging labels for multiparameter imaging of biomarkers, with the ultimate goal of guiding therapy selection and predicting the response to therapy. The ability to accurately assess the pharmacokinetics and tumor-targeting efficacy of QD-based conjugates, as we have demonstrated here, is of crucial importance to future multitargeting studies (targeting multiple targets with the same QDs) and multiplexing studies (simultaneously targeting multiple targets, each with a different QD).
CONCLUSION
For the first time, we have quantitatively evaluated the tumor-targeting efficacy of dual-function QD-based probes using both PET imaging and NIRF imaging. Noninvasive PET with radiolabeled QD conjugates provides a robust and reliable measure of in vivo probe distribution. The dual-function PET/NIRF probe can render sufficient tumor contrast at a concentration much lower than that required for in vivo NIRF imaging, thereby significantly reducing potential toxicity. This approach also overcomes the tissue penetration limitation of NIRF imaging, thereby allowing quantitative in vivo–targeted imaging in deep tissue, and may greatly facilitate future biomedical applications of QDs.
Acknowledgments
This work was supported by the National Institute of Biomedical Imaging and Bioengineering (NIBIB) (R21 EB001785), the National Cancer Institute (NCI) (R01 CA119053, R21 CA121842, R21 CA102123, P50 CA114747, U54 CA119367, and R24 CA93862), the Department of Defense (DOD) (W81XWH-07-1-0374, W81XWH-04-1-0697, W81XWH-06-1-0665, W81XWH-06-1-0042, and DAMD17-03-1-0143), and a Benedict Cassen Postdoctoral Fellowship from the Education and Research Foundation of the Society of Nuclear Medicine, Inc. We thank Drs. Gang Niu, Alireza Ebrahimnejad, and Lina He for their excellent technical support. We also thank the cyclotron team at the University of Wisconsin, Madison, for 64Cu production.
Footnotes
-
COPYRIGHT © 2007 by the Society of Nuclear Medicine, Inc.
References
- Received for publication May 1, 2007.
- Accepted for publication August 23, 2007.


Jump to section
Related Articles
Cited By...
- In Vivo Cancer Dual-Targeting and Dual-Modality Imaging with Functionalized Quantum Dots
- Nanoparticles Modified by Encapsulation of Ligands with a Long Alkyl Chain to Affect Multispecific and Multimodal Imaging
- Quantum Dots for Cancer Research: Current Status, Remaining Issues, and Future Perspectives
- Photoacoustic Imaging
- Cancer Nanotargeted Radiopharmaceuticals for Tumor Imaging and Therapy
- Quantum Dots for In Vivo Small-Animal Imaging
- Multimodality Molecular Imaging of Tumor Angiogenesis